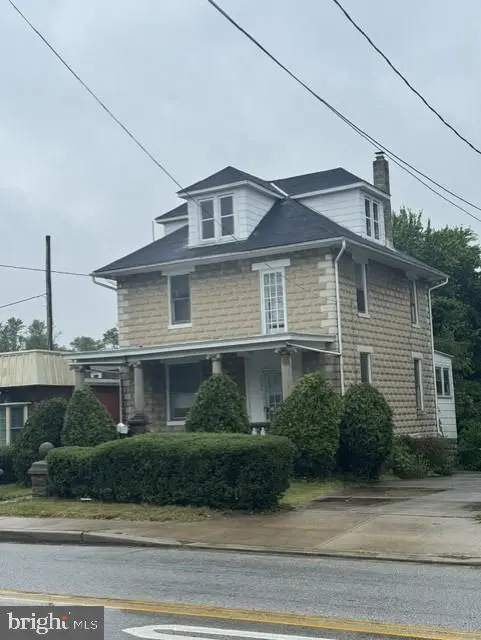
2904 Taylor Ave · Parkville, MD
Flood risk 1/10 · Minimal
- FEMA flood zone
- X (unshaded)
- Chance of flooding over 30 yrs
- 0.0%
- Est. flood insurance / yr
- $473 – $860
Fire risk 1/10 · Minimal
- Est. fire insurance / yr
- $755 – $1,403
Heat risk 7/10 · Major
- Hot days now (above 104°F)
- 7 days/yr
- Hot days in 30 yrs
- 15 days/yr
Wind risk 6/10 · Moderate
- Chance of severe wind over 30 yrs
- 27.0%
Air-quality risk 4/10 · Minor
- Unhealthy air days now
- 5 days/yr
- Unhealthy air days in 30 yrs
- 7 days/yr
Risk factors via First Street. Map © Google.
Why this score? — see what drove the B+ grade
The composite is a weighted blend of 9 inputs, each scored 0–100. Each bar is that input's sub-score; the figure is the points it added to the 100-point composite (weight × sub-score).
- Cash flow +29.5/30.0
- ARV discount +15.0/15.0
- DSCR +10.0/10.0
- 1% rule +8.0/10.0
- Rent growth +4.2/5.0
- Livability +3.9/5.0
- Condition / age +2.5/5.0
- Schools +2.3/10.0
- Appreciation +0.0/10.0
$210,000
🖨 Deal sheet 📄 Offer letter ✓ Due diligence
Listing remarks
Investors WELCOME!!! This 5 bedroom 1 full bath home is ready for your remodel! The property is zoned residential and commercial and sits on a . 25 acre lot. Driveway can fir 2-3 cars. Schedule your appointment today because this is priced to sell!!! For all offer, the owners are Edward Keefer & Cheryl Balassone.
Key facts
- 0.25 acre lot
- Built 1918
- Listed 11 days
Property features AI
Finance
- Other: Fee simple ownership; Below-grade area of 672; Above-grade finished area of 1,505; Total below-grade area reported as 672; Ground rent paid annually
Exterior
- Parking: Driveway
- Utilities: Public water; Public sewer
- Home design: Detached property
- Construction: Stucco construction
- Exterior features: Detached structure; Above-grade and below-grade other structures; Basement (unfinished)
Interior
- Bedrooms: Four bedrooms on the first upper level; One bedroom on the second upper level
- Bathrooms: One full bathroom (all upper levels)
- Heating & cooling: Radiator heating; Electric heating fuel; Natural gas hot water
- Interior features: Living room; Dining room; Family room; Mud room
Neighborhood map
What this means for you Summary
Snapshot
- This is a 5-bed/1.0-bath single-family listed at $210k.
Deal economics
- At list price, monthly cash flow is $750 ($9k/yr) — positive.
- The deal already cash-flows at list — no discount required.
- Meets the 1% rule at list price ($3k rent vs $210k).
- Cap rate 10.6% vs local median 5.3% in Parkville — top-decile yield for the area; either an underpriced asset or a hidden risk that comps aren't pricing in. Stress-test before assuming the spread holds.
Location & tenants
- Location reads 77/100 on livability (#77 in MD, #2,839 nationally) — a middle-class / working-renter tenant base. Strengths: commute A+, housing A+, health & safety A+; Watch: schools F, crime F.
- Baltimore County Public Schools (suburban): math 15% / reading 34% proficiency, ranked #11 of 24 in MD (top 46%) — low school quality limits family demand, transient renter base, plan for 1-2y turnover.
- Market conditions: Rents rising fast (+6.7%/yr); 225 active listings in the ZIP; 6 comparable units currently listed for rent nearby; rentals lingering (median 44d on market — plan ~5-8 weeks vacancy on turnover, expect pricing pressure); 67% of comp listings sitting > 30 days — soft ceiling on asking rent; solid renter incomes; 1,511 units permitted in Baltimore County in 2024 (643 in 5+ unit buildings).
- This rent runs 39% of the median local income ($84k/yr) — at the standard rent-burdened threshold; future hikes will face affordability resistance.
Forward outlook
- Local home prices are declining (-3.0%/yr); year-one equity from $1k of loan paydown is wiped out by about $6k of value loss. Plan a longer hold.
- Baltimore County population projected at +12% by 2050 — modest demand growth; plan on rents tracking national, not racing it.
- At projected returns (-3.0% appreciation + 6.7% rent growth), your $59k cash investment doubles in ~7 years — after that, you're playing with house money.
Negotiation context
- Only 11 days on market — expect competitive offers; lowballing is unlikely to land.
- Current owner paid $50k; list at $210k implies a 320% gain — meaningful room to come down on a strong offer.
Risks & watch-outs
- Watch-outs: built in 1918 — expect roof / HVAC / electrical / plumbing capex.
- Climate carrying-cost: major wind risk, 27% chance of damaging wind over 30y; extreme-heat days projected 7→15/yr by 2055 (HVAC capex compounding) — expect insurance premiums to compound above CPI over the hold.
Questions for the listing agent
- Built in 1918 — when were the roof, HVAC, electrical panel, plumbing, and water heater last replaced?
- Is there a deadline driving the sale (1031 exchange, divorce, estate, relocation)? That informs how much negotiation room exists.
- Schools are F-rated, which usually means shorter tenancies and higher turnover. Who's the typical renter profile here, and what's been the actual vacancy rate?
- Crime grade is F in this area — have there been break-ins, vandalism, or insurance claims at this property in the last 3 years? What carrier currently insures it and at what premium?
- What's the average days-on-market for RENTAL listings here right now (not sales)? A rising rental-DOM trend means longer vacancies and softer asking-rent achievability than the comps imply.
- What's the recent tenant-quality profile in this submarket — average credit score on applications, eviction rate, late-payment / NSF rate, and stable-employment percentage? A property-management company in the area should have these aggregated.
- How much new for-sale + rental construction is in the pipeline within 1–3 miles? Heavy new supply typically softens prices + rents 12–24 months out; constrained supply supports both.
Investment metrics
- 1% rule
- 1.30% ✓
- Cap rate
- 10.58%
- Cash-on-cash
- 15.31%
- DSCR
- 1.68
- GRM
- 6.4
CMA / ARV
- ARV (on-the-fly)
- $337,120
- Comps found
- 12
Show comp detail 12 sales within ~0.75 mi
| Address | Dist | Beds/Ba | Sqft | Sold | Price | $/sf | Match |
|---|---|---|---|---|---|---|---|
| 3010 Linwood Ave | 0.20mi | 4/2.5 (-1) | 1,518 (+1%) | 17mo | $340,000 | $224 | 64 |
| 3025 Woodside Ave | 0.42mi | 4/2.5 (-1) | 1,440 (-4%) | 3mo | $325,000 | $226 | 60 |
| 3203 Glendale Ave | 0.42mi | 4/2.5 (-1) | 1,582 (+5%) | 7mo | $305,000 | $193 | 55 |
| 2812 Bauernwood Ave | 0.60mi | 4/3.0 (-1) | 1,533 (+2%) | 8mo | $370,000 | $241 | 50 |
| 2906 Inglewood Ave | 0.61mi | 5/2.5 | 1,592 (+6%) | 9mo | $317,000 | $199 | 48 |
| 2717 Glendale Rd | 0.33mi | 4/3.0 (-1) | 1,391 (-8%) | 13mo | $377,500 | $271 | 48 |
| 3103 Glendale Ave | 0.33mi | 4/2.0 (-1) | 1,400 (-7%) | 19mo | $160,000 | $114 | 48 |
| 3101-H Texas Ave | 0.53mi | 4/1.0 (-1) | 1,368 (-9%) | 10mo | $300,000 | $219 | 47 |
| 7908 Aiken Ave | 0.59mi | 4/2.0 (-1) | 1,652 (+10%) | 8mo | $299,999 | $182 | 41 |
| 3302 Garnet Rd | 0.58mi | 4/2.0 (-1) | 1,709 (+14%) | 3mo | $385,000 | $225 | 38 |
| 2904 Rosalie Ave | 0.51mi | 4/2.0 (-1) | 1,302 (-14%) | 11mo | $300,000 | $230 | 35 |
| 7717 Westmoreland Ave | 0.74mi | 4/3.0 (-1) | 1,718 (+14%) | 6mo | $300,000 | $175 | 24 |
Match score weights: distance 35% · size 25% · config 20% · recency 20%. Top-matched comps best support the ARV.
Projected returns pro-forma
-3.0% appreciation · 6.68% rent growth · sell at horizon
- IRR
- 10.0%
- Equity multiple
- 1.41×
- Total profit
- $24,250
- Equity at exit
- $31,312
- IRR
- 21.9%
- Equity multiple
- 3.20×
- Total profit
- $129,114
- Equity at exit
- $18,157
Cash invested: $58,800 (down + closing). Projections, not guarantees.
Landlord ↔ Tenant lean methodology
- Overall (STATE)
- 27 Tenant-Leaning
- State Maryland
- 27 Tenant-Leaning · D+14
- County
- — inherits STATE
- City
- — inherits STATE
ZIP-level market 21234
- Rents YoY
- 6.7%
- Active inventory
- 225
- Price-to-rent
- 6.4×
Monthly cashflow live
- Estimated rent
- $2,731 high interval (Pro) →
- Mortgage (P&I)
- −$1,101
- Tax from tax record
- −$219 /mo · $2,622/yr
- Insurance
- −$88
- HOA
- −$0
- Vacancy / Maint / Mgmt
- −$574
- Net cashflow
- $750
Break-even live
UW: 25.0% down · 7.5% · 30yr · 1.5% tax · 5.0% vac · 8.0% maint · 8.0% mgmt
Financing live
Cash to close
- Down payment
- $52,500
- Closing costs
- $6,300
- Reserves months
- —
- Total cash needed
- —
Loan-product check · same deal, 3 products live
Conventional
25% down · 7.5% · 30yr
- Down + closing
- —
- Monthly P&I
- —
- Monthly cashflow
- —
- DSCR
- —
- Eligible?
- —
Personal DTI + credit; lowest rate.
DSCR
20% down · 8.5% · 30yr
- Down + closing
- —
- Monthly P&I
- —
- Monthly cashflow
- —
- DSCR
- —
- Eligible?
- —
No personal income docs; deal must DSCR.
Hard money
10% down · 12.0% · 12mo
- Down + closing
- —
- Monthly P&I
- —
- Monthly cashflow
- —
- DSCR
- —
- Eligible?
- —
Short-term bridge; refi at stabilization.
Rent comps 6 comps
| Address | Beds | Baths | Sqft | Rent | $/sqft | DOM | Units | Dist |
|---|---|---|---|---|---|---|---|---|
| 2912 Hillcrest Ave Parkville, MD | 5.0 | 2.0 | 1648 | $2,900 | $1.76 | 43d | 1 | 0.17mi |
| 2518 Moore Ave Parkville, MD | 4.0 | 1.5 | 1896 | $2,700 | $1.42 | 43d | 1 | 0.76mi |
| 8503 Kings Ridge Rd Parkville, MD | 4.0 | 2.0 | 1200 | $2,100 | $1.75 | 4d | 1 | 0.92mi |
| 5 Belhaven Dr Nottingham, MD | 4.0 | 1.5 | 1554 | $2,000 | $1.29 | 43d | 1 | 1.33mi |
| 8768 Cimarron Cir Parkville, MD | 4.0 | 1.5 | 1752 | $2,395 | $1.37 | 23d | 1 | 1.41mi |
| 6504 Rosemont Ave Baltimore, MD | 5.0 | 3.0 | 2098 | $2,900 | $1.38 | 43d | 1 | 1.44mi |
Listing history 8 events
-
2026-06-04status $210,000 Pending 11 DOM
-
2026-06-02remarks 317-char remark
-
2026-06-02days on market $210,000 Active 11 DOM
-
2026-06-01days on market $210,000 Active 10 DOM
-
2026-05-31days on market $210,000 Active 9 DOM
-
2026-05-23$210,000 Active
-
2026-05-22historical $210,000
-
1991-02-28soldstatus $50,000
ⓘ Source: listings_history table (triggers on properties + properties_extension) + one-shot
backfill from property_details.listing_events for pre-trigger history.
Tax reassessment forecast MD · Partial reset (capped growth)
- Current annual tax
- $2,622 · $219/mo
- Projected year-2 tax
- $2,622 · $219/mo
- Expected delta
- $0/yr ($0/mo · 0.0%)
ⓘ Screening estimate from a state-policy table — verify with the county assessor before closing.
Climate risk First Street
- Flood 1/10 Low FEMA zone X (unshaded) · 0% chance over 30 yrs
- Wildfire 1/10 Low
- Heat 7/10 Severe 7 d/yr ≥104°F today · 15 d/yr by 30 yrs out
- Wind 6/10 Major 27% chance of damaging wind over 30 yrs
- Air quality 4/10 Moderate 5 unhealthy d/yr today · 7 by 30 yrs out
Nearby sold comps map
Loading sold comps map…
Walkable amenities ~0.75 mi
Loading nearby amenities…
Taxation est. · year 1
- Rental income
- $32,772
- − Mortgage interest
- −$11,763
- − Property taxes
- −$2,622
- − Insurance
- −$1,050
- − Repairs & maintenance
- −$2,622
- − Management
- −$2,622
- − Depreciation
- −$6,109
- Taxable income
- $5,984
- Est. tax owed @ 24.0%
- −$1,436
- After-tax cash flow
- $7,566/yr
For passive investors: Depreciation is non-cash, so a rental often shows a tax loss while cash-flowing — sheltering income. Rental losses are passive: they offset passive income freely, and up to $25,000/yr can offset ordinary (W-2) income if you actively participate and your MAGI is under $100k (phasing out to $0 by $150k); unused losses carry forward. On sale, claimed depreciation is recaptured at up to 25%, and gains may owe capital-gains tax (a 1031 exchange can defer both). Figures are a year-1 estimate at your 24.0% rate — not tax advice; consult a CPA.
Schools (NCES district)
- District
- Baltimore County Public Schools
- NCES district ID
- 2400120
- Math proficiency
- 15% ▼ -16.00%
- Reading proficiency
- 34% ▼ -5.00%
- Median HH income
- $66,746
- Composite
- 23.17/100
- National rank
- #7948
- State rank
- #11 of 24 in MD
Livability — Parkville
- Score
- 77/100
- State rank
- #77
- US rank
- #2839
Category grades
Schools grade is shown separately in the Schools card above.
Census & demographics
- Census place
- Parkville, MD
- County
- Baltimore County · 769,527 people
- City population
- 66,334
- Metro
- Baltimore-Columbia-Towson, MD
- Population (ZIP)
- 66,334
- Household income
- $83,517
- Rent vs Own
- Severe rent burden
- 2719.0
Population outlook (Baltimore County) Hauer SSP2
- Today (2025)
- 885,518 people
- By 2030
- 909,272 · +2.7%
- By 2040
- 951,547 · +7.5%
- By 2050
- 990,955 · +11.9%
- By 2075
- 1,086,411 · +22.7%
- By 2100
- 1,135,078 · +28.2%
Race, ethnicity, and origin ACS 2023
- Neighborhood character
- Diverse neighborhood (Simpson 0.58)
- Race & ethnicity
- White 58% Black 28% Asian 5% Hispanic / Latino 5% Two or more races 5%
- Common ancestry
- Romanian 5% Lithuanian 1% Italian 1%
- Foreign-born
- 10% · Canada, China, South Korea
- Languages at home
- 89% English-only · Spanish 3% Other Indo-European 2% Tagalog/Filipino 1%
Political lean MEDSL · Baltimore
- 2024 margin
- Strong D (+24.5) · D 61.0% · R 36.5% · Other 2.5%
- 2008→2024 swing
- +9.9pp toward D · 2008: 14.6pp · 2024: 24.5pp
- All cycles
- 2024: D+24.5 2020: D+27.0 2016: D+17.4 2012: D+16.4 2008: D+14.6
Not yet ingested
- Civics
- —
Market trends
- HPI YoY
- ▼ -247.04%
- Current HPI
- 254.3824
- Rent YoY
- ▲ 6.68%
- Metro
- Baltimore-Columbia-Towson, MD
- State GDP YoY
- ▲ 2.97%
- F500 in state
- 12
Industry mix (Fortune 500 HQ in MD)
| Industry | F500 HQs | Revenue |
|---|---|---|
| Aerospace / Defense | 1 | $71B |
|
||
| Utilities | 1 | $25B |
|
||
| Hotels | 1 | $24B |
|
||
| Consumer Goods | 1 | $7B |
|
||
| Real Estate | 1 | $6B |
|
||
| Chemicals | 1 | $2B |
|
||
Price history
+320.0% since first listed3 events — show timeline
- 2026-05-23 Listed $210,000 BRIGHT MLS
- 2026-05-22 Coming Soon $210,000 BRIGHT MLS
- 1991-02-28 Sold (Public Records) $50,000 Public Records
Property tax history
+2.9%/yrLatest (2025): $2,622 · +4.3% YoY. Source: county tax records.
Cash-flow waterfall
monthlySold comps — $/sqft
last 12 mo · ≤1 miLoading sold comps…