2200 Cedar St · Idabel, OK
Flood risk 1/10 · Minimal
- FEMA flood zone
- X (unshaded)
- Chance of flooding over 30 yrs
- 0.0%
- Est. flood insurance / yr
- $507 – $1,088
Fire risk 4/10 · Minor
- Est. fire insurance / yr
- $2,463 – $4,575
Heat risk 7/10 · Major
- Hot days now (above 111°F)
- 7 days/yr
- Hot days in 30 yrs
- 22 days/yr
Wind risk 6/10 · Moderate
- Chance of severe wind over 30 yrs
- 22.0%
Air-quality risk 1/10 · Minimal
- Unhealthy air days now
- 0 days/yr
- Unhealthy air days in 30 yrs
- 0 days/yr
Risk factors via First Street. Map © Google.
Why this score? — see what drove the C+ grade
The composite is a weighted blend of 9 inputs, each scored 0–100. Each bar is that input's sub-score; the figure is the points it added to the 100-point composite (weight × sub-score).
- Cash flow +21.6/30.0
- Appreciation +9.6/10.0
- ARV discount +7.5/15.0
- DSCR +6.9/10.0
- Schools +4.8/10.0
- 1% rule +4.3/10.0
- Livability +3.2/5.0
- Rent growth +2.5/5.0
- Condition / age +2.5/5.0
$139,000
🖨 Deal sheet 📄 Offer letter ✓ Due diligence
Listing remarks
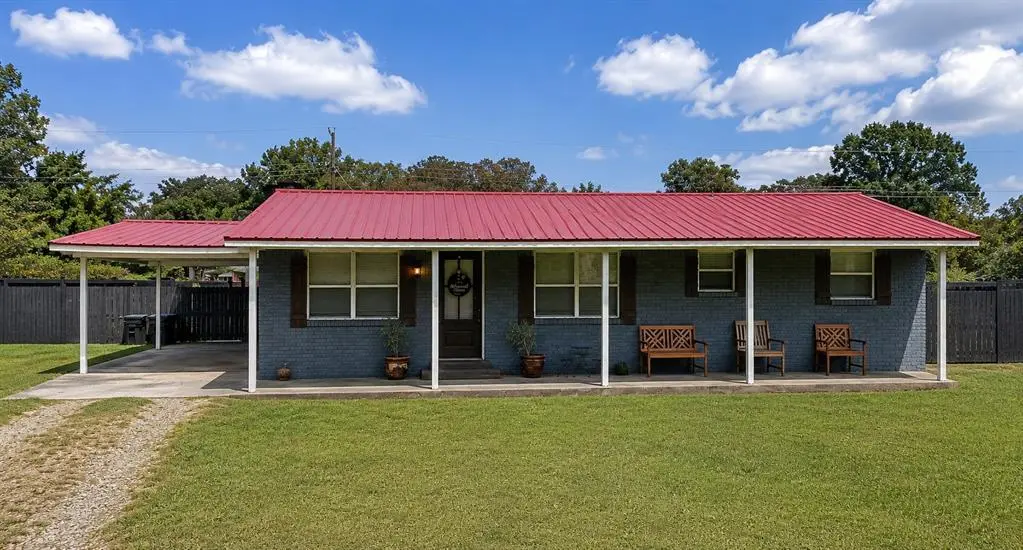
Beautifully updated home featuring a spacious layout and stylish finishes throughout. The stunning kitchen boasts dark cabinetry, stone-look countertops, and stainless appliances. Enjoy a large primary bath with double vanities, a metal roof, and attractive painted brick exterior. Situated on a generously sized lot with mature trees, this property offers both comfort and curb appeal. Conveniently located near schools, shopping, and local amenities.
Key facts
- Metal roof
- Generously sized lot
- Large primary bath
Tags
Property features AI
Finance
- Other: Homestead not claimed; Located in the Finney addition; Occupied
- Financial info: Not assumable; Buyer may qualify for a loan
- HOA & community: No mandatory association dues
Exterior
- Home design: Single-family residence; One story; Residential property; Existing structure
- Construction: Brick construction; Metal roof; Slab foundation; Built previously (existing)
- Exterior features: Covered porch; Corner lot
Interior
- Bedrooms: 3 bedrooms
- Bathrooms: 2 full bathrooms
- Interior features: One living area; No fireplace
Neighborhood map
What this means for you Summary
Snapshot
- This is a 2-bed/1.0-bath single-family listed at $139k.
Deal economics
- At list price, monthly cash flow is $212 ($3k/yr) — positive.
- The deal already cash-flows at list — no discount required.
- To meet the 1% rule (rent ≥ 1% of price), the offer needs to be $130k (6.5% below list).
- Recommended offer: $130k (6.5% below list) — sets the bar for 1% rule.
Location & tenants
- Location reads 63/100 on livability (#202 in OK) — a middle-class / working-renter tenant base. Strengths: cost of living A+, housing A-, health & safety A-; Watch: schools F, amenities F, commute F.
- Denison (rural): math 60% / reading 50% proficiency, ranked #16 of 513 in OK (top 3%) — acceptable for families but not a draw, mixed tenant base, ~2y average lease.
- Market conditions: 59 active listings in the ZIP; 1 comparable units currently listed for rent nearby; 16 units permitted in McCurtain County in 2024 (0 in 5+ unit buildings).
Forward outlook
- In year one you build about $14k of equity ($961 loan paydown + $13k appreciation (9.2% local appreciation)).
- McCurtain County population projected to shrink 4% by 2050 — rents likely to lag national; underwrite the cash flow, not the appreciation.
- At projected returns (9.2% appreciation + 3.0% rent growth), your $39k cash investment doubles in ~3 years — after that, you're playing with house money.
- By year 3, paydown + projected appreciation supports a ~$35k cash-out refi (75% LTV) — recoverable capital for the next deal without selling this one.
Negotiation context
- Only 8 days on market — expect competitive offers; lowballing is unlikely to land.
Risks & watch-outs
- Climate carrying-cost: major wind risk, 22% chance of damaging wind over 30y; extreme-heat days projected 7→22/yr by 2055 (HVAC capex compounding) — expect insurance premiums to compound above CPI over the hold.
Questions for the listing agent
- Built in 1969 — when were the roof, HVAC, electrical panel, plumbing, and water heater last replaced?
- Is there a deadline driving the sale (1031 exchange, divorce, estate, relocation)? That informs how much negotiation room exists.
- Schools are F-rated, which usually means shorter tenancies and higher turnover. Who's the typical renter profile here, and what's been the actual vacancy rate?
- What's the average days-on-market for RENTAL listings here right now (not sales)? A rising rental-DOM trend means longer vacancies and softer asking-rent achievability than the comps imply.
- What's the recent tenant-quality profile in this submarket — average credit score on applications, eviction rate, late-payment / NSF rate, and stable-employment percentage? A property-management company in the area should have these aggregated.
- How much new for-sale + rental construction is in the pipeline within 1–3 miles? Heavy new supply typically softens prices + rents 12–24 months out; constrained supply supports both.
Investment metrics
- 1% rule
- 0.93% ✗
- Cap rate
- 8.12%
- Cash-on-cash
- 6.54%
- DSCR
- 1.29
- GRM
- 8.9
CMA / ARV
No comps found within radius.
Projected returns pro-forma
9.2% appreciation · 3.0% rent growth · sell at horizon
- IRR
- 27.4%
- Equity multiple
- 3.10×
- Total profit
- $81,605
- Equity at exit
- $117,204
- IRR
- 24.2%
- Equity multiple
- 6.86×
- Total profit
- $227,904
- Equity at exit
- $244,683
Cash invested: $38,920 (down + closing). Projections, not guarantees.
Landlord ↔ Tenant lean methodology
- Overall (STATE)
- 83 Strongly Landlord-Friendly
- State Oklahoma
- 83 Strongly Landlord-Friendly · R+20
- County
- — inherits STATE
- City
- — inherits STATE
ZIP-level market 74745
- Home prices YoY
- 3.7%
- Active inventory
- 59
- Price-to-rent
- 8.9×
Monthly cashflow live
- Estimated rent
- $1,299 medium interval (Pro) →
- Mortgage (P&I)
- −$729
- Tax from tax record
- −$27 /mo · $327/yr
- Insurance
- −$58
- HOA
- −$0
- Vacancy / Maint / Mgmt
- −$273
- Net cashflow
- $212
Break-even live
UW: 25.0% down · 7.5% · 30yr · 1.5% tax · 5.0% vac · 8.0% maint · 8.0% mgmt
Financing live
Cash to close
- Down payment
- $34,750
- Closing costs
- $4,170
- Reserves months
- —
- Total cash needed
- —
Loan-product check · same deal, 3 products live
Conventional
25% down · 7.5% · 30yr
- Down + closing
- —
- Monthly P&I
- —
- Monthly cashflow
- —
- DSCR
- —
- Eligible?
- —
Personal DTI + credit; lowest rate.
DSCR
20% down · 8.5% · 30yr
- Down + closing
- —
- Monthly P&I
- —
- Monthly cashflow
- —
- DSCR
- —
- Eligible?
- —
No personal income docs; deal must DSCR.
Hard money
10% down · 12.0% · 12mo
- Down + closing
- —
- Monthly P&I
- —
- Monthly cashflow
- —
- DSCR
- —
- Eligible?
- —
Short-term bridge; refi at stabilization.
Rent comps 1 comps
| Address | Beds | Baths | Sqft | Rent | $/sqft | DOM | Units | Dist |
|---|---|---|---|---|---|---|---|---|
| 1307 SE Adams St Idabel, OK | 1.0 | 1.0 | 600 | $1,299 | $2.17 | 43d | 1 | 0.80mi |
Listing history 7 events
-
2026-06-18days on market $139,000 Active 8 DOM
-
2026-06-17days on market $139,000 Active 7 DOM
-
2026-06-16days on market $139,000 Active 6 DOM
-
2026-06-15days on market $139,000 Active 5 DOM
-
2026-06-13days on market $139,000 Active 3 DOM
-
2026-06-12remarks 452-char remark
-
2026-06-12$139,000 Active 2 DOM
ⓘ Source: listings_history table (triggers on properties + properties_extension) + one-shot
backfill from property_details.listing_events for pre-trigger history.
Tax reassessment forecast OK · Resets to sale price
- Current annual tax
- $327 · $27/mo
- Projected year-2 tax
- $1,251 · $104/mo
- Expected delta
- +$924/yr (+$77/mo · 282.6%)
ⓘ Screening estimate from a state-policy table — verify with the county assessor before closing.
Climate risk First Street
- Flood 1/10 Low FEMA zone X (unshaded) · 0% chance over 30 yrs
- Wildfire 4/10 Moderate
- Heat 7/10 Severe 7 d/yr ≥111°F today · 22 d/yr by 30 yrs out
- Wind 6/10 Major 22% chance of damaging wind over 30 yrs
- Air quality 1/10 Low 0 unhealthy d/yr today · 0 by 30 yrs out
Nearby sold comps map
Loading sold comps map…
Walkable amenities ~0.75 mi
Loading nearby amenities…
Taxation est. · year 1
- Rental income
- $15,588
- − Mortgage interest
- −$7,786
- − Property taxes
- −$327
- − Insurance
- −$695
- − Repairs & maintenance
- −$1,247
- − Management
- −$1,247
- − Depreciation
- −$4,044
- Taxable income
- $242
- Est. tax owed @ 24.0%
- −$58
- After-tax cash flow
- $2,487/yr
For passive investors: Depreciation is non-cash, so a rental often shows a tax loss while cash-flowing — sheltering income. Rental losses are passive: they offset passive income freely, and up to $25,000/yr can offset ordinary (W-2) income if you actively participate and your MAGI is under $100k (phasing out to $0 by $150k); unused losses carry forward. On sale, claimed depreciation is recaptured at up to 25%, and gains may owe capital-gains tax (a 1031 exchange can defer both). Figures are a year-1 estimate at your 24.0% rate — not tax advice; consult a CPA.
Schools (NCES district)
- District
- Denison
- NCES district ID
- 4009720
- Math proficiency
- 60% ▲ 10.00%
- Reading proficiency
- 50% ▲ 15.00%
- Median HH income
- $40,168
- Composite
- 47.83/100
- National rank
- #4869
- State rank
- #16 of 513 in OK
Livability — Idabel
- Score
- 63/100
- State rank
- #202
- US rank
- #15174
Category grades
Schools grade is shown separately in the Schools card above.
Census & demographics
- Census place
- Idabel, OK
- Population (ZIP)
- 9,756
Population outlook (McCurtain County) Hauer SSP2
- Today (2025)
- 32,668 people
- By 2030
- 32,323 · -1.1%
- By 2040
- 31,777 · -2.7%
- By 2050
- 31,436 · -3.8%
- By 2075
- 31,574 · -3.3%
- By 2100
- 30,839 · -5.6%
Race, ethnicity, and origin ACS 2023
- Neighborhood character
- Diverse neighborhood (Simpson 0.65)
- Race & ethnicity
- White 57% Two or more races 16% Black 13% Hispanic / Latino 9% Native American 9%
- Hispanic origin (detail)
- Mexican 7%
- Common ancestry
- Italian 3% Slovak 2% Lithuanian 2%
- Foreign-born
- 4% · Canada
- Languages at home
- 91% English-only · Spanish 6% Other Indo-European 1%
Political lean MEDSL · McCurtain
- 2024 margin
- Solid R (+68.9) · D 15.0% · R 83.9% · Other 1.1%
- 2008→2024 swing
- -21.9pp toward R · 2008: -47.0pp · 2024: -68.9pp
- All cycles
- 2024: R+68.9 2020: R+66.5 2016: R+63.9 2012: R+51.6 2008: R+47.0
Not yet ingested
- Civics
- —
Market trends
- HPI YoY
- ▲ 9.20%
- Current HPI
- 255.6557
- Rent YoY
- —
- Metro
- —
- State GDP YoY
- ▲ 1.55%
- F500 in state
- 6
Industry mix (Fortune 500 HQ in OK)
| Industry | F500 HQs | Revenue |
|---|---|---|
| Energy | 3 | $48B |
|
||
Price history
1 event — show timeline
- 2026-06-11 Listed $139,000 MLSOK
Property tax history
+2.1%/yrLatest (2025): $327 · +2.2% YoY. Source: county tax records.
Cash-flow waterfall
monthlySold comps — $/sqft
last 12 mo · ≤1 miLoading sold comps…