 Multi-family
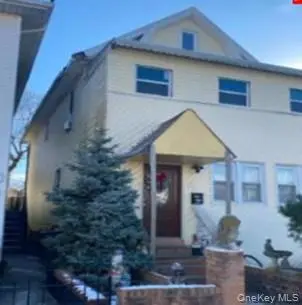
3728 Lyme Ave · New York, NY
Flood risk 8/10 · Major
- FEMA flood zone
- AE
- Chance of flooding over 30 yrs
- 0.99%
- Est. flood insurance / yr
- $1,737 – $8,500
Fire risk 1/10 · Minimal
- Est. fire insurance / yr
- $691 – $1,283
Heat risk 7/10 · Major
- Hot days now (above 97°F)
- 7 days/yr
- Hot days in 30 yrs
- 16 days/yr
Wind risk 6/10 · Moderate
- Chance of severe wind over 30 yrs
- 69.0%
Air-quality risk 4/10 · Minor
- Unhealthy air days now
- 5 days/yr
- Unhealthy air days in 30 yrs
- 7 days/yr
Risk factors via First Street. Map © Google.
Why this score? — see what drove the B- grade
The composite is a weighted blend of 9 inputs, each scored 0–100. Each bar is that input's sub-score; the figure is the points it added to the 100-point composite (weight × sub-score).
- Cash flow +24.4/30.0
- DSCR +7.9/10.0
- Appreciation +7.5/10.0
- ARV discount +5.9/15.0
- 1% rule +5.4/10.0
- Schools +5.0/10.0
- Rent growth +4.3/5.0
- Livability +3.8/5.0
- Condition / age +2.5/5.0
$943,800
🖨 Deal sheet 📄 Offer letter ✓ Due diligence
Multi-family units
County records classify this as Multi-Family (2-4 Unit). Listing-text estimate: 1 unit. estimate disagrees with records
Listing remarks
MFR 2fam residence offering approximately 1960 sq ft of living space with 6 total rooms, including 3 bedrooms and 2 full bathrooms. Built in 1925, the property is situated on an approximately 1925sq ft lot, providing exterior space within a residential setting. The home features a functional layout and is reported to be maintained in average condition. Located in a residential area with access to parks, transportation routes, and local services, supporting everyday convenience and connectivity. Market conditions in the area indicate increasing property values with typical marketing exposure. Multiple Open violations.
Key facts
- 1,925 sq ft lot
- Built 1925
- Listed 13 days
Property features AI
Exterior
- Parking: No carport; No designated parking features
- Utilities: Public sewer; Utilities: see remarks
- Home design: Duplex; Appraiser-provided building area of 1,960
- Construction: Frame construction
- Exterior features: Frame construction; Not waterfront
Interior
- Basement: Full unfinished basement
- Bedrooms: One 1-bedroom unit; One 2-bedroom unit
- Bathrooms: Two full bathrooms
- Heating & cooling: No central cooling; Other heating
- Interior features: Other interior features
Neighborhood map
What this means for you Summary
Snapshot
- This is a 3-bed/2.0-bath multifamily listed at $944k.
Deal economics
- At list price, monthly cash flow is $1k ($18k/yr) — positive.
- The deal already cash-flows at list — no discount required.
- Meets the 1% rule at list price ($10k rent vs $944k).
- Cap rate 8.7% vs local median 2.6% in New York — top-decile yield for the area; either an underpriced asset or a hidden risk that comps aren't pricing in. Stress-test before assuming the spread holds.
Location & tenants
- Location reads 75/100 on livability (#268 in NY, #4,188 nationally) — a middle-class / working-renter tenant base. Strengths: amenities A+, commute A+, health & safety A; Watch: crime F, cost of living F.
- Market conditions: Rents rising fast (+7.0%/yr); 114 active listings in the ZIP; 1 comparable units currently listed for rent nearby; lower-income renter base — watch delinquency; 10,063 units permitted in Kings County in 2024 (9,789 in 5+ unit buildings).
- At $9,861/mo this rent would consume 271% of the median local household income ($44k/yr) (locally 4426% of renters already pay >50% of income on rent) — very limited rent-growth headroom before tenants either downsize or default.
Forward outlook
- In year one you build about $54k of equity ($7k loan paydown + $47k appreciation (5.0% local appreciation)).
- Kings County population projected at +13% by 2050 — modest demand growth; plan on rents tracking national, not racing it.
- At projected returns (5.0% appreciation + 7.0% rent growth), your $264k cash investment doubles in ~4 years — after that, you're playing with house money.
- By year 2, paydown + projected appreciation supports a ~$86k cash-out refi (75% LTV) — recoverable capital for the next deal without selling this one.
Negotiation context
- Only 14 days on market — expect competitive offers; lowballing is unlikely to land.
- Current owner paid $540k; list at $944k implies a 75% gain — meaningful room to come down on a strong offer.
Risks & watch-outs
- Watch-outs: flood insurance adds $427/mo; built in 1925 — expect roof / HVAC / electrical / plumbing capex.
- Climate carrying-cost: in FEMA flood zone AE (mandatory federal flood insurance); major wind risk, 69% chance of damaging wind over 30y; extreme-heat days projected 7→16/yr by 2055 (HVAC capex compounding) — expect insurance premiums to compound above CPI over the hold.
Questions for the listing agent
- Built in 1925 — when were the roof, HVAC, electrical panel, plumbing, and water heater last replaced?
- What's the actual annual flood-insurance premium (NFIP or private), and is the property in a SFHA with mandatory coverage?
- Is there a deadline driving the sale (1031 exchange, divorce, estate, relocation)? That informs how much negotiation room exists.
- Schools are B-rated — typically a magnet for longer-tenancy family renters. What's the average tenant stay here, and is there a school-zone premium baked into asking?
- Crime grade is F in this area — have there been break-ins, vandalism, or insurance claims at this property in the last 3 years? What carrier currently insures it and at what premium?
- What's the average days-on-market for RENTAL listings here right now (not sales)? A rising rental-DOM trend means longer vacancies and softer asking-rent achievability than the comps imply.
- What's the recent tenant-quality profile in this submarket — average credit score on applications, eviction rate, late-payment / NSF rate, and stable-employment percentage? A property-management company in the area should have these aggregated.
- How much new apartment / multifamily construction is in the pipeline within 1–3 miles? Heavy new supply (>2% of stock underway) typically softens rents 12–24 months out; light construction supports rent growth.
Investment metrics
- 1% rule
- 1.04% ✓
- Cap rate
- 8.74%
- Cash-on-cash
- 8.72%
- DSCR
- 1.39
- GRM
- 8.0
CMA / ARV
- ARV (on-the-fly)
- $911,400
- Comps found
- 1
Show comp detail 1 sale within ~0.75 mi
| Address | Dist | Beds/Ba | Sqft | Sold | Price | $/sf | Match |
|---|---|---|---|---|---|---|---|
| 3820 Cypress Ave | 0.14mi | 4/— (+1) | 1,840 (-6%) | 6mo | $855,000 | $465 | 73 |
Match score weights: distance 35% · size 25% · config 20% · recency 20%. Top-matched comps best support the ARV.
Projected returns pro-forma
4.98% appreciation · 7.03% rent growth · sell at horizon
- IRR
- 20.7%
- Equity multiple
- 2.34×
- Total profit
- $353,346
- Equity at exit
- $533,807
- IRR
- 22.2%
- Equity multiple
- 5.10×
- Total profit
- $1,082,543
- Equity at exit
- $920,427
Cash invested: $264,264 (down + closing). Projections, not guarantees.
Landlord ↔ Tenant lean methodology
- Overall (CITY)
- 0 Strongly Tenant-Friendly
- State New York
- 15 Strongly Tenant-Friendly · D+10
- County
- — inherits STATE
- City New York
- 0 Strongly Tenant-Friendly · D+34
ZIP-level market 11224
- Home prices YoY
- 1.0%
- Rents YoY
- 7.0%
- Active inventory
- 114
- Price-to-rent
- 16.0×
Monthly cashflow live
- Estimated rent
- $9,861 high interval (Pro) →
- Mortgage (P&I)
- −$4,949
- Tax from tax record
- −$527 /mo · $6,321/yr
- Insurance
- −$393
- Flood insurance flood zone
- −$427 /mo · $5,118/yr
- HOA
- −$0
- Vacancy / Maint / Mgmt
- −$2,071
- Net cashflow
- $1,494
Break-even live
2-unit breakdown (identical units grouped — click to expand)
| Units | Beds | Baths | Est. rent |
|---|---|---|---|
| 2× units | 3 | 1.5 | $9,862 |
| #1 | 3 | 1.5 | $4,931 |
| #2 | 3 | 1.5 | $4,931 |
| Total (2 units) | $9,861 | ||
UW: 25.0% down · 7.5% · 30yr · 1.5% tax · 5.0% vac · 8.0% maint · 8.0% mgmt
Financing live
Cash to close
- Down payment
- $235,950
- Closing costs
- $28,314
- Reserves months
- —
- Total cash needed
- —
Loan-product check · same deal, 3 products live
Conventional
25% down · 7.5% · 30yr
- Down + closing
- —
- Monthly P&I
- —
- Monthly cashflow
- —
- DSCR
- —
- Eligible?
- —
Personal DTI + credit; lowest rate.
DSCR
20% down · 8.5% · 30yr
- Down + closing
- —
- Monthly P&I
- —
- Monthly cashflow
- —
- DSCR
- —
- Eligible?
- —
No personal income docs; deal must DSCR.
Hard money
10% down · 12.0% · 12mo
- Down + closing
- —
- Monthly P&I
- —
- Monthly cashflow
- —
- DSCR
- —
- Eligible?
- —
Short-term bridge; refi at stabilization.
Rent comps 1 comps
| Address | Beds | Baths | Sqft | Rent | $/sqft | DOM | Units | Dist |
|---|---|---|---|---|---|---|---|---|
| 187 Bay 31st St #1 Brooklyn, NY | 3.0 | 3.0 | 1800 | $5,200 | $2.89 | 19d | 1 | 1.47mi |
Listing history 9 events
-
2026-06-18days on market $943,800 Active 14 DOM
-
2026-06-17days on market $943,800 Active 13 DOM
-
2026-06-16days on market $943,800 Active 12 DOM
-
2026-06-15days on market $943,800 Active 11 DOM
-
2026-06-13days on market $943,800 Active 9 DOM
-
2026-06-09days on market $943,800 Active 5 DOM
-
2026-06-08days on market $943,800 Active 4 DOM
-
2026-06-07remarks 624-char remark
-
2026-06-07$943,800 Active 3 DOM
ⓘ Source: listings_history table (triggers on properties + properties_extension) + one-shot
backfill from property_details.listing_events for pre-trigger history.
Tax reassessment forecast NY · Partial reset (capped growth)
- Current annual tax
- $6,321 · $527/mo
- Projected year-2 tax
- $11,136 · $928/mo
- Expected delta
- +$4,815/yr (+$401/mo · 76.2%)
ⓘ Screening estimate from a state-policy table — verify with the county assessor before closing.
Climate risk First Street
- Flood 8/10 Severe FEMA zone AE · 99% chance over 30 yrs
- Wildfire 1/10 Low
- Heat 7/10 Severe 7 d/yr ≥97°F today · 16 d/yr by 30 yrs out
- Wind 6/10 Major 69% chance of damaging wind over 30 yrs
- Air quality 4/10 Moderate 5 unhealthy d/yr today · 7 by 30 yrs out
Nearby sold comps map
Loading sold comps map…
Walkable amenities ~0.75 mi
Loading nearby amenities…
Taxation est. · year 1
- Rental income
- $118,332
- − Mortgage interest
- −$52,867
- − Property taxes
- −$6,321
- − Insurance
- −$9,838
- − Repairs & maintenance
- −$9,467
- − Management
- −$9,467
- − Depreciation
- −$27,456
- Taxable income
- $2,917
- Est. tax owed @ 24.0%
- −$700
- After-tax cash flow
- $17,231/yr
For passive investors: Depreciation is non-cash, so a rental often shows a tax loss while cash-flowing — sheltering income. Rental losses are passive: they offset passive income freely, and up to $25,000/yr can offset ordinary (W-2) income if you actively participate and your MAGI is under $100k (phasing out to $0 by $150k); unused losses carry forward. On sale, claimed depreciation is recaptured at up to 25%, and gains may owe capital-gains tax (a 1031 exchange can defer both). Figures are a year-1 estimate at your 24.0% rate — not tax advice; consult a CPA.
Schools (NCES district)
No district data.
Livability — New York
- Score
- 75/100
- State rank
- #268
- US rank
- #4188
Category grades
Schools grade is shown separately in the Schools card above.
Census & demographics
- Census place
- New York, NY
- County
- Kings County · 2,614,986 people
- City population
- 7,731,280
- Metro
- New York-Newark-Jersey City, NY-NJ-PA
- Population (ZIP)
- 50,822
- Household income
- $43,648
- Rent vs Own
- Severe rent burden
- 4426.0
Population outlook (Kings County) Hauer SSP2
- Today (2025)
- 2,847,441 people
- By 2030
- 2,937,006 · +3.1%
- By 2040
- 3,095,491 · +8.7%
- By 2050
- 3,228,968 · +13.4%
- By 2075
- 3,321,723 · +16.7%
- By 2100
- 3,111,387 · +9.3%
Race, ethnicity, and origin ACS 2023
- Neighborhood character
- Diverse neighborhood (Simpson 0.68)
- Race & ethnicity
- White 48% Black 22% Hispanic / Latino 19% Asian 8% Two or more races 7%
- Hispanic origin (detail)
- Mexican 5% Puerto Rican 8% Dominican 2%
- Common ancestry
- Scotch-Irish 10% Subsaharan African 7% Romanian 1%
- Foreign-born
- 48% · Canada, China
- Languages at home
- 42% English-only · Russian/Polish/Slavic 32% Spanish 11% Chinese 5%
Political lean MEDSL · Kings
- 2024 margin
- Solid D (+44.0) · D 72.0% · R 28.0%
- 2008→2024 swing
- -15.5pp toward R · 2008: 59.4pp · 2024: 44.0pp
- All cycles
- 2024: D+44.0 2020: D+54.8 2016: D+61.8 2012: D+63.9 2008: D+59.4
Not yet ingested
- Civics
- —
Market trends
- HPI YoY
- ▲ 4.98%
- Current HPI
- 505.1405
- Rent YoY
- ▲ 7.03%
- Metro
- New York-Newark-Jersey City, NY-NJ-PA
- State GDP YoY
- ▲ 2.60%
- F500 in state
- 92
Industry mix (Fortune 500 HQ in NY)
| Industry | F500 HQs | Revenue |
|---|---|---|
| Financial Services | 10 | $950B |
|
||
| Consumer Goods | 9 | $162B |
|
||
| Insurance | 4 | $225B |
|
||
| Telecommunications | 2 | $144B |
|
||
| Pharmaceuticals | 2 | $112B |
|
||
| Media / Entertainment | 2 | $69B |
|
||
Price history
+798.9% since first listed7 events — show timeline
- 2026-06-04 Listed $943,800 OneKey® MLS as Distributed by MLS Grid
- 2019-11-18 Price Changed $849,000 BNYMLS
- 2019-09-15 Price Changed $799,000 BNYMLS
- 2005-10-03 Sold (Public Records) $540,000 Public Records
- 2000-10-24 Sold (Public Records) $189,000 Public Records
- 1994-08-22 Sold (Public Records) $185,000 Public Records
- 1994-08-11 Sold (Public Records) $105,000 Public Records
Property tax history
+5.0%/yrLatest (2025): $6,321 · +2.7% YoY. Source: county tax records.
Cash-flow waterfall
monthlySold comps — $/sqft
last 12 mo · ≤1 miLoading sold comps…