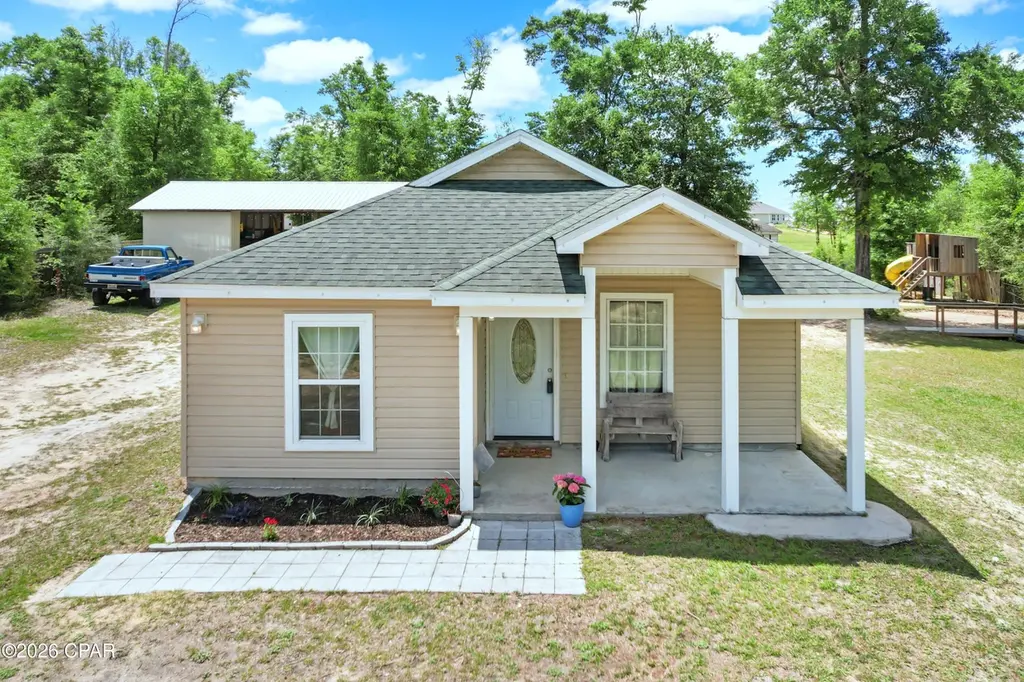
8106 Starling Rd · Panama City, FL
Flood risk 1/10 · Minimal
- FEMA flood zone
- X (unshaded)
- Chance of flooding over 30 yrs
- 0.0%
- Est. flood insurance / yr
- $507 – $1,088
Fire risk 7/10 · Major
- Est. fire insurance / yr
- $947 – $1,759
Heat risk 9/10 · Severe
- Hot days now (above 105°F)
- 7 days/yr
- Hot days in 30 yrs
- 21 days/yr
Wind risk 9/10 · Severe
- Chance of severe wind over 30 yrs
- 99.0%
Air-quality risk 2/10 · Minimal
- Unhealthy air days now
- 1 days/yr
- Unhealthy air days in 30 yrs
- 1 days/yr
Risk factors via First Street. Map © Google.
Why this score? — see what drove the D+ grade
The composite is a weighted blend of 9 inputs, each scored 0–100. Each bar is that input's sub-score; the figure is the points it added to the 100-point composite (weight × sub-score).
- Cash flow +10.7/30.0
- ARV discount +10.1/15.0
- Appreciation +10.0/10.0
- Schools +4.3/10.0
- Livability +3.6/5.0
- DSCR +3.1/10.0
- Rent growth +2.5/5.0
- Condition / age +2.5/5.0
- 1% rule +2.0/10.0
$279,900
🖨 Deal sheet 📄 Offer letter ✓ Due diligence
Listing remarks
HOUSE + ACRE PARCEL + POND + POLE BARN!! This 4 bedroom, 2 bath home sits on an acre of land with a fishing pond and a 24x36 pole barn. Inside, you will find an open floorplan with vinyl plank flooring in the main living areas, carpet in the bedrooms, and tile flooring in the bathrooms. The kitchen features ample counter space, a breakfast bar, a pantry, stainless steel appliances, and it opens to the dining area which flows into the living room. The vaulted ceiling gives the home an open feel and the decorative shelf along the top wall is ready for your personal decor. The interior laundry room is conveniently located between the bedrooms, and there is an 11x8 pantry/utility room for adde
Key facts
- Pole barn
- Fishing pond
- Open floorplan
Tags
Property features AI
Finance
- HOA & community: Short-term rentals allowed
Exterior
- Utilities: Electricity available
- Home design: Single-story property; Entry level: First floor
- Construction: Vinyl siding; Shingle/composition roof; Slab foundation; Mobile dimensions measured in feet
- Exterior features: Patio; Covered patio/porch; Porch; Partial fencing; Dirt road access
Interior
- Kitchen: Electric oven; Electric range
- Bedrooms: Three bedrooms (all on the first floor)
- Bathrooms: Two full bathrooms
- Heating & cooling: Central heating (electric); Central air; Ceiling fans
- Interior features: Double-pane windows; Utility room
- Laundry & utility: First-floor laundry room; Electric water heater
Neighborhood map
What this means for you Summary
Snapshot
- This is a 3-bed/2.0-bath single-family listed at $280k.
Deal economics
- At list price, monthly cash flow is $-134 ($-2k/yr) — negative.
- To cash-flow at today's rent, offer at most $256k (8.5% below list).
- To meet the 1% rule (rent ≥ 1% of price), the offer needs to be $196k (29.9% below list).
- Recommended offer: $196k (29.9% below list) — sets the bar for 1% rule.
- Cap rate 5.7% vs local median 4.7% in Panama City — meaningfully above typical; check what's discounted (condition, days-on-market, listing class) to confirm the premium yield is real.
Location & tenants
- Location reads 72/100 on livability (#350 in FL) — a middle-class / working-renter tenant base. Strengths: cost of living A+, housing A+, health & safety A+; Watch: crime F, amenities F, commute F.
- Bay (suburban): math 51% / reading 51% proficiency, ranked #29 of 73 in FL (top 40%) — acceptable for families but not a draw, mixed tenant base, ~2y average lease.
- Market conditions: 112 active listings in the ZIP; 2,473 units permitted in Bay County in 2024 (559 in 5+ unit buildings).
Forward outlook
- In year one you build about $30k of equity ($2k loan paydown + $28k appreciation (10.0% local appreciation)).
- Bay County population projected at +24% by 2050 — long-run rental-demand tailwind backs the buy-and-hold thesis.
- By year 2, paydown + projected appreciation supports a ~$48k cash-out refi (75% LTV) — recoverable capital for the next deal without selling this one.
Negotiation context
- Only 14 days on market — expect competitive offers; lowballing is unlikely to land.
- 2 sale attempts since 13y ago with the ask held roughly flat each time — persistent listings suggest the price (not the market) is what's stuck; bring a comps-based counter.
- Current owner paid $65k; list at $280k implies a 331% gain — meaningful room to come down on a strong offer.
Risks & watch-outs
- Climate carrying-cost: severe wind risk, 99% chance of damaging wind over 30y; major wildfire risk; extreme-heat days projected 7→21/yr by 2055 (HVAC capex compounding) — expect insurance premiums to compound above CPI over the hold.
Questions for the listing agent
- What do current leases actually rent for vs. the listed asking? Can we see a recent rent roll and the last 12 months of T-12 income?
- Is there a deadline driving the sale (1031 exchange, divorce, estate, relocation)? That informs how much negotiation room exists.
- Schools are B-rated — typically a magnet for longer-tenancy family renters. What's the average tenant stay here, and is there a school-zone premium baked into asking?
- Crime grade is F in this area — have there been break-ins, vandalism, or insurance claims at this property in the last 3 years? What carrier currently insures it and at what premium?
- The area grade is low — what's the realistic commute time and amenity access for the typical tenant pool here? Any planned neighborhood developments (good or bad) we should know about?
- What's the average days-on-market for RENTAL listings here right now (not sales)? A rising rental-DOM trend means longer vacancies and softer asking-rent achievability than the comps imply.
- What's the recent tenant-quality profile in this submarket — average credit score on applications, eviction rate, late-payment / NSF rate, and stable-employment percentage? A property-management company in the area should have these aggregated.
- How much new for-sale + rental construction is in the pipeline within 1–3 miles? Heavy new supply typically softens prices + rents 12–24 months out; constrained supply supports both.
Investment metrics
- 1% rule
- 0.70% ✗
- Cap rate
- 5.72%
- Cash-on-cash
- -2.05%
- DSCR
- 0.91
- GRM
- 11.9
CMA / ARV
- ARV (median comp)
- $297,126
- List price
- $279,900
- Delta
- -5.80%
- Verdict
- FAIR
- Comps
- 20 within 1.0 mi
Show comp detail 12 sales within ~0.75 mi
| Address | Dist | Beds/Ba | Sqft | Sold | Price | $/sf | Match |
|---|---|---|---|---|---|---|---|
| 8029 Greyling Cir | 0.08mi | 4/2.0 (+1) | 1,684 (+7%) | 9mo | $302,990 | $180 | 72 |
| 8110 Greyling Cir | 0.11mi | 3/2.0 | 1,431 (-9%) | 11mo | $277,990 | $194 | 71 |
| 8022 Greyling Cir | 0.18mi | 4/2.0 (+1) | 1,684 (+7%) | 10mo | $294,990 | $175 | 67 |
| 8008 Greyling Cir | 0.21mi | 4/2.0 (+1) | 1,684 (+7%) | 12mo | $298,000 | $177 | 64 |
| 8103 Greyling Cir | 0.08mi | 4/2.0 (+1) | 1,773 (+13%) | 9mo | $303,990 | $171 | 63 |
| 7942 Greyling Cir | 0.23mi | 4/2.0 (+1) | 1,684 (+7%) | 12mo | $295,990 | $176 | 62 |
| 8838 Hornbill Dr | 0.21mi | 3/2.0 | 1,416 (-10%) | 14mo | $275,990 | $195 | 62 |
| 7912 Campflowers Rd | 0.27mi | 3/2.0 | 1,344 (-14%) | 1mo | $255,000 | $190 | 62 |
| 7941 Greyling Cir | 0.24mi | 3/2.0 | 1,416 (-10%) | 13mo | $271,990 | $192 | 61 |
| 8021 Greyling Cir | 0.15mi | 4/2.0 (+1) | 1,773 (+13%) | 11mo | $304,500 | $172 | 58 |
| 8012 Greyling Cir | 0.19mi | 4/2.0 (+1) | 1,773 (+13%) | 12mo | $302,990 | $171 | 55 |
| 8003 Greyling Cir | 0.22mi | 4/2.0 (+1) | 1,773 (+13%) | 13mo | $304,990 | $172 | 53 |
Match score weights: distance 35% · size 25% · config 20% · recency 20%. Top-matched comps best support the ARV.
Projected returns pro-forma
10.0% appreciation · 3.0% rent growth · sell at horizon
- IRR
- 22.8%
- Equity multiple
- 2.83×
- Total profit
- $143,787
- Equity at exit
- $252,156
- IRR
- 20.4%
- Equity multiple
- 6.49×
- Total profit
- $429,890
- Equity at exit
- $543,784
Cash invested: $78,372 (down + closing). Projections, not guarantees.
Landlord ↔ Tenant lean methodology
- Overall (STATE)
- 87 Strongly Landlord-Friendly
- State Florida
- 87 Strongly Landlord-Friendly · R+3
- County
- — inherits STATE
- City
- — inherits STATE
ZIP-level market 32466
- Home prices YoY
- 4.4%
- Active inventory
- 112
- Price-to-rent
- 11.9×
Monthly cashflow live
- Estimated rent
- $1,962 medium interval (Pro) →
- Mortgage (P&I)
- −$1,468
- Tax from tax record
- −$100 /mo · $1,196/yr
- Insurance
- −$117
- HOA
- −$0
- Vacancy / Maint / Mgmt
- −$412
- Net cashflow
- $-134
Break-even live
UW: 25.0% down · 7.5% · 30yr · 1.5% tax · 5.0% vac · 8.0% maint · 8.0% mgmt
Financing live
Cash to close
- Down payment
- $69,975
- Closing costs
- $8,397
- Reserves months
- —
- Total cash needed
- —
Loan-product check · same deal, 3 products live
Conventional
25% down · 7.5% · 30yr
- Down + closing
- —
- Monthly P&I
- —
- Monthly cashflow
- —
- DSCR
- —
- Eligible?
- —
Personal DTI + credit; lowest rate.
DSCR
20% down · 8.5% · 30yr
- Down + closing
- —
- Monthly P&I
- —
- Monthly cashflow
- —
- DSCR
- —
- Eligible?
- —
No personal income docs; deal must DSCR.
Hard money
10% down · 12.0% · 12mo
- Down + closing
- —
- Monthly P&I
- —
- Monthly cashflow
- —
- DSCR
- —
- Eligible?
- —
Short-term bridge; refi at stabilization.
Listing history 4 events
-
2026-05-14$279,900 Active 1555-char remark
-
2021-12-14historical
-
2013-01-05$130,000
-
2005-08-19soldstatus $65,000
ⓘ Source: listings_history table (triggers on properties + properties_extension) + one-shot
backfill from property_details.listing_events for pre-trigger history.
Tax reassessment forecast FL · Resets to sale price
- Current annual tax
- $1,196 · $100/mo
- Projected year-2 tax
- $2,323 · $194/mo
- Expected delta
- +$1,127/yr (+$94/mo · 94.2%)
ⓘ Screening estimate from a state-policy table — verify with the county assessor before closing.
Climate risk First Street
- Flood 1/10 Low FEMA zone X (unshaded) · 0% chance over 30 yrs
- Wildfire 7/10 Severe
- Heat 9/10 Extreme 7 d/yr ≥105°F today · 21 d/yr by 30 yrs out
- Wind 9/10 Extreme 99% chance of damaging wind over 30 yrs
- Air quality 2/10 Low 1 unhealthy d/yr today · 1 by 30 yrs out
Nearby sold comps map
Loading sold comps map…
Walkable amenities ~0.75 mi
Loading nearby amenities…
Taxation est. · year 1
- Rental income
- $23,548
- − Mortgage interest
- −$15,679
- − Property taxes
- −$1,196
- − Insurance
- −$1,400
- − Repairs & maintenance
- −$1,884
- − Management
- −$1,884
- − Depreciation
- −$8,143
- Taxable loss
- −$6,637
- Est. tax savings @ 24.0%
- +$1,593
- After-tax cash flow
- $-14/yr
For passive investors: Depreciation is non-cash, so a rental often shows a tax loss while cash-flowing — sheltering income. Rental losses are passive: they offset passive income freely, and up to $25,000/yr can offset ordinary (W-2) income if you actively participate and your MAGI is under $100k (phasing out to $0 by $150k); unused losses carry forward. On sale, claimed depreciation is recaptured at up to 25%, and gains may owe capital-gains tax (a 1031 exchange can defer both). Figures are a year-1 estimate at your 24.0% rate — not tax advice; consult a CPA.
Schools (NCES district)
- District
- Bay
- NCES district ID
- 1200090
- Math proficiency
- 51% ▼ -8.00%
- Reading proficiency
- 51% ▼ -7.00%
- Median HH income
- $47,740
- Composite
- 43.41/100
- National rank
- #3014
- State rank
- #29 of 73 in FL
Livability — Panama City
- Score
- 72/100
- State rank
- #350
- US rank
- #5823
Category grades
Schools grade is shown separately in the Schools card above.
Census & demographics
- City population
- 91,445
- Population (ZIP)
- 5,837
Population outlook (Bay County) Hauer SSP2
- Today (2025)
- 206,264 people
- By 2030
- 217,740 · +5.6%
- By 2040
- 238,738 · +15.7%
- By 2050
- 255,545 · +23.9%
- By 2075
- 288,295 · +39.8%
- By 2100
- 288,638 · +39.9%
Race, ethnicity, and origin ACS 2023
- Neighborhood character
- Predominantly White (89%)
- Race & ethnicity
- White 89% Two or more races 7% Black 3% Hispanic / Latino 2%
- Common ancestry
- Lithuanian 4% Portuguese 3% Serbian 2%
- Foreign-born
- 2% · Canada
Political lean MEDSL · Bay
- 2024 margin
- Solid R (+47.4) · D 25.8% · R 73.1% · Other 1.1%
- 2008→2024 swing
- -6.6pp toward R · 2008: -40.7pp · 2024: -47.4pp
- All cycles
- 2024: R+47.4 2020: R+43.5 2016: R+46.3 2012: R+43.6 2008: R+40.7
Not yet ingested
- Civics
- —
Market trends
- HPI YoY
- ▲ 11.68%
- Current HPI
- 274.7988
- Rent YoY
- —
- Metro
- —
- State GDP YoY
- ▲ 3.28%
- F500 in state
- 36
Industry mix (Fortune 500 HQ in FL)
| Industry | F500 HQs | Revenue |
|---|---|---|
| Industrial Technology | 2 | $29B |
|
||
| Insurance | 2 | $17B |
|
||
| Retail | 1 | $60B |
|
||
| Technology Distribution | 1 | $58B |
|
||
| Homebuilding | 1 | $35B |
|
||
| Technology Manufacturing | 1 | $35B |
|
||
Price history
+330.6% since first listed5 events — show timeline
- 2026-05-29 Pending — CPARMLS
- 2026-05-14 Listed $279,900 CPARMLS
- 2021-12-14 Listing Removed — CPARMLS
- 2013-01-05 Listed $130,000 CPARMLS
- 2005-08-19 Sold (Public Records) $65,000 Public Records
Property tax history
+1.2%/yrLatest (2025): $1,196 · +3.8% YoY. Source: county tax records.
Cash-flow waterfall
monthlySold comps — $/sqft
last 12 mo · ≤1 miLoading sold comps…