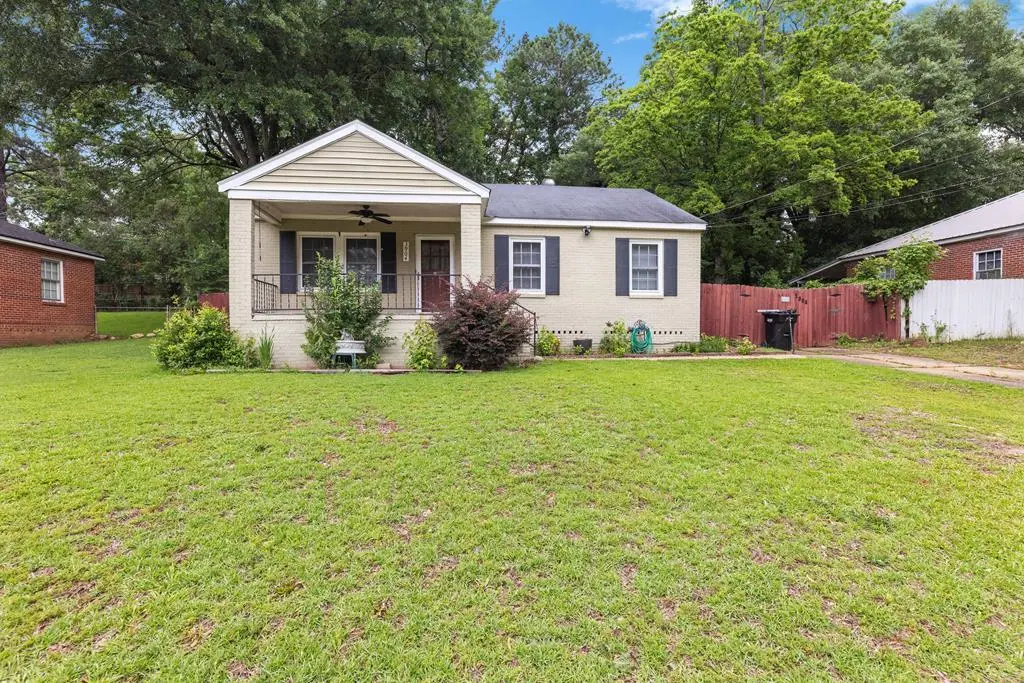
3904 Calvin Dr · Columbus, GA
Flood risk 1/10 · Minimal
- FEMA flood zone
- X (unshaded)
- Chance of flooding over 30 yrs
- 0.0%
- Est. flood insurance / yr
- $507 – $1,088
Fire risk 1/10 · Minimal
- Est. fire insurance / yr
- $963 – $1,789
Heat risk 7/10 · Major
- Hot days now (above 107°F)
- 7 days/yr
- Hot days in 30 yrs
- 19 days/yr
Wind risk 6/10 · Moderate
- Chance of severe wind over 30 yrs
- 76.0%
Air-quality risk 5/10 · Moderate
- Unhealthy air days now
- 7 days/yr
- Unhealthy air days in 30 yrs
- 8 days/yr
Risk factors via First Street. Map © Google.
Why this score? — see what drove the B+ grade
The composite is a weighted blend of 9 inputs, each scored 0–100. Each bar is that input's sub-score; the figure is the points it added to the 100-point composite (weight × sub-score).
- Cash flow +30.0/30.0
- ARV discount +15.0/15.0
- DSCR +10.0/10.0
- 1% rule +9.5/10.0
- Rent growth +3.3/5.0
- Livability +3.2/5.0
- Condition / age +2.5/5.0
- Schools +2.2/10.0
- Appreciation +0.0/10.0
$79,900
🖨 Deal sheet 📄 Offer letter ✓ Due diligence
Listing remarks
Great investment opportunity! This charming 2-bedroom, 1-bath brick home features hardwood floors, a separate living room and dining room, and a covered front porch. The fenced backyard offers added privacy and space for outdoor enjoyment. Whether you're looking to expand your investment portfolio or searching for an affordable home with character, this property has excellent potential.
Key facts
- Covered front porch
- Separate living room
- Fenced backyard
Tags
Property features AI
Exterior
- Utilities: Public water; Public sewer
- Home design: Single family residence; One story
- Construction: Brick construction; Crawl space basement
- Exterior features: Fenced yard; Level lot
Interior
- Kitchen: Dishwasher; Electric range
- Flooring: Hardwood
- Bathrooms: 1 full bathroom
- Interior features: Dishwasher; Electric range
Neighborhood map
What this means for you Summary
Snapshot
- This is a 2-bed/1.0-bath single-family listed at $80k.
Deal economics
- At list price, monthly cash flow is $343 ($4k/yr) — positive.
- The deal already cash-flows at list — no discount required.
- Meets the 1% rule at list price ($1k rent vs $80k).
- Cap rate 11.4% vs local median 4.7% in Columbus — top-decile yield for the area; either an underpriced asset or a hidden risk that comps aren't pricing in. Stress-test before assuming the spread holds.
Location & tenants
- Location reads 64/100 on livability (#254 in GA) — a middle-class / working-renter tenant base. Strengths: cost of living A+, housing A+, health & safety B; Watch: amenities D+, schools F, crime F.
- Muscogee County (urban): math 21% / reading 30% proficiency, ranked #120 of 174 in GA (top 69%) — low school quality limits family demand, transient renter base, plan for 1-2y turnover; 61% free/reduced lunch — lower-income household profile, screen leases tightly.
- Market conditions: Rents rising (+3.0%/yr); 327 active listings in the ZIP; 31 comparable units currently listed for rent nearby; rentals lingering (median 44d on market — plan ~5-8 weeks vacancy on turnover, expect pricing pressure); 55% of comp listings sitting > 30 days — soft ceiling on asking rent; 291 units permitted in Muscogee County in 2024 (30 in 5+ unit buildings).
Forward outlook
- Local home prices are declining (-3.0%/yr); year-one equity from $552 of loan paydown is wiped out by about $2k of value loss. Plan a longer hold.
- Muscogee County population projected at +15% by 2050 — modest demand growth; plan on rents tracking national, not racing it.
- At projected returns (-3.0% appreciation + 3.0% rent growth), your $22k cash investment doubles in ~7 years — after that, you're playing with house money.
Negotiation context
- Only 3 days on market — expect competitive offers; lowballing is unlikely to land.
Risks & watch-outs
- Watch-outs: built in 1951 — expect roof / HVAC / electrical / plumbing capex.
- Climate carrying-cost: major wind risk, 76% chance of damaging wind over 30y; extreme-heat days projected 7→19/yr by 2055 (HVAC capex compounding) — expect insurance premiums to compound above CPI over the hold.
Questions for the listing agent
- Built in 1951 — when were the roof, HVAC, electrical panel, plumbing, and water heater last replaced?
- Is there a deadline driving the sale (1031 exchange, divorce, estate, relocation)? That informs how much negotiation room exists.
- Schools are F-rated, which usually means shorter tenancies and higher turnover. Who's the typical renter profile here, and what's been the actual vacancy rate?
- Crime grade is F in this area — have there been break-ins, vandalism, or insurance claims at this property in the last 3 years? What carrier currently insures it and at what premium?
- What's the average days-on-market for RENTAL listings here right now (not sales)? A rising rental-DOM trend means longer vacancies and softer asking-rent achievability than the comps imply.
- What's the recent tenant-quality profile in this submarket — average credit score on applications, eviction rate, late-payment / NSF rate, and stable-employment percentage? A property-management company in the area should have these aggregated.
- How much new for-sale + rental construction is in the pipeline within 1–3 miles? Heavy new supply typically softens prices + rents 12–24 months out; constrained supply supports both.
Investment metrics
- 1% rule
- 1.45% ✓
- Cap rate
- 11.44%
- Cash-on-cash
- 18.37%
- DSCR
- 1.82
- GRM
- 5.7
CMA / ARV
- ARV (on-the-fly)
- $123,424
- Comps found
- 12
Show comp detail 12 sales within ~0.75 mi
| Address | Dist | Beds/Ba | Sqft | Sold | Price | $/sf | Match |
|---|---|---|---|---|---|---|---|
| 1812 42nd St | 0.17mi | 3/1.0 (+1) | 1,107 (+4%) | 0mo | $130,000 | $117 | 80 |
| 2103 Terrace Dr | 0.14mi | 2/1.0 | 983 (-8%) | 5mo | $100,000 | $102 | 77 |
| 4213 17th Ave | 0.29mi | 2/1.0 | 980 (-8%) | 8mo | $75,000 | $77 | 67 |
| 3818 Howard Ave | 0.44mi | 2/1.0 | 1,022 (-4%) | 8mo | $118,000 | $115 | 66 |
| 4717 16th Ave | 0.66mi | 3/1.0 (+1) | 1,064 (0%) | 6mo | $78,000 | $73 | 60 |
| 2365 Gurley Dr | 0.49mi | 3/2.0 (+1) | 1,092 (+3%) | 6mo | $155,800 | $143 | 59 |
| 4714 18th Ave | 0.61mi | 3/1.0 (+1) | 1,040 (-2%) | 5mo | $114,000 | $110 | 59 |
| 3604 23rd Ave | 0.37mi | 3/1.0 (+1) | 1,182 (+11%) | 6mo | $172,500 | $146 | 55 |
| 2000 Elgin Dr | 0.47mi | 2/1.0 | 952 (-10%) | 9mo | $110,000 | $116 | 53 |
| 2369 Gurley Dr | 0.50mi | 3/2.0 (+1) | 1,159 (+9%) | 3mo | $169,900 | $147 | 50 |
| 4803 19th Ave | 0.63mi | 3/1.5 (+1) | 975 (-8%) | 8mo | $130,000 | $133 | 43 |
| 4222 Chalfonte Dr | 0.60mi | 3/2.0 (+1) | 1,221 (+15%) | 8mo | $130,000 | $106 | 32 |
Match score weights: distance 35% · size 25% · config 20% · recency 20%. Top-matched comps best support the ARV.
Projected returns pro-forma
-3.0% appreciation · 3.04% rent growth · sell at horizon
- IRR
- 10.1%
- Equity multiple
- 1.40×
- Total profit
- $8,947
- Equity at exit
- $11,913
- IRR
- 19.3%
- Equity multiple
- 2.62×
- Total profit
- $36,200
- Equity at exit
- $6,908
Cash invested: $22,372 (down + closing). Projections, not guarantees.
Landlord ↔ Tenant lean methodology
- Overall (STATE)
- 90 Strongly Landlord-Friendly
- State Georgia
- 90 Strongly Landlord-Friendly · R+3
- County
- — inherits STATE
- City
- — inherits STATE
ZIP-level market 31904
- Rents YoY
- 3.0%
- Active inventory
- 327
- Price-to-rent
- 5.7×
Monthly cashflow live
- Estimated rent
- $1,161 high interval (Pro) →
- Mortgage (P&I)
- −$419
- Tax from tax record
- −$122 /mo · $1,465/yr
- Insurance
- −$33
- HOA
- −$0
- Vacancy / Maint / Mgmt
- −$244
- Net cashflow
- $343
Break-even live
UW: 25.0% down · 7.5% · 30yr · 1.5% tax · 5.0% vac · 8.0% maint · 8.0% mgmt
Financing live
Cash to close
- Down payment
- $19,975
- Closing costs
- $2,397
- Reserves months
- —
- Total cash needed
- —
Loan-product check · same deal, 3 products live
Conventional
25% down · 7.5% · 30yr
- Down + closing
- —
- Monthly P&I
- —
- Monthly cashflow
- —
- DSCR
- —
- Eligible?
- —
Personal DTI + credit; lowest rate.
DSCR
20% down · 8.5% · 30yr
- Down + closing
- —
- Monthly P&I
- —
- Monthly cashflow
- —
- DSCR
- —
- Eligible?
- —
No personal income docs; deal must DSCR.
Hard money
10% down · 12.0% · 12mo
- Down + closing
- —
- Monthly P&I
- —
- Monthly cashflow
- —
- DSCR
- —
- Eligible?
- —
Short-term bridge; refi at stabilization.
Rent comps 31 comps
| Address | Beds | Baths | Sqft | Rent | $/sqft | DOM | Units | Dist |
|---|---|---|---|---|---|---|---|---|
| 3909 Crestview Dr Columbus, GA | 3.0 | 1.0 | 1110 | $1,250 | $1.13 | 13d | 1 | 0.04mi |
| 4207 17th Ave Columbus, GA | 3.0 | 1.0 | 1006 | $1,350 | $1.34 | 43d | 1 | 0.26mi |
| 4025 Acacia Dr Columbus, GA | 3.0 | 1.0 | 1186 | $1,250 | $1.05 | 21d | 1 | 0.30mi |
| 3519 Woodlawn Ave Columbus, GA | 3.0 | 1.0 | 1028 | $1,350 | $1.31 | 13d | 1 | 0.41mi |
| 3822 Howard Ave Unit A Columbus, GA | 2.0 | 1.0 | 1241 | $1,150 | $0.93 | 43d | 1 | 0.42mi |
| 4308 Saint Francis Ave Unit 4310 Columbus, GA | 2.0 | 1.0 | 1000 | $1,125 | $1.12 | 21d | 1 | 0.48mi |
| 2005 Cherokee Dr Columbus, GA | 2.0 | 1.0 | 891 | $925 | $1.04 | 43d | 1 | 0.54mi |
| 4705 20th Ave Apt 2 Columbus, GA | 2.0 | 1.5 | 1127 | $1,100 | $0.98 | 13d | 1 | 0.57mi |
| 3011 18th Ave Apt F Columbus, GA | 2.0 | 1.0 | 750 | $700 | $0.93 | 43d | 1 | 0.70mi |
| 4022 Young Ave Columbus, GA | 3.0 | 1.5 | 1300 | $1,100 | $0.85 | 43d | 1 | 0.72mi |
| 3711 Armour Ave Apt 21 Columbus, GA | 2.0 | 1.0 | 1200 | $1,057 | $0.88 | 43d | 1 | 0.73mi |
| 3821 Armour Ave Columbus, GA | 2.0 | 2.0 | 1200 | $1,100 | $0.92 | 43d | 1 | 0.74mi |
| 1410 Talbotton Rd Columbus, GA | 2.0 | 1.0 | 800 | $675 | $0.84 | 43d | 3 | 0.81mi |
| 1121 47th St Columbus, GA | 2.0 | 1.0 | 800 | $950 | $1.19 | 43d | 1 | 0.84mi |
| 2922 Howard Ave Unit 3 Columbus, GA | 2.0 | 2.0 | 1100 | $795 | $0.72 | 43d | 1 | 0.87mi |
| 2840 Warm Springs Rd Columbus, GA | 1.0–2.0 | 1.0–2.0 | 1196 | $1,500 | $1.25 | 13d | 8 | 0.87mi |
| 1510 28th St Columbus, GA | 3.0 | 2.0 | 1050 | $800 | $0.76 | 43d | 1 | 0.90mi |
| 2601 Cherokee Ave Unit 2 Columbus, GA | 1.0 | 1.0 | 750 | $750 | $1.00 | 43d | 1 | 0.97mi |
| 5000 Armour Rd Columbus, GA | 1.0 | 1.0 | 747 | $800 | $1.07 | 43d | 1 | 1.02mi |
| 635 42nd St Columbus, GA | 2.0 | 1.0 | 1008 | $750 | $0.74 | 21d | 1 | 1.13mi |
| 4226 Oates Ave Columbus, GA | 3.0 | 1.5 | 960 | $1,100 | $1.15 | 21d | 1 | 1.18mi |
| 1344 24th St Columbus, GA | 2.0 | 1.0 | 750 | $775 | $1.03 | 21d | 1 | 1.18mi |
| 2807 Beacon Ave Unit B Columbus, GA | 2.0 | 2.5 | 1015 | $1,350 | $1.33 | 43d | 1 | 1.20mi |
| 2807 Beacon Ave Unit A Columbus, GA | 2.0 | 2.0 | 1014 | $1,250 | $1.23 | 43d | 1 | 1.20mi |
| 615 32nd St Columbus, GA | 3.0 | 1.0 | 984 | $900 | $0.91 | 13d | 1 | 1.28mi |
| 521 46th St Columbus, GA | 2.0 | 1.0 | 954 | $975 | $1.02 | 43d | 1 | 1.33mi |
| 707 28th St Columbus, GA | 3.0 | 1.0 | 1384 | $1,000 | $0.72 | 13d | 1 | 1.39mi |
| 403 46th St Columbus, GA | 3.0 | 2.0 | 1410 | $1,550 | $1.10 | 21d | 1 | 1.44mi |
| 1815 17th Ave Apt 7 Columbus, GA | 2.0 | 1.0 | 937 | $1,040 | $1.11 | 43d | 1 | 1.46mi |
| 4001 3rd Ave Unit A or B Columbus, GA | 1.0 | 1.0 | 800 | $750 | $0.94 | 13d | 1 | 1.47mi |
| 3414 3rd Ave Columbus, GA | 1.0 | 1.0 | 810 | $850 | $1.05 | 21d | 1 | 1.48mi |
Listing history 4 events
-
2026-06-09status $79,900 Pending 3 DOM
-
2026-06-08days on market $79,900 Active 3 DOM
-
2026-06-07remarks 389-char remark
-
2026-06-07$79,900 Active 2 DOM
ⓘ Source: listings_history table (triggers on properties + properties_extension) + one-shot
backfill from property_details.listing_events for pre-trigger history.
Tax reassessment forecast GA · Resets to sale price
- Current annual tax
- $1,465 · $122/mo
- Projected year-2 tax
- $1,465 · $122/mo
- Expected delta
- $0/yr ($0/mo · 0.0%)
ⓘ Screening estimate from a state-policy table — verify with the county assessor before closing.
Climate risk First Street
- Flood 1/10 Low FEMA zone X (unshaded) · 0% chance over 30 yrs
- Wildfire 1/10 Low
- Heat 7/10 Severe 7 d/yr ≥107°F today · 19 d/yr by 30 yrs out
- Wind 6/10 Major 76% chance of damaging wind over 30 yrs
- Air quality 5/10 Major 7 unhealthy d/yr today · 8 by 30 yrs out
Nearby sold comps map
Loading sold comps map…
Walkable amenities ~0.75 mi
Loading nearby amenities…
Taxation est. · year 1
- Rental income
- $13,928
- − Mortgage interest
- −$4,476
- − Property taxes
- −$1,465
- − Insurance
- −$400
- − Repairs & maintenance
- −$1,114
- − Management
- −$1,114
- − Depreciation
- −$2,324
- Taxable income
- $3,035
- Est. tax owed @ 24.0%
- −$728
- After-tax cash flow
- $3,382/yr
For passive investors: Depreciation is non-cash, so a rental often shows a tax loss while cash-flowing — sheltering income. Rental losses are passive: they offset passive income freely, and up to $25,000/yr can offset ordinary (W-2) income if you actively participate and your MAGI is under $100k (phasing out to $0 by $150k); unused losses carry forward. On sale, claimed depreciation is recaptured at up to 25%, and gains may owe capital-gains tax (a 1031 exchange can defer both). Figures are a year-1 estimate at your 24.0% rate — not tax advice; consult a CPA.
Schools (NCES district)
- District
- Muscogee County
- NCES district ID
- 1303870
- Math proficiency
- 21% ▼ -11.00%
- Reading proficiency
- 30% ▼ -7.00%
- Median HH income
- $41,176
- Composite
- 21.6/100
- National rank
- #8297
- State rank
- #120 of 174 in GA
Livability — Columbus
- Score
- 64/100
- State rank
- #254
- US rank
- #14102
Category grades
Schools grade is shown separately in the Schools card above.
Census & demographics
- Census place
- Columbus, GA
- County
- Muscogee County · 180,764 people
- City population
- 180,764
- Metro
- Columbus, GA-AL
- Population (ZIP)
- 35,405
- Household income
- $66,291
- Rent vs Own
- Severe rent burden
- 2030.0
Population outlook (Muscogee County) Hauer SSP2
- Today (2025)
- 216,729 people
- By 2030
- 224,504 · +3.6%
- By 2040
- 238,318 · +10.0%
- By 2050
- 249,027 · +14.9%
- By 2075
- 264,862 · +22.2%
- By 2100
- 254,786 · +17.6%
Race, ethnicity, and origin ACS 2023
- Neighborhood character
- Diverse neighborhood (Simpson 0.60)
- Race & ethnicity
- White 56% Black 28% Two or more races 8% Hispanic / Latino 7% Asian 2%
- Hispanic origin (detail)
- Mexican 3% Puerto Rican 1%
- Common ancestry
- Slovak 1% Italian 1% Romanian 1%
- Foreign-born
- 5% · Canada, South Korea
- Languages at home
- 93% English-only · Spanish 4% Korean 1% German/W. Germanic 1%
Political lean MEDSL · Muscogee
- 2024 margin
- Strong D (+23.4) · D 61.4% · R 38.0%
- 2008→2024 swing
- +3.7pp toward D · 2008: 19.7pp · 2024: 23.4pp
- All cycles
- 2024: D+23.4 2020: D+24.0 2016: D+18.6 2012: D+21.3 2008: D+19.7
Not yet ingested
- Civics
- —
Market trends
- HPI YoY
- ▼ -152.06%
- Current HPI
- 155.1405
- Rent YoY
- ▲ 3.04%
- Metro
- Columbus, GA-AL
- State GDP YoY
- ▲ 2.66%
- F500 in state
- 28
Industry mix (Fortune 500 HQ in GA)
| Industry | F500 HQs | Revenue |
|---|---|---|
| Paper / Packaging | 2 | $29B |
|
||
| Retail | 1 | $160B |
|
||
| Transportation / Logistics | 1 | $91B |
|
||
| Airlines | 1 | $62B |
|
||
| Consumer Goods | 1 | $47B |
|
||
| Utilities | 1 | $25B |
|
||
Price history
1 event — show timeline
- 2026-06-05 Listed $79,900 CBOR
Property tax history
+4.7%/yrLatest (2025): $1,465 · +1.0% YoY. Source: county tax records.
Cash-flow waterfall
monthlySold comps — $/sqft
last 12 mo · ≤1 miLoading sold comps…