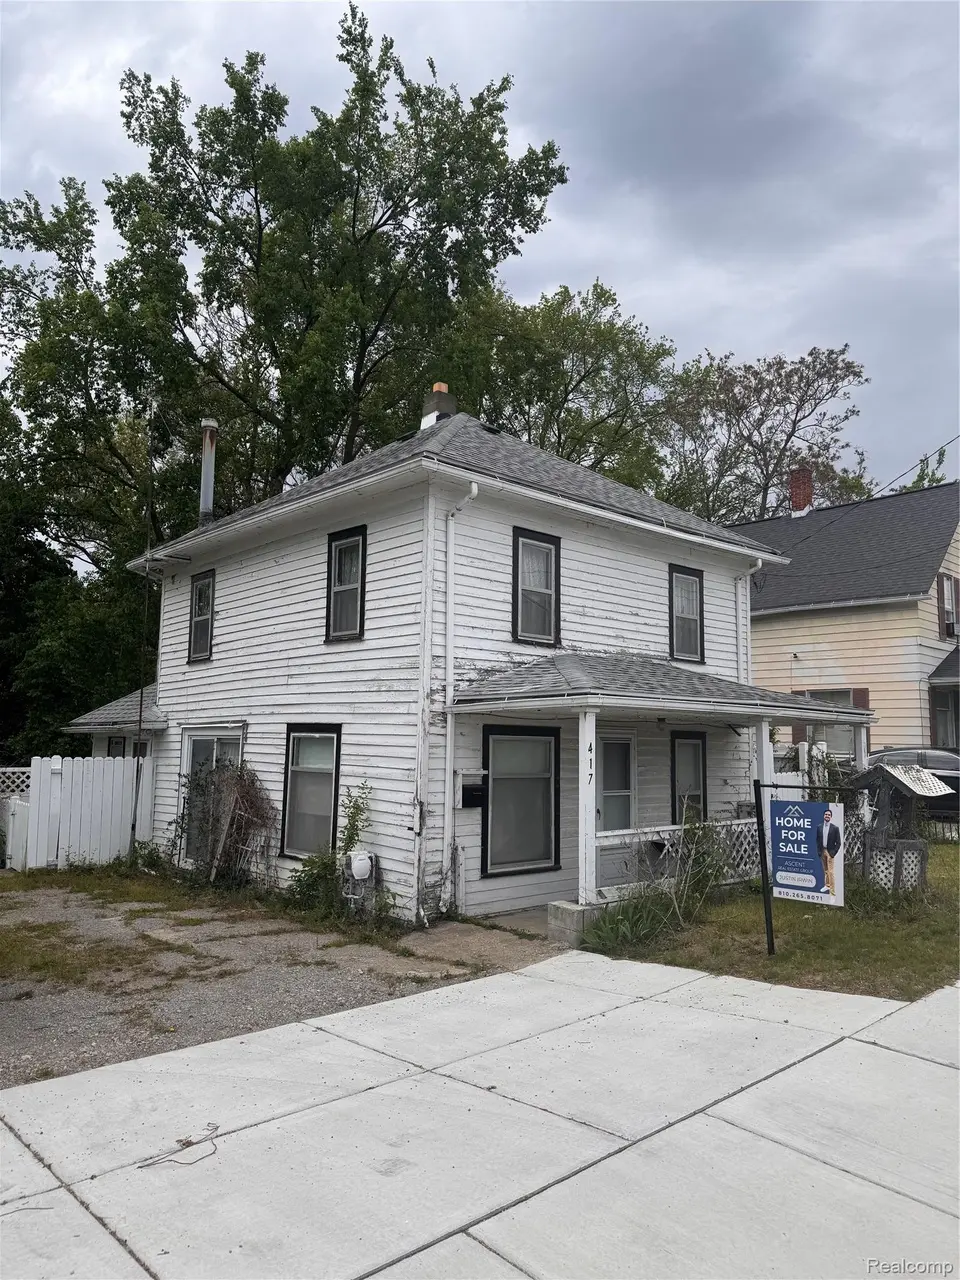
417 N Mill St · Clio, MI
Flood risk 1/10 · Minimal
- FEMA flood zone
- X (unshaded)
- Chance of flooding over 30 yrs
- 0.0%
- Est. flood insurance / yr
- $473 – $860
Fire risk 1/10 · Minimal
- Est. fire insurance / yr
- $784 – $1,456
Heat risk 2/10 · Minimal
- Hot days now (above 97°F)
- 7 days/yr
- Hot days in 30 yrs
- 14 days/yr
Wind risk 2/10 · Minimal
- Chance of severe wind over 30 yrs
- —
Air-quality risk 2/10 · Minimal
- Unhealthy air days now
- 1 days/yr
- Unhealthy air days in 30 yrs
- 2 days/yr
Risk factors via First Street. Map © Google.
Why this score? — see what drove the B- grade
The composite is a weighted blend of 9 inputs, each scored 0–100. Each bar is that input's sub-score; the figure is the points it added to the 100-point composite (weight × sub-score).
- Cash flow +30.0/30.0
- 1% rule +10.0/10.0
- DSCR +10.0/10.0
- ARV discount +7.5/15.0
- Livability +3.5/5.0
- Schools +3.1/10.0
- Rent growth +2.5/5.0
- Condition / age +2.5/5.0
- Appreciation +0.0/10.0
$65,000
🖨 Deal sheet 📄 Offer letter ✓ Due diligence
Listing remarks MLS
Calling all investors, flippers, landlords, and buyers looking for a project! This 3-bedroom, 2-bath home is packed with opportunity and ready for someone to bring it back to life. Features include: Newer furnace. Newer water heater. Roof updated in 2010. Two kitchens. Potential duplex conversion or multi-unit setup. Spacious layout with flexible possibilities. The property does need significant clean-out and cosmetic updates, and is being sold as-is, but the upside is there for the right buyer willing to put in the work. Whether you're looking for your next flip, rental property, or sweat-equity opportunity, this one is worth a look. Located in downtown Clio near schools, parks, the amphitheater, shopping, and expressways.
Key facts
- Two kitchens
- Newer furnace
- Roof updated
Tags
Property features AI
Finance
- HOA & community: Sidewalks in the community
Exterior
- Parking: No garage
- Utilities: Public water; Public sewer; Underground utilities; Electric service with circuit breakers
- Home design: Single-family residence; Two stories; Ground-level entry
- Construction: Wood siding exterior; Stone foundation; Asphalt roof; Built as residential single-family home
- Exterior features: Patio; Back yard fencing; Shed(s) on the property; Paved road access
Interior
- Bedrooms: Total of 8 rooms (includes bedrooms and living spaces)
- Bathrooms: 2 full bathrooms
- Heating & cooling: Forced air heating; Natural gas heating; No central cooling
- Interior features: Partially furnished; Gas water heater; Unfinished basement
- Laundry & utility: Dedicated laundry room
Neighborhood map
What this means for you Summary
Snapshot
- This is a 3-bed/2.0-bath single-family listed at $65k.
Deal economics
- At list price, monthly cash flow is $405 ($5k/yr) — positive.
- The deal already cash-flows at list — no discount required.
- Meets the 1% rule at list price ($1k rent vs $65k).
- Recommended offer: $64k (1.5% below list) — sets the bar for market timing.
- Cap rate 13.8% vs local median 4.7% in Clio — top-decile yield for the area; either an underpriced asset or a hidden risk that comps aren't pricing in. Stress-test before assuming the spread holds.
Location & tenants
- Location reads 69/100 on livability (#332 in MI) — a middle-class / working-renter tenant base. Strengths: cost of living A+, health & safety A-, crime B+; Watch: schools D+, amenities F, commute F.
- Clio Area School District (suburban): math 27% / reading 44% proficiency, ranked #269 of 540 in MI (top 50%) — families likely to look elsewhere, expect single-tenant / working-renter base with shorter leases.
- Market conditions: 148 active listings in the ZIP; 419 units permitted in Genesee County in 2024 (68 in 5+ unit buildings).
Forward outlook
- Local home prices are declining (-3.0%/yr); year-one equity from $449 of loan paydown is wiped out by about $2k of value loss. Plan a longer hold.
- Genesee County population projected at -27% by 2050 — secular population decline; favor cash flow + early exit over multi-decade hold.
- At projected returns (-3.0% appreciation + 3.0% rent growth), your $18k cash investment doubles in ~5 years — after that, you're playing with house money.
Negotiation context
- It's been on market 24 days — a 2% lower offer ($64k) is reasonable based on typical stale-listing flexibility.
- 4 sale attempts with the ask held roughly flat each time — persistent listings suggest the price (not the market) is what's stuck; bring a comps-based counter.
Risks & watch-outs
- Watch-outs: property tax is 3.9% of price; built in 1900 — expect roof / HVAC / electrical / plumbing capex.
Questions for the listing agent
- Built in 1900 — when were the roof, HVAC, electrical panel, plumbing, and water heater last replaced?
- Property tax is high relative to price — has the assessment been appealed recently, and will the sale trigger a re-assessment?
- Is there a deadline driving the sale (1031 exchange, divorce, estate, relocation)? That informs how much negotiation room exists.
- Schools are D-rated, which usually means shorter tenancies and higher turnover. Who's the typical renter profile here, and what's been the actual vacancy rate?
- What's the average days-on-market for RENTAL listings here right now (not sales)? A rising rental-DOM trend means longer vacancies and softer asking-rent achievability than the comps imply.
- What's the recent tenant-quality profile in this submarket — average credit score on applications, eviction rate, late-payment / NSF rate, and stable-employment percentage? A property-management company in the area should have these aggregated.
- How much new for-sale + rental construction is in the pipeline within 1–3 miles? Heavy new supply typically softens prices + rents 12–24 months out; constrained supply supports both.
Investment metrics
- 1% rule
- 1.92% ✓
- Cap rate
- 13.77%
- Cash-on-cash
- 26.70%
- DSCR
- 2.19
- GRM
- 4.3
CMA / ARV
- ARV (on-the-fly)
- $159,000
- Comps found
- 12
Show comp detail 12 sales within ~0.75 mi
| Address | Dist | Beds/Ba | Sqft | Sold | Price | $/sf | Match |
|---|---|---|---|---|---|---|---|
| 617 Center St | 0.18mi | 3/2.0 | 1,386 (+9%) | 5mo | $177,000 | $128 | 72 |
| 300 N Mill St | 0.10mi | 3/2.5 | 1,382 (+9%) | 10mo | $235,000 | $170 | 71 |
| 242 Curry St | 0.22mi | 2/1.5 (-1) | 1,218 (-4%) | 8mo | $130,000 | $107 | 69 |
| 140 E Johnson St | 0.39mi | 3/2.0 | 1,179 (-7%) | 3mo | $63,000 | $53 | 67 |
| 2417 Vaughn Dr | 0.42mi | 3/1.0 | 1,352 (+6%) | 2mo | $176,400 | $130 | 64 |
| 322 Smith St | 0.64mi | 3/1.0 | 1,300 (+2%) | 10mo | $106,000 | $82 | 54 |
| 533 Poplar St | 0.38mi | 3/1.0 | 1,098 (-14%) | 8mo | $137,500 | $125 | 49 |
| 121 Loomis Ave | 0.54mi | 2/1.0 (-1) | 1,410 (+11%) | 1mo | $140,000 | $99 | 47 |
| 324 Pine St | 0.46mi | 3/1.0 | 1,440 (+13%) | 10mo | $175,000 | $122 | 44 |
| 12381 N Saginaw Rd | 0.74mi | 2/1.0 (-1) | 1,204 (-5%) | 5mo | $160,000 | $133 | 43 |
| 11493 Dexter St | 0.65mi | 3/1.0 | 1,440 (+13%) | 4mo | $102,000 | $71 | 40 |
| 312 Hughes St | 0.56mi | 3/1.0 | 1,092 (-14%) | 9mo | $195,400 | $179 | 39 |
Match score weights: distance 35% · size 25% · config 20% · recency 20%. Top-matched comps best support the ARV.
Projected returns pro-forma
-3.0% appreciation · 3.0% rent growth · sell at horizon
- IRR
- 20.7%
- Equity multiple
- 1.84×
- Total profit
- $15,360
- Equity at exit
- $9,692
- IRR
- 28.9%
- Equity multiple
- 3.58×
- Total profit
- $46,992
- Equity at exit
- $5,620
Cash invested: $18,200 (down + closing). Projections, not guarantees.
Landlord ↔ Tenant lean methodology
- Overall (STATE)
- 62 Landlord-Friendly
- State Michigan
- 62 Landlord-Friendly · EVEN
- County
- — inherits STATE
- City
- — inherits STATE
ZIP-level market 48420
- Active inventory
- 148
- Price-to-rent
- 4.3×
Monthly cashflow live
- Estimated rent
- $1,246 medium interval (Pro) →
- Mortgage (P&I)
- −$341
- Tax from tax record
- −$212 /mo · $2,539/yr
- Insurance
- −$27
- HOA
- −$0
- Vacancy / Maint / Mgmt
- −$262
- Net cashflow
- $405
Break-even live
UW: 25.0% down · 7.5% · 30yr · 1.5% tax · 5.0% vac · 8.0% maint · 8.0% mgmt
Financing live
Cash to close
- Down payment
- $16,250
- Closing costs
- $1,950
- Reserves months
- —
- Total cash needed
- —
Loan-product check · same deal, 3 products live
Conventional
25% down · 7.5% · 30yr
- Down + closing
- —
- Monthly P&I
- —
- Monthly cashflow
- —
- DSCR
- —
- Eligible?
- —
Personal DTI + credit; lowest rate.
DSCR
20% down · 8.5% · 30yr
- Down + closing
- —
- Monthly P&I
- —
- Monthly cashflow
- —
- DSCR
- —
- Eligible?
- —
No personal income docs; deal must DSCR.
Hard money
10% down · 12.0% · 12mo
- Down + closing
- —
- Monthly P&I
- —
- Monthly cashflow
- —
- DSCR
- —
- Eligible?
- —
Short-term bridge; refi at stabilization.
Listing history 20 events
-
2026-06-15statusdays on market $65,000 Pending 24 DOM
-
2026-06-14days on market $65,000 Active 23 DOM
-
2026-06-13days on market $65,000 Active 22 DOM
-
2026-06-10days on market $65,000 Active 20 DOM
-
2026-06-09days on market $65,000 Active 19 DOM
-
2026-06-08days on market $65,000 Active 18 DOM
-
2026-06-07days on market $65,000 Active 17 DOM
-
2026-06-03days on market $65,000 Active 13 DOM
-
2026-06-02days on market $65,000 Active 12 DOM
-
2026-06-01days on market $65,000 Active 11 DOM
-
2026-05-31days on market $65,000 Active 10 DOM
-
2026-05-30days on market $65,000 Active 9 DOM
-
2026-05-21$65,000 Active 733-char remark
Show marketing remark (733 chars)
Calling all investors, flippers, landlords, and buyers looking for a project! This 3-bedroom, 2-bath home is packed with opportunity and ready for someone to bring it back to life. Features include: Newer furnace. Newer water heater. Roof updated in 2010. Two kitchens. Potential duplex conversion or multi-unit setup. Spacious layout with flexible possibilities. The property does need significant clean-out and cosmetic updates, and is being sold as-is, but the upside is there for the right buyer willing to put in the work. Whether you're looking for your next flip, rental property, or sweat-equity opportunity, this one is worth a look. Located in downtown Clio near schools, parks, the amphitheater, shopping, and expressways.
-
2026-05-21$65,000 Active
Show marketing remark (733 chars)
Calling all investors, flippers, landlords, and buyers looking for a project! This 3-bedroom, 2-bath home is packed with opportunity and ready for someone to bring it back to life. Features include: Newer furnace. Newer water heater. Roof updated in 2010. Two kitchens. Potential duplex conversion or multi-unit setup. Spacious layout with flexible possibilities. The property does need significant clean-out and cosmetic updates, and is being sold as-is, but the upside is there for the right buyer willing to put in the work. Whether you're looking for your next flip, rental property, or sweat-equity opportunity, this one is worth a look. Located in downtown Clio near schools, parks, the amphitheater, shopping, and expressways.
-
2025-11-05historical
-
2025-11-05historical
-
2025-09-03price $65,000
-
2025-09-03price $65,000
-
2025-07-23$75,000 Active
-
2025-07-23$75,000 Active
ⓘ Source: listings_history table (triggers on properties + properties_extension) + one-shot
backfill from property_details.listing_events for pre-trigger history.
Tax reassessment forecast MI · Partial reset (capped growth)
- Current annual tax
- $2,539 · $212/mo
- Projected year-2 tax
- $2,539 · $212/mo
- Expected delta
- $0/yr ($0/mo · 0.0%)
ⓘ Screening estimate from a state-policy table — verify with the county assessor before closing.
Climate risk First Street
- Flood 1/10 Low FEMA zone X (unshaded) · 0% chance over 30 yrs
- Wildfire 1/10 Low
- Heat 2/10 Low 7 d/yr ≥97°F today · 14 d/yr by 30 yrs out
- Wind 2/10 Low
- Air quality 2/10 Low 1 unhealthy d/yr today · 2 by 30 yrs out
Nearby sold comps map
Loading sold comps map…
Walkable amenities ~0.75 mi
Loading nearby amenities…
Taxation est. · year 1
- Rental income
- $14,954
- − Mortgage interest
- −$3,641
- − Property taxes
- −$2,539
- − Insurance
- −$325
- − Repairs & maintenance
- −$1,196
- − Management
- −$1,196
- − Depreciation
- −$1,891
- Taxable income
- $4,166
- Est. tax owed @ 24.0%
- −$1,000
- After-tax cash flow
- $3,860/yr
For passive investors: Depreciation is non-cash, so a rental often shows a tax loss while cash-flowing — sheltering income. Rental losses are passive: they offset passive income freely, and up to $25,000/yr can offset ordinary (W-2) income if you actively participate and your MAGI is under $100k (phasing out to $0 by $150k); unused losses carry forward. On sale, claimed depreciation is recaptured at up to 25%, and gains may owe capital-gains tax (a 1031 exchange can defer both). Figures are a year-1 estimate at your 24.0% rate — not tax advice; consult a CPA.
Schools (NCES district)
- District
- Clio Area School District
- NCES district ID
- 2610110
- Math proficiency
- 27% ▼ -4.00%
- Reading proficiency
- 44% ▼ -7.00%
- Median HH income
- $51,368
- Composite
- 30.83/100
- National rank
- #6134
- State rank
- #269 of 540 in MI
Livability — Clio
- Score
- 69/100
- State rank
- #332
- US rank
- #8154
Category grades
Schools grade is shown separately in the Schools card above.
Census & demographics
- Census place
- Clio, MI
- Population (ZIP)
- 21,213
Population outlook (Genesee County) Hauer SSP2
- Today (2025)
- 381,312 people
- By 2030
- 362,731 · -4.9%
- By 2040
- 321,550 · -15.7%
- By 2050
- 279,212 · -26.8%
- By 2075
- 193,336 · -49.3%
- By 2100
- 128,118 · -66.4%
Race, ethnicity, and origin ACS 2023
- Neighborhood character
- Predominantly White (89%)
- Race & ethnicity
- White 89% Hispanic / Latino 4% Two or more races 3% Black 3%
- Common ancestry
- Romanian 8% Lithuanian 5% Italian 4%
- Foreign-born
- 2% · Canada
- Languages at home
- 96% English-only · Spanish 2% Other Indo-European 1%
Political lean MEDSL · Genesee
- 2024 margin
- Toss-up / Even · D 51.4% · R 47.2% · Other 1.4%
- 2008→2024 swing
- -28.3pp toward R · 2008: 32.5pp · 2024: 4.2pp
- All cycles
- 2024: D+4.2 2020: D+9.3 2016: D+9.5 2012: D+28.2 2008: D+32.5
Not yet ingested
- Civics
- —
Market trends
- HPI YoY
- ▼ -192.27%
- Current HPI
- 186.7816
- Rent YoY
- —
- Metro
- —
- State GDP YoY
- ▲ 1.37%
- F500 in state
- 28
Industry mix (Fortune 500 HQ in MI)
| Industry | F500 HQs | Revenue |
|---|---|---|
| Automotive Parts | 3 | $48B |
|
||
| Automotive | 2 | $372B |
|
||
| Chemicals | 1 | $45B |
|
||
| Automotive Retail | 1 | $29B |
|
||
| Healthcare / Medical Devices | 1 | $23B |
|
||
| Automotive Technology | 1 | $20B |
|
||
Price history
-13.3% since first listed8 events — show timeline
- 2026-05-21 Listed $65,000 REALCOMP
- 2026-05-21 Listed $65,000 MiRealSource-MiMLS
- 2025-11-05 Listing Removed — MiRealSource-MiMLS
- 2025-11-05 Listing Removed — REALCOMP
- 2025-09-03 Price Changed $65,000 MiRealSource-MiMLS
- 2025-09-03 Price Changed $65,000 REALCOMP
- 2025-07-23 Listed $75,000 MiRealSource-MiMLS
- 2025-07-23 Listed $75,000 REALCOMP
Property tax history
+7.4%/yrLatest (2025): $2,539 · +2.5% YoY. Source: county tax records.
Cash-flow waterfall
monthlySold comps — $/sqft
last 12 mo · ≤1 miLoading sold comps…