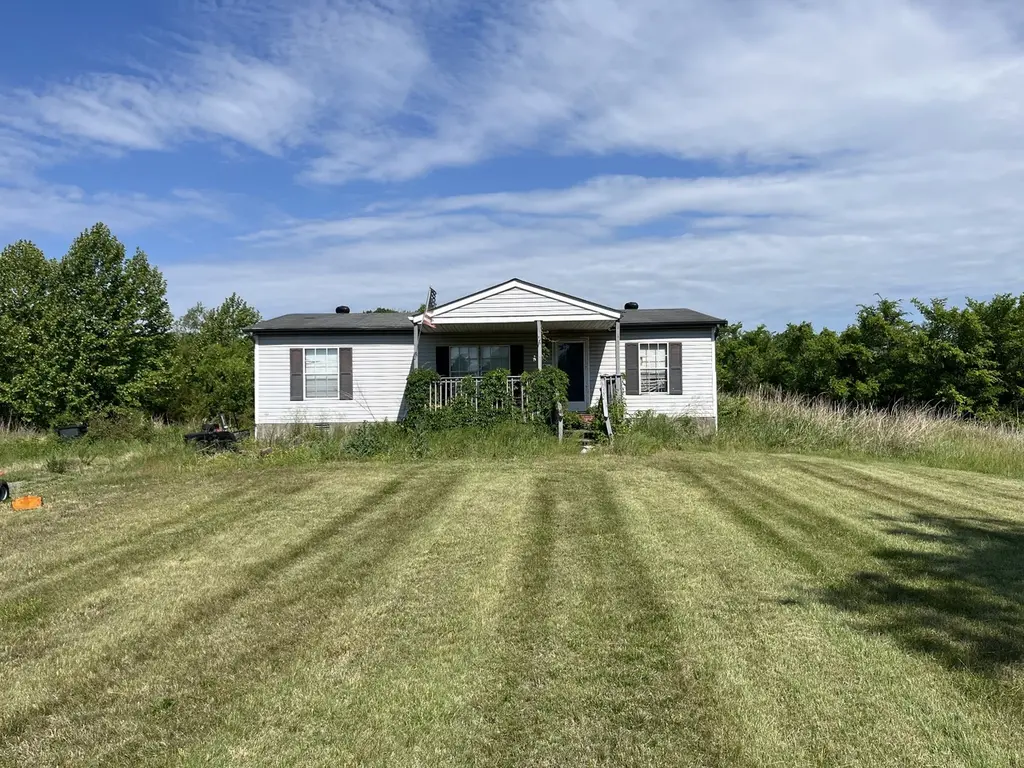
916 Knollwood Lndg · Lebanon, TN
Flood risk 1/10 · Minimal
- FEMA flood zone
- A
- Chance of flooding over 30 yrs
- 0.0%
- Est. flood insurance / yr
- $1,009 – $1,996
Fire risk 3/10 · Minor
- Est. fire insurance / yr
- $949 – $1,763
Heat risk 6/10 · Moderate
- Hot days now (above 106°F)
- 7 days/yr
- Hot days in 30 yrs
- 20 days/yr
Wind risk 4/10 · Minor
- Chance of severe wind over 30 yrs
- 9.0%
Air-quality risk 2/10 · Minimal
- Unhealthy air days now
- 0 days/yr
- Unhealthy air days in 30 yrs
- 2 days/yr
Risk factors via First Street. Map © Google.
Why this score? — see what drove the C grade
The composite is a weighted blend of 9 inputs, each scored 0–100. Each bar is that input's sub-score; the figure is the points it added to the 100-point composite (weight × sub-score).
- Cash flow +23.7/30.0
- DSCR +7.6/10.0
- ARV discount +7.5/15.0
- 1% rule +4.8/10.0
- Schools +3.8/10.0
- Livability +3.5/5.0
- Rent growth +3.1/5.0
- Condition / age +2.5/5.0
- Appreciation +0.0/10.0
$229,900
🖨 Deal sheet (PDF) 📄 Offer letter ✓ Due diligence
Listing remarks
Investor Special with Acreage and Prime Location Opportunity awaits on this 2.58-acre property located in a quiet cul-de-sac just off State Highway 109 in Lebanon, TN. This property offers convenient access while maintaining a peaceful country setting. The manufactured home requires substantial repairs and is being sold AS-IS, making it ideal for investors, renovators, or buyers looking to create their own rural retreat. The property's greatest asset is the land and location. Nestled on 2.58 mostly usable acres, the property provides privacy, space for recreation, gardening, animals, or future improvements. The cul-de-sac setting offers minimal traffic and a tranquil environment, while High
Key facts
- Mostly usable acres
- Quiet cul-de-sac
- Space for gardening
Tags
Property features AI
Finance
- HOA & community: Pets allowed
Exterior
- Parking: Gravel parking, 4 open parking spaces (4 total parking spaces)
- Utilities: Public water; Septic tank; Water available
- Home design: Manufactured on land (residential); One level
- Construction: Vinyl siding; Shingle roof; Block foundation; Existing (year built not specified)
- Exterior features: Porch (covered); Deck
Interior
- Kitchen: Electric oven and range; Dishwasher
- Bedrooms: 3 bedrooms (all on the main level)
- Flooring: Carpet; Vinyl
- Bathrooms: 2 full bathrooms
- Heating & cooling: Central heating; Central air conditioning
- Interior features: Electric oven, electric range, dishwasher; Crawl space basement
- Laundry & utility: Washer hookup; Electric dryer hookup
Neighborhood map
What this means for you Summary
Snapshot
- This is a 3-bed/2.0-bath manufactured listed at $230k.
Deal economics
- At list price, monthly cash flow is $313 ($4k/yr) — positive.
- The deal already cash-flows at list — no discount required.
- To meet the 1% rule (rent ≥ 1% of price), the offer needs to be $225k (2.0% below list).
- Recommended offer: $225k (2.0% below list) — sets the bar for 1% rule.
- Cap rate 8.6% vs local median 2.8% in Lebanon — top-decile yield for the area; either an underpriced asset or a hidden risk that comps aren't pricing in. Stress-test before assuming the spread holds.
Location & tenants
- Location reads 70/100 on livability (#49 in TN) — a middle-class / working-renter tenant base. Strengths: housing A+, health & safety A, cost of living A-; Watch: amenities F, commute F.
- Wilson County (rural): math 42% / reading 43% proficiency, ranked #10 of 139 in TN (top 7%) — families likely to look elsewhere, expect single-tenant / working-renter base with shorter leases.
- Zoned schools: Lakeview Elementary School (math 62% / reading 58%, grade B-, #59 of 952 statewide, top 6%, 514 students, 0% FRL); Mt. Juliet High School (math 20% / reading 49%, grade F, #41 of 332 statewide, top 15%, 1,633 students, 0% FRL) — zoned schools average 0% FRL vs 25% district-wide (25 pts lower); this property's tenant base skews higher-income than the district average.
- Market conditions: Rents rising (+2.5%/yr); 704 active listings in the ZIP; 2 comparable units currently listed for rent nearby; solid renter incomes; 1,927 units permitted in Wilson County in 2024 (10 in 5+ unit buildings).
- This rent runs 33% of the median local income ($82k/yr) — at the standard rent-burdened threshold; future hikes will face affordability resistance.
Forward outlook
- Local home prices are declining (-3.0%/yr); year-one equity from $2k of loan paydown is wiped out by about $7k of value loss. Plan a longer hold.
- Wilson County population projected at +47% by 2050 — long-run rental-demand tailwind backs the buy-and-hold thesis.
Negotiation context
- It's been on market 16 days — a 2% lower offer ($226k) is reasonable based on typical stale-listing flexibility.
- Current owner paid $66k; list at $230k implies a 248% gain — meaningful room to come down on a strong offer.
Risks & watch-outs
- Watch-outs: flood insurance adds $125/mo.
- Climate carrying-cost: in FEMA flood zone A (mandatory federal flood insurance); extreme-heat days projected 7→20/yr by 2055 (HVAC capex compounding) — expect insurance premiums to compound above CPI over the hold.
Questions for the listing agent
- What's the actual annual flood-insurance premium (NFIP or private), and is the property in a SFHA with mandatory coverage?
- Is there a deadline driving the sale (1031 exchange, divorce, estate, relocation)? That informs how much negotiation room exists.
- Schools are D-rated, which usually means shorter tenancies and higher turnover. Who's the typical renter profile here, and what's been the actual vacancy rate?
- What's the average days-on-market for RENTAL listings here right now (not sales)? A rising rental-DOM trend means longer vacancies and softer asking-rent achievability than the comps imply.
- What's the recent tenant-quality profile in this submarket — average credit score on applications, eviction rate, late-payment / NSF rate, and stable-employment percentage? A property-management company in the area should have these aggregated.
- How much new for-sale + rental construction is in the pipeline within 1–3 miles? Heavy new supply typically softens prices + rents 12–24 months out; constrained supply supports both.
Investment metrics
- 1% rule
- 0.98% ✗
- Cap rate
- 8.58%
- Cash-on-cash
- 8.18%
- DSCR
- 1.36
- GRM
- 8.5
CMA / ARV
No comps found within radius.
Projected returns pro-forma
-3.0% appreciation · 2.52% rent growth · sell at horizon
- IRR
- -7.8%
- Equity multiple
- 0.71×
- Total profit
- $-18,418
- Equity at exit
- $34,279
- IRR
- 1.1%
- Equity multiple
- 1.08×
- Total profit
- $5,095
- Equity at exit
- $19,878
Cash invested: $64,372 (down + closing). Projections, not guarantees.
Landlord ↔ Tenant lean methodology
- Overall (STATE)
- 87 Strongly Landlord-Friendly
- State Tennessee
- 87 Strongly Landlord-Friendly · R+13
- County
- — inherits STATE
- City
- — inherits STATE
ZIP-level market 37087
- Home prices YoY
- -27.8%
- Rents YoY
- 2.5%
- Active inventory
- 704
- Price-to-rent
- 8.5×
Monthly cashflow live
- Estimated rent
- $2,252 medium interval (Pro) →
- Mortgage (P&I)
- −$1,206
- Tax from tax record
- −$39 /mo · $468/yr
- Insurance
- −$96
- Flood insurance flood zone
- −$125 /mo · $1,502/yr
- HOA
- −$0
- Vacancy / Maint / Mgmt
- −$473
- Net cashflow
- $313
Break-even live
Sensitivity live
| Price | -10% $444 | -5% $378 | +0% $313 | +5% $-14 | +10% $-94 |
|---|---|---|---|---|---|
| Rent | -10% $135 | -5% $224 | +0% $313 | +5% $402 | +10% $491 |
| Rate | -1.0pp $429 | -0.5pp $372 | base $313 | +0.5pp $254 | +1.0pp $193 |
UW: 25.0% down · 7.5% · 30yr · 1.5% tax · 5.0% vac · 8.0% maint · 8.0% mgmt
Financing live
Cash to close
- Down payment
- $57,475
- Closing costs
- $6,897
- Reserves months
- —
- Total cash needed
- —
Loan-product check · same deal, 3 products live
Conventional
25% down · 7.5% · 30yr
- Down + closing
- —
- Monthly P&I
- —
- Monthly cashflow
- —
- DSCR
- —
- Eligible?
- —
Personal DTI + credit; lowest rate.
DSCR
20% down · 8.5% · 30yr
- Down + closing
- —
- Monthly P&I
- —
- Monthly cashflow
- —
- DSCR
- —
- Eligible?
- —
No personal income docs; deal must DSCR.
Hard money
10% down · 12.0% · 12mo
- Down + closing
- —
- Monthly P&I
- —
- Monthly cashflow
- —
- DSCR
- —
- Eligible?
- —
Short-term bridge; refi at stabilization.
Rent comps 2 comps
| Address | Beds | Baths | Sqft | Rent | $/sqft | DOM | Units | Dist |
|---|---|---|---|---|---|---|---|---|
| 2244 Cooks Rd Mount Juliet, TN | 3.0 | 2.0 | 1400 | $2,200 | $1.57 | 44d | 1 | 0.83mi |
| 550 Old Laguardo Rd W Mt. Juliet, TN | 1.0–3.0 | 1.0–2.0 | 1126 | $2,530 | $2.25 | 3d | 19 | 1.21mi |
Listing history 11 events
-
2026-06-18days on market $229,900 Active 16 DOM
-
2026-06-17days on market $229,900 Active 15 DOM
-
2026-06-16days on market $229,900 Active 14 DOM
-
2026-06-15days on market $229,900 Active 13 DOM
-
2026-06-13days on market $229,900 Active 11 DOM
-
2026-06-10status $229,900 Active 7 DOM
-
2026-06-09days on market $229,900 Active Under Contract 7 DOM
-
2026-06-08days on market $229,900 Active Under Contract 6 DOM
-
2026-06-07statusdays on market $229,900 Active Under Contract 5 DOM
-
2026-06-02remarks 699-char remark
-
2026-06-02$229,900 Active 1 DOM
ⓘ Source: listings_history table (triggers on properties + properties_extension) + one-shot
backfill from property_details.listing_events for pre-trigger history.
Tax reassessment forecast TN · Resets to sale price
- Current annual tax
- $468 · $39/mo
- Projected year-2 tax
- $1,632 · $136/mo
- Expected delta
- +$1,164/yr (+$97/mo · 248.8%)
ⓘ Screening estimate from a state-policy table — verify with the county assessor before closing.
Climate risk First Street
- Flood 1/10 Low FEMA zone A · 0% chance over 30 yrs
- Wildfire 3/10 Moderate
- Heat 6/10 Major 7 d/yr ≥106°F today · 20 d/yr by 30 yrs out
- Wind 4/10 Moderate 9% chance of damaging wind over 30 yrs
- Air quality 2/10 Low 0 unhealthy d/yr today · 2 by 30 yrs out
Nearby sold comps map
Loading sold comps map…
Walkable amenities ~0.75 mi
Loading nearby amenities…
Taxation est. · year 1
- Rental income
- $27,023
- − Mortgage interest
- −$12,878
- − Property taxes
- −$468
- − Insurance
- −$2,652
- − Repairs & maintenance
- −$2,162
- − Management
- −$2,162
- − Depreciation
- −$6,688
- Taxable income
- $13
- Est. tax owed @ 24.0%
- −$3
- After-tax cash flow
- $3,757/yr
For passive investors: Depreciation is non-cash, so a rental often shows a tax loss while cash-flowing — sheltering income. Rental losses are passive: they offset passive income freely, and up to $25,000/yr can offset ordinary (W-2) income if you actively participate and your MAGI is under $100k (phasing out to $0 by $150k); unused losses carry forward. On sale, claimed depreciation is recaptured at up to 25%, and gains may owe capital-gains tax (a 1031 exchange can defer both). Figures are a year-1 estimate at your 24.0% rate — not tax advice; consult a CPA.
Schools (NCES district)
- District
- Wilson County
- NCES district ID
- 4704550
- Math proficiency
- 42% ▼ -11.00%
- Reading proficiency
- 43% ▼ -4.00%
- Median HH income
- $68,429
- Composite
- 38.33/100
- National rank
- #4225
- State rank
- #10 of 139 in TN
Livability — Lebanon
- Score
- 70/100
- State rank
- #49
- US rank
- #7389
Category grades
Schools grade is shown separately in the Schools card above.
Census & demographics
- County
- Wilson County · 144,921 people
- City population
- 76,429
- Metro
- Nashville-Davidson--Murfreesboro--Franklin, TN
- Population (ZIP)
- 56,655
- Household income
- $82,143
- Rent vs Own
- Severe rent burden
- 1538.0
Population outlook (Wilson County) Hauer SSP2
- Today (2025)
- 160,409 people
- By 2030
- 176,099 · +9.8%
- By 2040
- 206,769 · +28.9%
- By 2050
- 235,383 · +46.7%
- By 2075
- 302,144 · +88.4%
- By 2100
- 343,710 · +114.3%
Race, ethnicity, and origin ACS 2023
- Neighborhood character
- Predominantly White (77%)
- Race & ethnicity
- White 77% Black 8% Two or more races 7% Hispanic / Latino 7% Asian 2%
- Hispanic origin (detail)
- Mexican 5%
- Common ancestry
- Slovak 3% Italian 2% Lithuanian 2%
- Foreign-born
- 5% · Canada
- Languages at home
- 92% English-only · Spanish 5% Other Indo-European 1%
Political lean MEDSL · Wilson
- 2024 margin
- Solid R (+40.1) · D 29.4% · R 69.4% · Other 1.2%
- 2008→2024 swing
- -3.5pp toward R · 2008: -36.6pp · 2024: -40.1pp
- All cycles
- 2024: R+40.1 2020: R+37.7 2016: R+44.3 2012: R+41.6 2008: R+36.6
Not yet ingested
- Civics
- —
Market trends
- HPI YoY
- ▼ -119.11%
- Current HPI
- 310.1835
- Rent YoY
- ▲ 2.52%
- Metro
- Nashville-Davidson--Murfreesboro--Franklin, TN
- State GDP YoY
- ▲ 2.78%
- F500 in state
- 22
Industry mix (Fortune 500 HQ in TN)
| Industry | F500 HQs | Revenue |
|---|---|---|
| Healthcare | 3 | $91B |
|
||
| Retail | 3 | $72B |
|
||
| Transportation / Logistics | 1 | $88B |
|
||
| Paper / Packaging | 1 | $19B |
|
||
| Insurance | 1 | $13B |
|
||
| Energy | 1 | $12B |
|
||
Price history
+248.3% since first listed2 events — show timeline
- 2026-06-02 Listed $229,900 REALTRACS as Distributed by MLS Grid
- 2014-07-15 Sold (Public Records) $66,000 Public Records
Property tax history
-1.5%/yrLatest (2025): $468 · +0.0% YoY. Source: county tax records.
Cash-flow waterfall
monthlySold comps — $/sqft
last 12 mo · ≤1 miLoading sold comps…