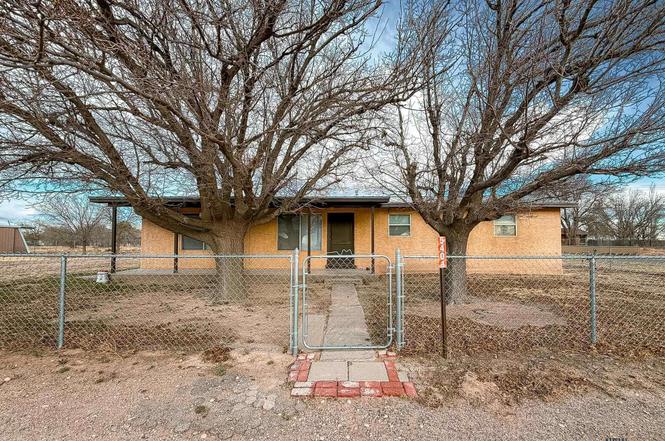
5401 Ocotillo Ave · Roswell, NM
Flood risk 1/10 · Minimal
- FEMA flood zone
- X (shaded)
- Chance of flooding over 30 yrs
- 0.0%
- Est. flood insurance / yr
- $507 – $1,088
Fire risk 7/10 · Major
- Est. fire insurance / yr
- $706 – $1,312
Heat risk 6/10 · Moderate
- Hot days now (above 100°F)
- 7 days/yr
- Hot days in 30 yrs
- 21 days/yr
Wind risk 2/10 · Minimal
- Chance of severe wind over 30 yrs
- —
Air-quality risk 1/10 · Minimal
- Unhealthy air days now
- 0 days/yr
- Unhealthy air days in 30 yrs
- 0 days/yr
Risk factors via First Street. Map © Google.
Why this score? — see what drove the C- grade
The composite is a weighted blend of 9 inputs, each scored 0–100. Each bar is that input's sub-score; the figure is the points it added to the 100-point composite (weight × sub-score).
- Cash flow +19.9/30.0
- ARV discount +7.5/15.0
- DSCR +6.3/10.0
- 1% rule +4.0/10.0
- Livability +3.8/5.0
- Rent growth +3.6/5.0
- Schools +2.6/10.0
- Condition / age +2.5/5.0
- Appreciation +0.0/10.0
$184,900
🖨 Deal sheet (PDF) 📄 Offer letter ✓ Due diligence
Listing remarks
Country living just minutes from town! Situated on . 63 acre, this property offers space to spread out both inside and out. Enter through the fully fenced and gated yard into an open living and dining area that flows into a large U-shaped kitchen featuring abundant cabinetry, all major appliances, and washer/dryer hookups. Down the hall are three well-sized bedrooms, including a primary with its own private ½ bath, while the ¾ hall bath serves the rest of the home. Step outside to a covered patio perfect for enjoying the New Mexico skies. The property also features a 960± sq ft workshop ideal for hobbies, projects, or storage, an additional storage shed, and plenty of r
Key facts
- Covered patio
- Abundant cabinetry
- Gated yard
Tags
Neighborhood map
What this means for you Summary
Snapshot
- This is a 3-bed/1.0-bath single-family listed at $185k.
Deal economics
- At list price, monthly cash flow is $223 ($3k/yr) — positive.
- The deal already cash-flows at list — no discount required.
- To meet the 1% rule (rent ≥ 1% of price), the offer needs to be $167k (9.7% below list).
- Recommended offer: $167k (9.7% below list) — sets the bar for 1% rule.
Location & tenants
- Location reads 75/100 on livability (#8 in NM, #4,339 nationally) — a middle-class / working-renter tenant base. Strengths: commute A+, cost of living A+, housing A+; Watch: employment D, schools F, crime F.
- Roswell Independent Schools (town): math 11% / reading 52% proficiency, ranked #16 of 29 in NM (top 55%) — families likely to look elsewhere, expect single-tenant / working-renter base with shorter leases; 75% free/reduced lunch — lower-income household profile, screen leases tightly.
- Market conditions: Rents rising fast (+4.3%/yr); 248 active listings in the ZIP; 1 comparable units currently listed for rent nearby; 88 units permitted in Chaves County in 2024 (0 in 5+ unit buildings).
- This rent runs 32% of the median local income ($62k/yr) — at the standard rent-burdened threshold; future hikes will face affordability resistance.
Forward outlook
- Local home prices are declining (-3.0%/yr); year-one equity from $1k of loan paydown is wiped out by about $6k of value loss. Plan a longer hold.
Negotiation context
- It's been on market 41 days — a 3% lower offer ($179k) is reasonable based on typical stale-listing flexibility.
Risks & watch-outs
- Climate carrying-cost: major wildfire risk; extreme-heat days projected 7→21/yr by 2055 (HVAC capex compounding) — expect insurance premiums to compound above CPI over the hold.
Questions for the listing agent
- It's been on market 41 days. Have you received any prior offers? Is the seller open to a 10% concession, seller financing, or rate buy-down credit?
- Is there a deadline driving the sale (1031 exchange, divorce, estate, relocation)? That informs how much negotiation room exists.
- Schools are F-rated, which usually means shorter tenancies and higher turnover. Who's the typical renter profile here, and what's been the actual vacancy rate?
- Crime grade is F in this area — have there been break-ins, vandalism, or insurance claims at this property in the last 3 years? What carrier currently insures it and at what premium?
- What's the average days-on-market for RENTAL listings here right now (not sales)? A rising rental-DOM trend means longer vacancies and softer asking-rent achievability than the comps imply.
- What's the recent tenant-quality profile in this submarket — average credit score on applications, eviction rate, late-payment / NSF rate, and stable-employment percentage? A property-management company in the area should have these aggregated.
- How much new for-sale + rental construction is in the pipeline within 1–3 miles? Heavy new supply typically softens prices + rents 12–24 months out; constrained supply supports both.
Investment metrics
- 1% rule
- 0.90% ✗
- Cap rate
- 7.74%
- Cash-on-cash
- 5.16%
- DSCR
- 1.23
- GRM
- 9.2
CMA / ARV
No comps found within radius.
Projected returns pro-forma
-3.0% appreciation · 4.32% rent growth · sell at horizon
- IRR
- -7.0%
- Equity multiple
- 0.74×
- Total profit
- $-13,621
- Equity at exit
- $27,569
- IRR
- 3.9%
- Equity multiple
- 1.30×
- Total profit
- $15,515
- Equity at exit
- $15,987
Cash invested: $51,772 (down + closing). Projections, not guarantees.
Landlord ↔ Tenant lean methodology
- Overall (STATE)
- 55 Moderately Landlord-Leaning
- State New Mexico
- 55 Moderately Landlord-Leaning · D+3
- County
- — inherits STATE
- City
- — inherits STATE
ZIP-level market 88201
- Rents YoY
- 4.3%
- Active inventory
- 248
- Price-to-rent
- 9.2×
Monthly cashflow live
- Estimated rent
- $1,669 medium interval (Pro) →
- Mortgage (P&I)
- −$970
- Tax from tax record
- −$49 /mo · $591/yr
- Insurance
- −$77
- HOA
- −$0
- Vacancy / Maint / Mgmt
- −$351
- Net cashflow
- $223
Break-even live
Sensitivity live
| Price | -10% $327 | -5% $275 | +0% $223 | +5% $170 | +10% $118 |
|---|---|---|---|---|---|
| Rent | -10% $91 | -5% $157 | +0% $223 | +5% $289 | +10% $355 |
| Rate | -1.0pp $316 | -0.5pp $270 | base $223 | +0.5pp $175 | +1.0pp $126 |
UW: 25.0% down · 7.5% · 30yr · 1.5% tax · 5.0% vac · 8.0% maint · 8.0% mgmt
Financing live
Cash to close
- Down payment
- $46,225
- Closing costs
- $5,547
- Reserves months
- —
- Total cash needed
- —
Loan-product check · same deal, 3 products live
Conventional
25% down · 7.5% · 30yr
- Down + closing
- —
- Monthly P&I
- —
- Monthly cashflow
- —
- DSCR
- —
- Eligible?
- —
Personal DTI + credit; lowest rate.
DSCR
20% down · 8.5% · 30yr
- Down + closing
- —
- Monthly P&I
- —
- Monthly cashflow
- —
- DSCR
- —
- Eligible?
- —
No personal income docs; deal must DSCR.
Hard money
10% down · 12.0% · 12mo
- Down + closing
- —
- Monthly P&I
- —
- Monthly cashflow
- —
- DSCR
- —
- Eligible?
- —
Short-term bridge; refi at stabilization.
Rent comps 1 comps
| Address | Beds | Baths | Sqft | Rent | $/sqft | DOM | Units | Dist |
|---|---|---|---|---|---|---|---|---|
| 703 Broken Arrow Rd Unit 743 Roswell, NM | 3.0 | 2.0 | 1405 | $1,850 | $1.32 | 44d | 1 | 1.47mi |
Listing history 3 events
-
2026-04-21status Pending
-
2026-03-11$184,900 Active
-
2025-10-01price $200,000
ⓘ Source: listings_history table (triggers on properties + properties_extension) + one-shot
backfill from property_details.listing_events for pre-trigger history.
Tax reassessment forecast NM · Resets to sale price
- Current annual tax
- $591 · $49/mo
- Projected year-2 tax
- $1,479 · $123/mo
- Expected delta
- +$888/yr (+$74/mo · 150.3%)
ⓘ Screening estimate from a state-policy table — verify with the county assessor before closing.
Climate risk First Street
- Flood 1/10 Low FEMA zone X (shaded) · 0% chance over 30 yrs
- Wildfire 7/10 Severe
- Heat 6/10 Major 7 d/yr ≥100°F today · 21 d/yr by 30 yrs out
- Wind 2/10 Low
- Air quality 1/10 Low 0 unhealthy d/yr today · 0 by 30 yrs out
Nearby sold comps map
Loading sold comps map…
Walkable amenities ~0.75 mi
Loading nearby amenities…
Taxation est. · year 1
- Rental income
- $20,029
- − Mortgage interest
- −$10,357
- − Property taxes
- −$591
- − Insurance
- −$924
- − Repairs & maintenance
- −$1,602
- − Management
- −$1,602
- − Depreciation
- −$5,379
- Taxable loss
- −$427
- Est. tax savings @ 24.0%
- +$103
- After-tax cash flow
- $2,774/yr
For passive investors: Depreciation is non-cash, so a rental often shows a tax loss while cash-flowing — sheltering income. Rental losses are passive: they offset passive income freely, and up to $25,000/yr can offset ordinary (W-2) income if you actively participate and your MAGI is under $100k (phasing out to $0 by $150k); unused losses carry forward. On sale, claimed depreciation is recaptured at up to 25%, and gains may owe capital-gains tax (a 1031 exchange can defer both). Figures are a year-1 estimate at your 24.0% rate — not tax advice; consult a CPA.
Schools (NCES district)
- District
- Roswell Independent Schools
- NCES district ID
- 3502250
- Math proficiency
- 11% ▼ -9.00%
- Reading proficiency
- 52% ▲ 23.00%
- Median HH income
- $38,848
- Composite
- 26.21/100
- National rank
- #7262
- State rank
- #16 of 29 in NM
Livability — Roswell
- Score
- 75/100
- State rank
- #8
- US rank
- #4339
Category grades
Schools grade is shown separately in the Schools card above.
Census & demographics
- County
- Chaves County · 56,277 people
- City population
- 56,277
- Metro
- Roswell, NM
- Population (ZIP)
- 27,524
- Household income
- $61,780
- Rent vs Own
- Severe rent burden
- 603.0
Population outlook (Chaves County) Hauer SSP2
- Today (2025)
- 66,122 people
- By 2030
- 66,351 · +0.3%
- By 2040
- 66,818 · +1.1%
- By 2050
- 66,928 · +1.2%
- By 2075
- 65,474 · -1.0%
- By 2100
- 58,943 · -10.9%
Race, ethnicity, and origin ACS 2023
- Neighborhood character
- Diverse neighborhood (Simpson 0.56)
- Race & ethnicity
- Hispanic / Latino 50% White 44% Two or more races 16% Asian 2% Black 1%
- Hispanic origin (detail)
- Mexican 38%
- Common ancestry
- Slovak 2% Italian 1% Serbian 1%
- Foreign-born
- 9% · Canada
- Languages at home
- 73% English-only · Spanish 23% Tagalog/Filipino 1% Other Asian/Pacific 1%
Political lean MEDSL · Chaves
- 2024 margin
- Solid R (+44.8) · D 26.8% · R 71.6% · Other 1.6%
- 2008→2024 swing
- -20.2pp toward R · 2008: -24.7pp · 2024: -44.8pp
- All cycles
- 2024: R+44.8 2020: R+41.3 2016: R+36.4 2012: R+32.4 2008: R+24.7
Not yet ingested
- Civics
- —
Market trends
- HPI YoY
- ▼ -130.52%
- Current HPI
- 149.3526
- Rent YoY
- ▲ 4.32%
- Metro
- Roswell, NM
- State GDP YoY
- —
- F500 in state
- 0
Price history
-7.5% since first listed3 events — show timeline
- 2026-04-21 Pending — NMMLS
- 2026-03-11 Listed $184,900 NMMLS
- 2025-10-01 Price Changed $200,000 NMMLS
Property tax history
+1.2%/yrLatest (2025): $591 · -1.5% YoY. Source: county tax records.
Cash-flow waterfall
monthlySold comps — $/sqft
last 12 mo · ≤1 miLoading sold comps…