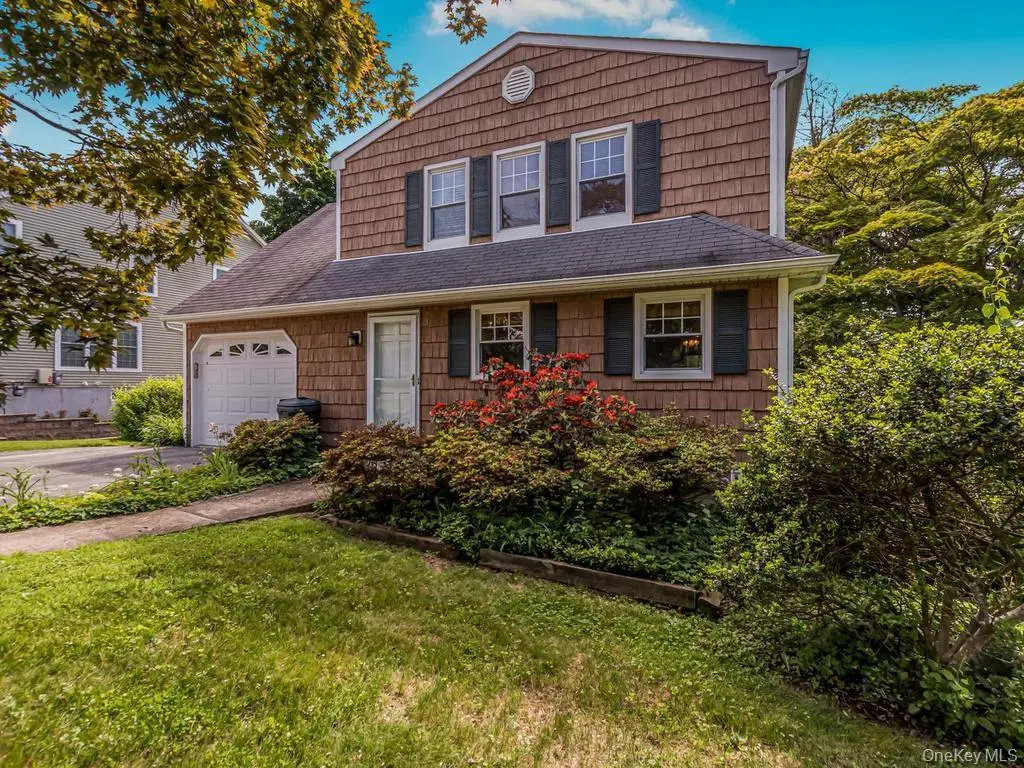
211 Warren Ave · Hawthorne, NY
Flood risk 1/10 · Minimal
- FEMA flood zone
- X (unshaded)
- Chance of flooding over 30 yrs
- 0.0%
- Est. flood insurance / yr
- $473 – $860
Fire risk 1/10 · Minimal
- Est. fire insurance / yr
- $691 – $1,283
Heat risk 5/10 · Moderate
- Hot days now (above 98°F)
- 7 days/yr
- Hot days in 30 yrs
- 15 days/yr
Wind risk 6/10 · Moderate
- Chance of severe wind over 30 yrs
- 27.0%
Air-quality risk 4/10 · Minor
- Unhealthy air days now
- 4 days/yr
- Unhealthy air days in 30 yrs
- 6 days/yr
Risk factors via First Street. Map © Google.
Why this score? — see what drove the B- grade
The composite is a weighted blend of 9 inputs, each scored 0–100. Each bar is that input's sub-score; the figure is the points it added to the 100-point composite (weight × sub-score).
- Cash flow +30.0/30.0
- 1% rule +10.0/10.0
- DSCR +10.0/10.0
- Schools +6.0/10.0
- ARV discount +4.9/15.0
- Livability +3.6/5.0
- Rent growth +2.5/5.0
- Condition / age +2.5/5.0
- Appreciation +0.0/10.0
$799,900
🖨 Deal sheet 📄 Offer letter ✓ Due diligence
Listing remarks
Desirable 4 bedroom Colonial situated on a flat corner lot in a lovely neighborhood in Hawthorne, Westchester County. Upon entering you are welcomed by an entry hall leading to a bright living room and formal dining room with a ceiling fan. The large eat-in-kitchen features a pantry with convenient slide-out drawers, a ceiling fan and a door leading to the welcoming yard. Off the kitchen is an additional room ideal for a den, office or playroom. This sun-filled home offers abundant natural light through its many windows. The second floor features a primary bedroom, hall bath, plus 3 additional bedrooms. Each window offers views of beautiful mature trees. . Hardwood floors through out. The f
Key facts
- Large eat-in-kitchen
- Entry hall
- Flat corner lot
Tags
Property features AI
Exterior
- Parking: Driveway; 1-car garage
- Utilities: Public sewer; Sewer available; Public trash collection
- Home design: Single family residence; Two stories; Living area based on plans; Property in actual condition
- Construction: Vinyl siding construction
- Exterior features: Vinyl siding; Not waterfront
Interior
- Kitchen: Dishwasher; Electric cooktop; Oven; Microwave
- Bedrooms: Bedroom on the first floor
- Bathrooms: 1 full bathroom; 1 half bathroom
- Heating & cooling: Baseboard heating (natural gas); Wall/window air conditioning units
- Interior features: First-floor bedroom; Ceiling fans; Eat-in kitchen; Formal dining; Primary bathroom; Unfinished basement; Attic (see remarks); Two levels; Total of 8 rooms
- Laundry & utility: Washer; Dryer
Neighborhood map
What this means for you Summary
Snapshot
- This is a 4-bed/1.0-bath single-family listed at $800k.
Deal economics
- At list price, monthly cash flow is $5k ($58k/yr) — positive.
- The deal already cash-flows at list — no discount required.
- Meets the 1% rule at list price ($13k rent vs $800k).
- Recommended offer: $788k (1.5% below list) — sets the bar for market timing.
Location & tenants
- Location reads 71/100 on livability (#399 in NY) — a middle-class / working-renter tenant base. Strengths: crime A+, commute A+, employment A+; Watch: amenities F, cost of living F, health & safety F.
- Mount Pleasant Central School District (suburban): math 62% / reading 65% proficiency, ranked #146 of 590 in NY (top 25%) — acceptable for families but not a draw, mixed tenant base, ~2y average lease; only 5% free/reduced lunch — higher-income household profile.
- Zoned schools: Hawthorne Elementary School (460 students, 10% FRL); Westlake Middle School (math 55% / reading 61%, grade B, #184 of 729 statewide, top 25%, 429 students, 14% FRL); Westlake High School (math 72% / reading 95%, grade A, #409 of 1,100 statewide, top 39%, 547 students, 19% FRL).
- Market conditions: 17 active listings in the ZIP; 1 comparable units currently listed for rent nearby; 954 units permitted in Westchester County in 2024 (649 in 5+ unit buildings).
Forward outlook
- Local home prices are declining (-3.0%/yr); year-one equity from $6k of loan paydown is wiped out by about $24k of value loss. Plan a longer hold.
- Westchester County population projected at +10% by 2050 — modest demand growth; plan on rents tracking national, not racing it.
- At projected returns (-3.0% appreciation + 3.0% rent growth), your $224k cash investment doubles in ~5 years — after that, you're playing with house money.
Negotiation context
- It's been on market 15 days — a 2% lower offer ($788k) is reasonable based on typical stale-listing flexibility.
Risks & watch-outs
- Climate carrying-cost: major wind risk, 27% chance of damaging wind over 30y; extreme-heat days projected 7→15/yr by 2055 (HVAC capex compounding) — expect insurance premiums to compound above CPI over the hold.
Questions for the listing agent
- Built in 1969 — when were the roof, HVAC, electrical panel, plumbing, and water heater last replaced?
- Is there a deadline driving the sale (1031 exchange, divorce, estate, relocation)? That informs how much negotiation room exists.
- Schools are B-rated — typically a magnet for longer-tenancy family renters. What's the average tenant stay here, and is there a school-zone premium baked into asking?
- What's the average days-on-market for RENTAL listings here right now (not sales)? A rising rental-DOM trend means longer vacancies and softer asking-rent achievability than the comps imply.
- What's the recent tenant-quality profile in this submarket — average credit score on applications, eviction rate, late-payment / NSF rate, and stable-employment percentage? A property-management company in the area should have these aggregated.
- How much new for-sale + rental construction is in the pipeline within 1–3 miles? Heavy new supply typically softens prices + rents 12–24 months out; constrained supply supports both.
Investment metrics
- 1% rule
- 1.63% ✓
- Cap rate
- 13.58%
- Cash-on-cash
- 26.03%
- DSCR
- 2.16
- GRM
- 5.1
CMA / ARV
- ARV (on-the-fly)
- $755,904
- Comps found
- 12
Show comp detail 12 sales within ~0.75 mi
| Address | Dist | Beds/Ba | Sqft | Sold | Price | $/sf | Match |
|---|---|---|---|---|---|---|---|
| 231 Sherman Ave | 0.09mi | 4/2.0 | 1,500 (-2%) | 13mo | $665,000 | $443 | 79 |
| 157 Warren Ave | 0.20mi | 3/2.5 (-1) | 1,498 (-2%) | 7mo | $737,500 | $492 | 71 |
| 314 Willis Ave | 0.33mi | 3/1.5 (-1) | 1,518 (-0%) | 20mo | $771,000 | $508 | 60 |
| 233 Brady Ave | 0.38mi | 3/1.5 (-1) | 1,650 (+8%) | 6mo | $630,000 | $382 | 56 |
| 434 Sherman Ave | 0.60mi | 3/1.5 (-1) | 1,500 (-2%) | 11mo | $855,000 | $570 | 53 |
| 158 Marietta Ave | 0.25mi | 3/2.0 (-1) | 1,349 (-12%) | 10mo | $765,000 | $567 | 52 |
| 350 Commerce St | 0.52mi | 3/1.5 (-1) | 1,673 (+10%) | 3mo | $830,000 | $496 | 50 |
| 54 Liberty St | 0.65mi | 3/2.5 (-1) | 1,504 (-1%) | 12mo | $725,000 | $482 | 46 |
| 235 Myrtle Ave | 0.30mi | 3/1.5 (-1) | 1,315 (-14%) | 14mo | $710,121 | $540 | 44 |
| 410 Sherman Ave | 0.60mi | 3/1.5 (-1) | 1,300 (-15%) | 11mo | $800,000 | $615 | 31 |
| 280 Brighton Ave | 0.74mi | 3/1.0 (-1) | 1,680 (+10%) | 17mo | $650,000 | $387 | 29 |
| 51 Cleveland Pl | 0.71mi | 3/2.5 (-1) | 1,608 (+6%) | 21mo | $755,000 | $470 | 29 |
Match score weights: distance 35% · size 25% · config 20% · recency 20%. Top-matched comps best support the ARV.
Projected returns pro-forma
-3.0% appreciation · 3.0% rent growth · sell at horizon
- IRR
- 19.8%
- Equity multiple
- 1.80×
- Total profit
- $179,993
- Equity at exit
- $119,268
- IRR
- 28.0%
- Equity multiple
- 3.48×
- Total profit
- $555,752
- Equity at exit
- $69,161
Cash invested: $223,972 (down + closing). Projections, not guarantees.
Landlord ↔ Tenant lean methodology
- Overall (STATE)
- 15 Strongly Tenant-Friendly
- State New York
- 15 Strongly Tenant-Friendly · D+10
- County
- — inherits STATE
- City
- — inherits STATE
ZIP-level market 10532
- Home prices YoY
- -25.9%
- Active inventory
- 17
- Price-to-rent
- 5.1×
Monthly cashflow live
- Estimated rent
- $12,999 medium interval (Pro) →
- Mortgage (P&I)
- −$4,195
- Tax from tax record
- −$882 /mo · $10,583/yr
- Insurance
- −$333
- HOA
- −$0
- Vacancy / Maint / Mgmt
- −$2,730
- Net cashflow
- $4,859
Break-even live
UW: 25.0% down · 7.5% · 30yr · 1.5% tax · 5.0% vac · 8.0% maint · 8.0% mgmt
Financing live
Cash to close
- Down payment
- $199,975
- Closing costs
- $23,997
- Reserves months
- —
- Total cash needed
- —
Loan-product check · same deal, 3 products live
Conventional
25% down · 7.5% · 30yr
- Down + closing
- —
- Monthly P&I
- —
- Monthly cashflow
- —
- DSCR
- —
- Eligible?
- —
Personal DTI + credit; lowest rate.
DSCR
20% down · 8.5% · 30yr
- Down + closing
- —
- Monthly P&I
- —
- Monthly cashflow
- —
- DSCR
- —
- Eligible?
- —
No personal income docs; deal must DSCR.
Hard money
10% down · 12.0% · 12mo
- Down + closing
- —
- Monthly P&I
- —
- Monthly cashflow
- —
- DSCR
- —
- Eligible?
- —
Short-term bridge; refi at stabilization.
Rent comps 1 comps
| Address | Beds | Baths | Sqft | Rent | $/sqft | DOM | Units | Dist |
|---|---|---|---|---|---|---|---|---|
| 10 Foxwood Ln Thornwood, NY | 4.0 | 3.5 | 2026 | $12,999 | $6.42 | 43d | 1 | 1.38mi |
Listing history 10 events
-
2026-06-18days on market $799,900 Active 15 DOM
-
2026-06-17days on market $799,900 Active 14 DOM
-
2026-06-16days on market $799,900 Active 13 DOM
-
2026-06-15days on market $799,900 Active 12 DOM
-
2026-06-13days on market $799,900 Active 10 DOM
-
2026-06-09days on market $799,900 Active 6 DOM
-
2026-06-08days on market $799,900 Active 5 DOM
-
2026-06-07days on market $799,900 Active 4 DOM
-
2026-06-03remarks 699-char remark
-
2026-06-03$799,900 Active 1 DOM
ⓘ Source: listings_history table (triggers on properties + properties_extension) + one-shot
backfill from property_details.listing_events for pre-trigger history.
Tax reassessment forecast NY · Partial reset (capped growth)
- Current annual tax
- $10,583 · $882/mo
- Projected year-2 tax
- $12,051 · $1,004/mo
- Expected delta
- +$1,468/yr (+$122/mo · 13.9%)
ⓘ Screening estimate from a state-policy table — verify with the county assessor before closing.
Climate risk First Street
- Flood 1/10 Low FEMA zone X (unshaded) · 0% chance over 30 yrs
- Wildfire 1/10 Low
- Heat 5/10 Major 7 d/yr ≥98°F today · 15 d/yr by 30 yrs out
- Wind 6/10 Major 27% chance of damaging wind over 30 yrs
- Air quality 4/10 Moderate 4 unhealthy d/yr today · 6 by 30 yrs out
Nearby sold comps map
Loading sold comps map…
Walkable amenities ~0.75 mi
Loading nearby amenities…
Taxation est. · year 1
- Rental income
- $155,988
- − Mortgage interest
- −$44,807
- − Property taxes
- −$10,583
- − Insurance
- −$4,000
- − Repairs & maintenance
- −$12,479
- − Management
- −$12,479
- − Depreciation
- −$23,270
- Taxable income
- $48,371
- Est. tax owed @ 24.0%
- −$11,609
- After-tax cash flow
- $46,702/yr
For passive investors: Depreciation is non-cash, so a rental often shows a tax loss while cash-flowing — sheltering income. Rental losses are passive: they offset passive income freely, and up to $25,000/yr can offset ordinary (W-2) income if you actively participate and your MAGI is under $100k (phasing out to $0 by $150k); unused losses carry forward. On sale, claimed depreciation is recaptured at up to 25%, and gains may owe capital-gains tax (a 1031 exchange can defer both). Figures are a year-1 estimate at your 24.0% rate — not tax advice; consult a CPA.
Schools (NCES district)
- District
- Mount Pleasant Central School District
- NCES district ID
- 3620160
- Math proficiency
- 62% ▼ -16.00%
- Reading proficiency
- 65% ▲ 3.00%
- Median HH income
- $109,054
- Composite
- 59.62/100
- National rank
- #911
- State rank
- #146 of 590 in NY
Livability — Hawthorne
- Score
- 71/100
- State rank
- #399
- US rank
- #6922
Category grades
Schools grade is shown separately in the Schools card above.
Census & demographics
- Census place
- Hawthorne, NY
- City population
- 5,253
- Population (ZIP)
- 5,253
Population outlook (Westchester County) Hauer SSP2
- Today (2025)
- 1,028,035 people
- By 2030
- 1,051,636 · +2.3%
- By 2040
- 1,098,520 · +6.9%
- By 2050
- 1,136,044 · +10.5%
- By 2075
- 1,196,925 · +16.4%
- By 2100
- 1,175,147 · +14.3%
Race, ethnicity, and origin ACS 2023
- Neighborhood character
- Predominantly White (85%)
- Race & ethnicity
- White 85% Hispanic / Latino 9% Asian 4% Two or more races 4%
- Hispanic origin (detail)
- Cuban 2% Dominican 4%
- Common ancestry
- Romanian 5% Italian 4% Scotch-Irish 3%
- Foreign-born
- 14% · Canada, Jamaica, China
- Languages at home
- 79% English-only · Other Indo-European 9% Spanish 6% Russian/Polish/Slavic 3%
Political lean MEDSL · Westchester
- 2024 margin
- Strong D (+26.3) · D 63.1% · R 36.9%
- 2008→2024 swing
- -1.3pp toward R · 2008: 27.6pp · 2024: 26.3pp
- All cycles
- 2024: D+26.3 2020: D+36.3 2016: D+32.8 2012: D+22.2 2008: D+27.6
Not yet ingested
- Civics
- —
Market trends
- HPI YoY
- ▼ -98.61%
- Current HPI
- 281.5765
- Rent YoY
- —
- Metro
- —
- State GDP YoY
- ▲ 2.60%
- F500 in state
- 92
Industry mix (Fortune 500 HQ in NY)
| Industry | F500 HQs | Revenue |
|---|---|---|
| Financial Services | 10 | $950B |
|
||
| Consumer Goods | 9 | $162B |
|
||
| Insurance | 4 | $225B |
|
||
| Telecommunications | 2 | $144B |
|
||
| Pharmaceuticals | 2 | $112B |
|
||
| Media / Entertainment | 2 | $69B |
|
||
Price history
1 event — show timeline
- 2026-06-03 Listed $799,900 OneKey® MLS as Distributed by MLS Grid
Property tax history
-4.2%/yrLatest (2025): $10,583 · -14.5% YoY. Source: county tax records.
Cash-flow waterfall
monthlySold comps — $/sqft
last 12 mo · ≤1 miLoading sold comps…