2835 Baltimore Ave · Indianapolis city (balance), IN
Flood risk 6/10 · Moderate
- FEMA flood zone
- X (unshaded)
- Chance of flooding over 30 yrs
- 0.74%
- Est. flood insurance / yr
- $507 – $1,088
Fire risk 1/10 · Minimal
- Est. fire insurance / yr
- $717 – $1,331
Heat risk 4/10 · Minor
- Hot days now (above 102°F)
- 7 days/yr
- Hot days in 30 yrs
- 19 days/yr
Wind risk 2/10 · Minimal
- Chance of severe wind over 30 yrs
- 0.0%
Air-quality risk 4/10 · Minor
- Unhealthy air days now
- 5 days/yr
- Unhealthy air days in 30 yrs
- 7 days/yr
Risk factors via First Street. Map © Google.
Why this score? — see what drove the B- grade
The composite is a weighted blend of 9 inputs, each scored 0–100. Each bar is that input's sub-score; the figure is the points it added to the 100-point composite (weight × sub-score).
- Cash flow +27.2/30.0
- ARV discount +13.3/15.0
- DSCR +9.4/10.0
- 1% rule +8.1/10.0
- Rent growth +2.7/5.0
- Livability +2.5/5.0
- Condition / age +2.5/5.0
- Schools +1.4/10.0
- Appreciation +0.0/10.0
$114,900
🖨 Deal sheet 📄 Offer letter ✓ Due diligence
Listing remarks MLS
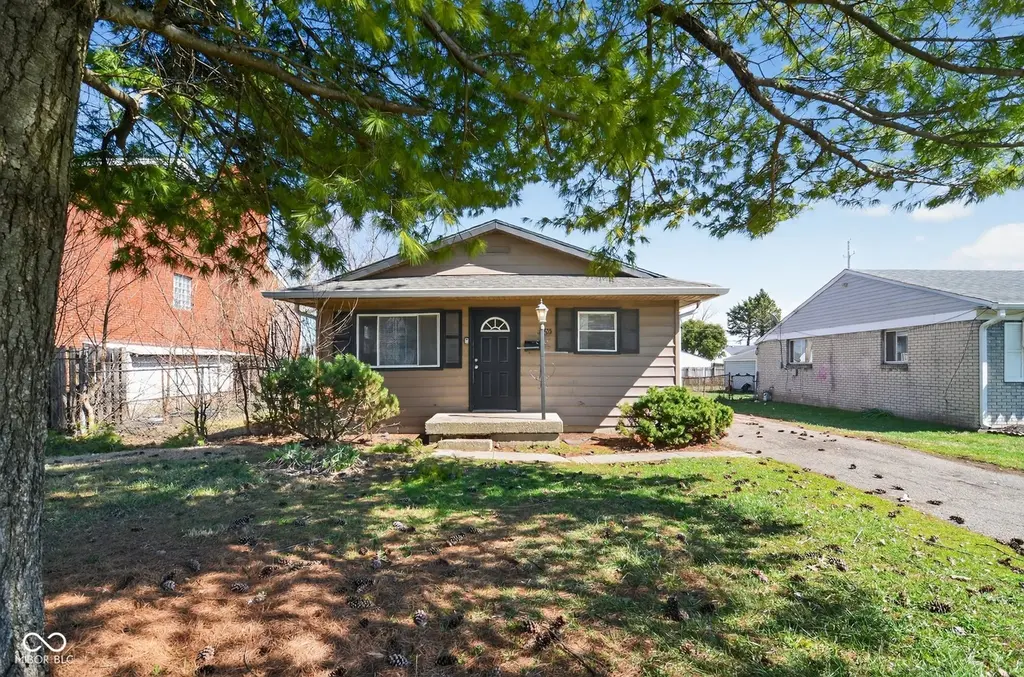
Situated at 2835 Baltimore AVE in INDIANAPOLIS, IN, USA, this single family residence, constructed in 1970, stands as an inviting home, thoroughly ready for new occupants. The interior of this residence, encompassing 1104 square feet of comfortable living area, offers a canvas for creating cherished moments within its walls. Four well-proportioned bedrooms provide adaptable spaces, fulfilling a variety of requirements for rest and personal endeavors. A single full bathroom provides essential functionality and a private space for daily routines. Stepping outside, one discovers a welcoming porch, perfect for enjoying peaceful mornings or quiet evenings. Further enhancing the outdoor appeal, a dedicated patio provides an expansive area for relaxation and enjoyment under the open sky. The property is gracefully set upon a substantial 7231 square feet lot area, offering considerable room for outdoor activities and personal landscaping visions. This single family residence, built in 1970, is thoughtfully designed with 1.0 stories, ensuring accessible living. This delightful property presents a harmonious blend of indoor comfort and outdoor expanse, awaiting its next chapter of joyful living.
Key facts
- Substantial lot area
- Dedicated patio
- Welcoming porch
Tags
Neighborhood map
What this means for you Summary
Snapshot
- This is a 4-bed/1.0-bath single-family listed at $115k.
Deal economics
- At list price, monthly cash flow is $328 ($4k/yr) — positive.
- The deal already cash-flows at list — no discount required.
- Meets the 1% rule at list price ($2k rent vs $115k).
- Recommended offer: $108k (6.0% below list) — sets the bar for market timing.
- Cap rate 9.7% vs local median 4.4% in Indianapolis city (balance) — top-decile yield for the area; either an underpriced asset or a hidden risk that comps aren't pricing in. Stress-test before assuming the spread holds.
Location & tenants
- Location reads: area grade B — affects rentability + tenant quality, not the cash-flow math above.
- Indianapolis Public Schools (urban): math 14% / reading 20% proficiency, ranked #286 of 301 in IN (top 95%) — low school quality limits family demand, transient renter base, plan for 1-2y turnover; 77% free/reduced lunch — lower-income household profile, screen leases tightly.
- Market conditions: Rents flat; 334 active listings in the ZIP; 40 comparable units currently listed for rent nearby; rentals at typical pace (median 24d on market — plan ~3-4 weeks tenant-placement turnaround); lower-income renter base — watch delinquency; 1,906 units permitted in Marion County in 2024 (621 in 5+ unit buildings).
- At $1,511/mo this rent would consume 48% of the median local household income ($38k/yr) (locally 2340% of renters already pay >50% of income on rent) — very limited rent-growth headroom before tenants either downsize or default.
Forward outlook
- Local home prices are declining (-3.0%/yr); year-one equity from $794 of loan paydown is wiped out by about $3k of value loss. Plan a longer hold.
- Marion County population projected at +18% by 2050 — long-run rental-demand tailwind backs the buy-and-hold thesis.
Negotiation context
- It's been on market 76 days — a 6% lower offer ($108k) is reasonable based on typical stale-listing flexibility.
- 6 sale attempts since 23y ago; this cycle's ask has dropped $15k (12%) from the opening price — seller is motivated, your offer sets the floor, not the list.
- Current owner paid $96k; 20% above their basis — modest negotiation headroom, anchor on the comps not their cost.
Risks & watch-outs
- Climate carrying-cost: major flood risk — expect insurance premiums to compound above CPI over the hold.
Questions for the listing agent
- It's been on market 76 days. Have you received any prior offers? Is the seller open to a 6% concession, seller financing, or rate buy-down credit?
- Built in 1970 — when were the roof, HVAC, electrical panel, plumbing, and water heater last replaced?
- Why hasn't it sold? Are there any deal-killer items the seller is aware of (foundation, flood, title, zoning, code violations)?
- Is there a deadline driving the sale (1031 exchange, divorce, estate, relocation)? That informs how much negotiation room exists.
- What's the average days-on-market for RENTAL listings here right now (not sales)? A rising rental-DOM trend means longer vacancies and softer asking-rent achievability than the comps imply.
- What's the recent tenant-quality profile in this submarket — average credit score on applications, eviction rate, late-payment / NSF rate, and stable-employment percentage? A property-management company in the area should have these aggregated.
- How much new for-sale + rental construction is in the pipeline within 1–3 miles? Heavy new supply typically softens prices + rents 12–24 months out; constrained supply supports both.
Investment metrics
- 1% rule
- 1.31% ✓
- Cap rate
- 9.71%
- Cash-on-cash
- 12.22%
- DSCR
- 1.54
- GRM
- 6.3
CMA / ARV
- ARV (median comp)
- $131,745
- List price
- $114,900
- Delta
- -12.79%
- Verdict
- UNDERPRICED
- Comps
- 20 within 1.0 mi
Show comp detail 12 sales within ~0.75 mi
| Address | Dist | Beds/Ba | Sqft | Sold | Price | $/sf | Match |
|---|---|---|---|---|---|---|---|
| 2848 Schofield Ave | 0.22mi | 3/1.0 (-1) | 1,102 (-0%) | 2mo | $72,000 | $65 | 83 |
| 2753 Sangster Ave | 0.16mi | 3/1.0 (-1) | 1,088 (-1%) | 3mo | $162,000 | $149 | 83 |
| 2931 Sangster Ave | 0.19mi | 3/1.0 (-1) | 1,064 (-4%) | 6mo | $117,000 | $110 | 75 |
| 2808 Sangster Ave | 0.16mi | 3/1.0 (-1) | 1,028 (-7%) | 3mo | $100,000 | $97 | 73 |
| 2738 Schofield Ave | 0.25mi | 4/1.0 | 1,205 (+9%) | 2mo | $170,000 | $141 | 72 |
| 2929 Manlove Ave | 0.13mi | 3/1.0 (-1) | 960 (-13%) | 2mo | $139,000 | $145 | 65 |
| 2358 Hovey St | 0.58mi | 4/1.0 | 1,152 (+4%) | 3mo | $151,000 | $131 | 64 |
| 2740 N Rural St | 0.50mi | 3/2.0 (-1) | 1,082 (-2%) | 2mo | $195,000 | $180 | 63 |
| 2601 Manlove Ave | 0.24mi | 3/1.0 (-1) | 972 (-12%) | 1mo | $174,900 | $180 | 63 |
| 2951 Hillside Ave | 0.20mi | 3/2.0 (-1) | 980 (-11%) | 3mo | $156,000 | $159 | 61 |
| 3263 Schofield Ave | 0.51mi | 3/1.0 (-1) | 1,194 (+8%) | 2mo | $73,600 | $62 | 56 |
| 2620 Manlove Ave | 0.23mi | 3/2.0 (-1) | 1,232 (+12%) | 8mo | $163,000 | $132 | 55 |
Match score weights: distance 35% · size 25% · config 20% · recency 20%. Top-matched comps best support the ARV.
Projected returns pro-forma
-3.0% appreciation · 0.81% rent growth · sell at horizon
- IRR
- -0.8%
- Equity multiple
- 0.97×
- Total profit
- $-942
- Equity at exit
- $17,132
- IRR
- 6.3%
- Equity multiple
- 1.42×
- Total profit
- $13,530
- Equity at exit
- $9,934
Cash invested: $32,172 (down + closing). Projections, not guarantees.
Landlord ↔ Tenant lean methodology
- Overall (STATE)
- 90 Strongly Landlord-Friendly
- State Indiana
- 90 Strongly Landlord-Friendly · R+11
- County
- — inherits STATE
- City
- — inherits STATE
ZIP-level market 46218
- Home prices YoY
- -17.1%
- Rents YoY
- 0.8%
- Active inventory
- 334
- Price-to-rent
- 6.3×
Monthly cashflow live
- Estimated rent
- $1,511 high interval (Pro) →
- Mortgage (P&I)
- −$603
- Tax from tax record
- −$215 /mo · $2,583/yr
- Insurance
- −$48
- HOA
- −$0
- Vacancy / Maint / Mgmt
- −$317
- Net cashflow
- $328
Break-even live
UW: 25.0% down · 7.5% · 30yr · 1.5% tax · 5.0% vac · 8.0% maint · 8.0% mgmt
Financing live
Cash to close
- Down payment
- $28,725
- Closing costs
- $3,447
- Reserves months
- —
- Total cash needed
- —
Loan-product check · same deal, 3 products live
Conventional
25% down · 7.5% · 30yr
- Down + closing
- —
- Monthly P&I
- —
- Monthly cashflow
- —
- DSCR
- —
- Eligible?
- —
Personal DTI + credit; lowest rate.
DSCR
20% down · 8.5% · 30yr
- Down + closing
- —
- Monthly P&I
- —
- Monthly cashflow
- —
- DSCR
- —
- Eligible?
- —
No personal income docs; deal must DSCR.
Hard money
10% down · 12.0% · 12mo
- Down + closing
- —
- Monthly P&I
- —
- Monthly cashflow
- —
- DSCR
- —
- Eligible?
- —
Short-term bridge; refi at stabilization.
Rent comps 40 comps
| Address | Beds | Baths | Sqft | Rent | $/sqft | DOM | Units | Dist |
|---|---|---|---|---|---|---|---|---|
| 2820 Caroline Ave Indianapolis, IN | 3.0 | 1.5 | 1112 | $1,250 | $1.12 | 24d | 1 | 0.04mi |
| 2616 Caroline Ave Indianapolis, IN | 4.0 | 1.0 | 1276 | $1,300 | $1.02 | 44d | 1 | 0.22mi |
| 3121 Baltimore Ave Indianapolis, IN | 3.0 | 1.0 | 1232 | $7,865 | $6.38 | 7d | 1 | 0.38mi |
| 2372 Beckwith Dr Indianapolis, IN | 4.0 | 1.0–1.5 | 779 | $1,349 | $1.73 | 2d | 32 | 0.46mi |
| 3207 N Arsenal Ave Indianapolis, IN | 3.0 | 1.0 | 994 | $1,195 | $1.20 | 24d | 1 | 0.56mi |
| 2757 Columbia Ave Unit 2757-B Indianapolis, IN | 3.0 | 2.0 | 1350 | $1,525 | $1.13 | 44d | 1 | 0.57mi |
| 2553 Columbia Ave Unit 2553-B Indianapolis, IN | 3.0 | 2.0 | 1350 | $1,525 | $1.13 | 44d | 1 | 0.60mi |
| 2549 Columbia Ave Unit 1332865P Indianapolis, IN | 3.0 | 2.0 | 893 | $2,274 | $2.55 | 2d | 1 | 0.61mi |
| 2950 Winthrop Ave Indianapolis, IN | 3.0 | 2.0 | 1224 | $1,449 | $1.18 | 44d | 1 | 0.77mi |
| 2340 Columbia Ave Unit 2340-B Indianapolis, IN | 3.0 | 2.0 | 1350 | $1,650 | $1.22 | 44d | 1 | 0.78mi |
| 2203 Sheldon St Unit B Indianapolis, IN | 3.0 | 2.0 | 1350 | $1,500 | $1.11 | 44d | 1 | 0.78mi |
| 2906 N Lasalle St Indianapolis, IN | 4.0 | 1.0 | 1032 | $950 | $0.92 | 24d | 1 | 0.79mi |
| 3139 Guilford Ave Indianapolis, IN | 3.0 | 1.0 | 1068 | $1,345 | $1.26 | 44d | 1 | 0.79mi |
| 2920 N Lasalle St Indianapolis, IN | 3.0 | 1.0 | 875 | $1,095 | $1.25 | 18d | 1 | 0.79mi |
| 3448 Hillside Ave Indianapolis, IN | 4.0 | 1.0 | 1305 | $1,800 | $1.38 | 2d | 1 | 0.81mi |
| 3110 Guilford Ave Indianapolis, IN | 3.0 | 1.5 | 1250 | $1,295 | $1.04 | 24d | 1 | 0.81mi |
| 2751 Guilford Ave Unit B Indianapolis, IN | 3.0 | 2.0 | 1250 | $1,750 | $1.40 | 14d | 1 | 0.83mi |
| 2751 Guilford Ave Unit Aunit Indianapolis, IN | 3.0 | 2.0 | 1250 | $1,750 | $1.40 | 44d | 1 | 0.83mi |
| 2711 Guilford Ave Indianapolis, IN | 3.0 | 2.0 | 1250 | $1,695 | $1.36 | 24d | 1 | 0.85mi |
| 1902 E 35th St Indianapolis, IN | 3.0 | 1.0 | 1100 | $1,600 | $1.45 | 44d | 1 | 0.85mi |
| 2827 Adams St Indianapolis, IN | 3.0 | 2.0 | 1200 | $1,512 | $1.26 | 2d | 1 | 0.87mi |
| 3532 Caroline Ave Indianapolis, IN | 4.0 | 1.0 | 1177 | $2,299 | $1.95 | 44d | 1 | 0.89mi |
| 2410 Adams St Indianapolis, IN | 3.0 | 1.0 | 900 | $1,200 | $1.33 | 10d | 1 | 0.96mi |
| 2707 N College Ave Indianapolis, IN | 3.0 | 2.0 | 1500 | $2,200 | $1.47 | 18d | 1 | 0.99mi |
| 2709 N College Ave Indianapolis, IN | 3.0 | 2.0 | 1500 | $2,200 | $1.47 | 24d | 1 | 1.00mi |
| 3449 E 26th St Indianapolis, IN | 3.0 | 2.0 | 1200 | $1,512 | $1.26 | 2d | 1 | 1.00mi |
| 3451 E 26th St Indianapolis, IN | 3.0 | 2.0 | 1200 | $1,650 | $1.38 | 44d | 1 | 1.00mi |
| 2519 N College Ave Unit 1 Indianapolis, IN | 3.0 | 2.5 | 1416 | $1,850 | $1.31 | 44d | 1 | 1.02mi |
| 3106 N College Ave Indianapolis, IN | 3.0 | 1.5 | 1400 | $1,700 | $1.21 | 7d | 1 | 1.07mi |
| 3535 N Oxford St Indianapolis, IN | 3.0 | 1.0 | 1015 | $1,500 | $1.48 | 22d | 1 | 1.08mi |
| 2161 Bellefontaine St Indianapolis, IN | 4.0 | 2.5 | 1346 | $1,900 | $1.41 | 22d | 1 | 1.08mi |
| 3476 Birchwood Ave Indianapolis, IN | 3.0 | 1.5 | 1420 | $1,625 | $1.14 | 24d | 1 | 1.11mi |
| 2045 N Dearborn St Indianapolis, IN | 3.0 | 2.0 | 912 | $1,145 | $1.26 | 24d | 1 | 1.15mi |
| 2826 Station St Indianapolis, IN | 3.0 | 2.0 | 1248 | $1,550 | $1.24 | 44d | 1 | 1.15mi |
| 2960 N Park Ave Indianapolis, IN | 3.0 | 2.0 | 1400 | $1,595 | $1.14 | 44d | 1 | 1.15mi |
| 2960 N Park Ave Indianapolis, IN | 3.0 | 1.5 | 1400 | $1,550 | $1.11 | 24d | 1 | 1.15mi |
| 2958 N Park Ave Unit 2958 Indianapolis, IN | 3.0 | 1.5 | 1350 | $1,450 | $1.07 | 3d | 1 | 1.16mi |
| 2168 Carrollton Ave Indianapolis, IN | 3.0 | 1.5 | 1300 | $1,799 | $1.38 | 3d | 1 | 1.17mi |
| 728 E 34th St Indianapolis, IN | 3.0 | 1.0 | 1491 | $1,400 | $0.94 | 4d | 1 | 1.17mi |
| 728 E 34th St Indianapolis, IN | 3.0 | 1.0 | 1491 | $1,400 | $0.94 | 20d | 1 | 1.17mi |
Listing history 29 events
-
2026-06-18days on market $114,900 Active 76 DOM
-
2026-06-17days on market $114,900 Active 75 DOM
-
2026-06-16days on market $114,900 Active 74 DOM
-
2026-06-15days on market $114,900 Active 73 DOM
-
2026-06-13days on market $114,900 Active 71 DOM
-
2026-06-13days on market $114,900 Active 70 DOM
-
2026-06-09days on market $114,900 Active 67 DOM
-
2026-06-08days on market $114,900 Active 66 DOM
-
2026-06-07days on market $114,900 Active 65 DOM
-
2026-06-03days on market $114,900 Active 61 DOM
-
2026-06-02days on market $114,900 Active 60 DOM
-
2026-06-01days on market $114,900 Active 59 DOM
-
2026-05-31price $114,900 Active 58 DOM
-
2026-05-31days on market $124,900 Active 58 DOM
-
2026-05-15price $124,900 1207-char remark
Show marketing remark (1207 chars)
Situated at 2835 Baltimore AVE in INDIANAPOLIS, IN, USA, this single family residence, constructed in 1970, stands as an inviting home, thoroughly ready for new occupants. The interior of this residence, encompassing 1104 square feet of comfortable living area, offers a canvas for creating cherished moments within its walls. Four well-proportioned bedrooms provide adaptable spaces, fulfilling a variety of requirements for rest and personal endeavors. A single full bathroom provides essential functionality and a private space for daily routines. Stepping outside, one discovers a welcoming porch, perfect for enjoying peaceful mornings or quiet evenings. Further enhancing the outdoor appeal, a dedicated patio provides an expansive area for relaxation and enjoyment under the open sky. The property is gracefully set upon a substantial 7231 square feet lot area, offering considerable room for outdoor activities and personal landscaping visions. This single family residence, built in 1970, is thoughtfully designed with 1.0 stories, ensuring accessible living. This delightful property presents a harmonious blend of indoor comfort and outdoor expanse, awaiting its next chapter of joyful living.
-
2026-04-03$129,900 Active 1207-char remark
Show marketing remark (1207 chars)
Situated at 2835 Baltimore AVE in INDIANAPOLIS, IN, USA, this single family residence, constructed in 1970, stands as an inviting home, thoroughly ready for new occupants. The interior of this residence, encompassing 1104 square feet of comfortable living area, offers a canvas for creating cherished moments within its walls. Four well-proportioned bedrooms provide adaptable spaces, fulfilling a variety of requirements for rest and personal endeavors. A single full bathroom provides essential functionality and a private space for daily routines. Stepping outside, one discovers a welcoming porch, perfect for enjoying peaceful mornings or quiet evenings. Further enhancing the outdoor appeal, a dedicated patio provides an expansive area for relaxation and enjoyment under the open sky. The property is gracefully set upon a substantial 7231 square feet lot area, offering considerable room for outdoor activities and personal landscaping visions. This single family residence, built in 1970, is thoughtfully designed with 1.0 stories, ensuring accessible living. This delightful property presents a harmonious blend of indoor comfort and outdoor expanse, awaiting its next chapter of joyful living.
-
2022-11-09soldstatus $96,000
-
2022-11-02soldstatus $96,000 Closed 337-char remark
Show marketing remark (337 chars)
GREAT SPACIOUS STARTER HOME WITH ALMOST 1200 SQUARE FOOTAGE, 4 BEDROOMS AND ONE FULL BATH SELLING "AS IS'/HARDWOOD FLOORS ARE IN SOME OF THE BEDROOMS/LARGE EAT-IN KITCHEN/TLC NEEDED WITH NEWER UPDATES/SMALL STORAGE ROOM ATTACHED IN THE REAR OF HOME/DRIVE-WAY ON SOUTH SIDE OF HOME/CHURCH PROPERTY AND GREAT NEIGHBORS TO THE NORTH///
-
2022-04-20status Pending 337-char remark
Show marketing remark (337 chars)
GREAT SPACIOUS STARTER HOME WITH ALMOST 1200 SQUARE FOOTAGE, 4 BEDROOMS AND ONE FULL BATH SELLING "AS IS'/HARDWOOD FLOORS ARE IN SOME OF THE BEDROOMS/LARGE EAT-IN KITCHEN/TLC NEEDED WITH NEWER UPDATES/SMALL STORAGE ROOM ATTACHED IN THE REAR OF HOME/DRIVE-WAY ON SOUTH SIDE OF HOME/CHURCH PROPERTY AND GREAT NEIGHBORS TO THE NORTH///
-
2022-04-06price $95,500 337-char remark
Show marketing remark (337 chars)
GREAT SPACIOUS STARTER HOME WITH ALMOST 1200 SQUARE FOOTAGE, 4 BEDROOMS AND ONE FULL BATH SELLING "AS IS'/HARDWOOD FLOORS ARE IN SOME OF THE BEDROOMS/LARGE EAT-IN KITCHEN/TLC NEEDED WITH NEWER UPDATES/SMALL STORAGE ROOM ATTACHED IN THE REAR OF HOME/DRIVE-WAY ON SOUTH SIDE OF HOME/CHURCH PROPERTY AND GREAT NEIGHBORS TO THE NORTH///
-
2022-04-05status Active 337-char remark
Show marketing remark (337 chars)
GREAT SPACIOUS STARTER HOME WITH ALMOST 1200 SQUARE FOOTAGE, 4 BEDROOMS AND ONE FULL BATH SELLING "AS IS'/HARDWOOD FLOORS ARE IN SOME OF THE BEDROOMS/LARGE EAT-IN KITCHEN/TLC NEEDED WITH NEWER UPDATES/SMALL STORAGE ROOM ATTACHED IN THE REAR OF HOME/DRIVE-WAY ON SOUTH SIDE OF HOME/CHURCH PROPERTY AND GREAT NEIGHBORS TO THE NORTH///
-
2021-11-07historical 337-char remark
Show marketing remark (337 chars)
GREAT SPACIOUS STARTER HOME WITH ALMOST 1200 SQUARE FOOTAGE, 4 BEDROOMS AND ONE FULL BATH SELLING "AS IS'/HARDWOOD FLOORS ARE IN SOME OF THE BEDROOMS/LARGE EAT-IN KITCHEN/TLC NEEDED WITH NEWER UPDATES/SMALL STORAGE ROOM ATTACHED IN THE REAR OF HOME/DRIVE-WAY ON SOUTH SIDE OF HOME/CHURCH PROPERTY AND GREAT NEIGHBORS TO THE NORTH///
-
2021-11-03$88,800 Active 337-char remark
Show marketing remark (337 chars)
GREAT SPACIOUS STARTER HOME WITH ALMOST 1200 SQUARE FOOTAGE, 4 BEDROOMS AND ONE FULL BATH SELLING "AS IS'/HARDWOOD FLOORS ARE IN SOME OF THE BEDROOMS/LARGE EAT-IN KITCHEN/TLC NEEDED WITH NEWER UPDATES/SMALL STORAGE ROOM ATTACHED IN THE REAR OF HOME/DRIVE-WAY ON SOUTH SIDE OF HOME/CHURCH PROPERTY AND GREAT NEIGHBORS TO THE NORTH///
-
2007-06-14soldstatus $25,000
-
2007-01-21$23,900
-
2006-08-09historical
-
2006-04-14$65,000
-
2004-02-05soldstatus $22,500
-
2003-12-29$24,900
ⓘ Source: listings_history table (triggers on properties + properties_extension) + one-shot
backfill from property_details.listing_events for pre-trigger history.
Tax reassessment forecast IN · Partial reset (capped growth)
- Current annual tax
- $2,583 · $215/mo
- Projected year-2 tax
- $2,583 · $215/mo
- Expected delta
- $0/yr ($0/mo · 0.0%)
ⓘ Screening estimate from a state-policy table — verify with the county assessor before closing.
Climate risk First Street
- Flood 6/10 Major FEMA zone X (unshaded) · 74% chance over 30 yrs
- Wildfire 1/10 Low
- Heat 4/10 Moderate 7 d/yr ≥102°F today · 19 d/yr by 30 yrs out
- Wind 2/10 Low 0% chance of damaging wind over 30 yrs
- Air quality 4/10 Moderate 5 unhealthy d/yr today · 7 by 30 yrs out
Nearby sold comps map
Loading sold comps map…
Walkable amenities ~0.75 mi
Loading nearby amenities…
Taxation est. · year 1
- Rental income
- $18,126
- − Mortgage interest
- −$6,436
- − Property taxes
- −$2,583
- − Insurance
- −$574
- − Repairs & maintenance
- −$1,450
- − Management
- −$1,450
- − Depreciation
- −$3,343
- Taxable income
- $2,290
- Est. tax owed @ 24.0%
- −$550
- After-tax cash flow
- $3,382/yr
For passive investors: Depreciation is non-cash, so a rental often shows a tax loss while cash-flowing — sheltering income. Rental losses are passive: they offset passive income freely, and up to $25,000/yr can offset ordinary (W-2) income if you actively participate and your MAGI is under $100k (phasing out to $0 by $150k); unused losses carry forward. On sale, claimed depreciation is recaptured at up to 25%, and gains may owe capital-gains tax (a 1031 exchange can defer both). Figures are a year-1 estimate at your 24.0% rate — not tax advice; consult a CPA.
Schools (NCES district)
- District
- Indianapolis Public Schools
- NCES district ID
- 1804770
- Math proficiency
- 14% ▼ -7.00%
- Reading proficiency
- 20% ▼ -3.00%
- Median HH income
- $32,034
- Composite
- 13.69/100
- National rank
- #9499
- State rank
- #286 of 301 in IN
Livability — Indianapolis city (balance)
No livability data for this city. (Only ~50 U.S. cities are tracked.)
Census & demographics
- Census place
- Indianapolis city (balance), IN
- County
- Marion County · 998,460 people
- City population
- 881,119
- Metro
- Indianapolis-Carmel-Anderson, IN
- Population (ZIP)
- 29,360
- Household income
- $38,063
- Rent vs Own
- Severe rent burden
- 2340.0
Population outlook (Marion County) Hauer SSP2
- Today (2025)
- 1,025,572 people
- By 2030
- 1,065,727 · +3.9%
- By 2040
- 1,141,577 · +11.3%
- By 2050
- 1,208,920 · +17.9%
- By 2075
- 1,367,288 · +33.3%
- By 2100
- 1,438,201 · +40.2%
Race, ethnicity, and origin ACS 2023
- Neighborhood character
- Predominantly Black (68%)
- Race & ethnicity
- Black 68% White 18% Hispanic / Latino 9% Two or more races 6%
- Hispanic origin (detail)
- Mexican 6%
- Common ancestry
- Romanian 1%
- Foreign-born
- 5% · Canada, Philippines
- Languages at home
- 92% English-only · Spanish 7%
Political lean MEDSL · Marion
- 2024 margin
- Strong D (+27.7) · D 63.0% · R 35.3% · Other 1.7%
- 2008→2024 swing
- -0.7pp no change · 2008: 28.4pp · 2024: 27.7pp
- All cycles
- 2024: D+27.7 2020: D+29.1 2016: D+22.8 2012: D+22.2 2008: D+28.4
Not yet ingested
- Civics
- —
Market trends
- HPI YoY
- ▼ -81.57%
- Current HPI
- 395.7071
- Rent YoY
- ▲ 0.81%
- Metro
- Indianapolis-Carmel-Anderson, IN
- State GDP YoY
- ▲ 2.90%
- F500 in state
- 18
Industry mix (Fortune 500 HQ in IN)
| Industry | F500 HQs | Revenue |
|---|---|---|
| Industrial Machinery | 2 | $37B |
|
||
| Healthcare | 1 | $177B |
|
||
| Pharmaceuticals | 1 | $45B |
|
||
| Metals / Steel | 1 | $18B |
|
||
| Agriculture | 1 | $17B |
|
||
| Packaging | 1 | $12B |
|
||
Price history
+401.6% since first listed15 events — show timeline
- 2026-05-15 Price Changed $124,900 MIBOR as Distributed by MLS Grid
- 2026-04-03 Listed $129,900 MIBOR as Distributed by MLS Grid
- 2022-11-09 Sold (Public Records) $96,000 Public Records
- 2022-11-02 Sold (MLS) $96,000 MIBOR as Distributed by MLS Grid
- 2022-04-20 Pending — MIBOR as Distributed by MLS Grid
- 2022-04-06 Price Changed $95,500 MIBOR as Distributed by MLS Grid
- 2022-04-05 Relisted — MIBOR as Distributed by MLS Grid
- 2021-11-07 Listing Removed — MIBOR as Distributed by MLS Grid
- 2021-11-03 Listed $88,800 MIBOR as Distributed by MLS Grid
- 2007-06-14 Sold (MLS) $25,000 MIBOR as Distributed by MLS Grid
- 2007-01-21 Listed $23,900 MIBOR as Distributed by MLS Grid
- 2006-08-09 Listing Removed — MIBOR as Distributed by MLS Grid
- 2006-04-14 Listed $65,000 MIBOR as Distributed by MLS Grid
- 2004-02-05 Sold (MLS) $22,500 MIBOR as Distributed by MLS Grid
- 2003-12-29 Listed $24,900 MIBOR as Distributed by MLS Grid
Property tax history
+28.3%/yrLatest (2025): $2,583 · +23.0% YoY. Source: county tax records.
Cash-flow waterfall
monthlySold comps — $/sqft
last 12 mo · ≤1 miLoading sold comps…