 Duplex
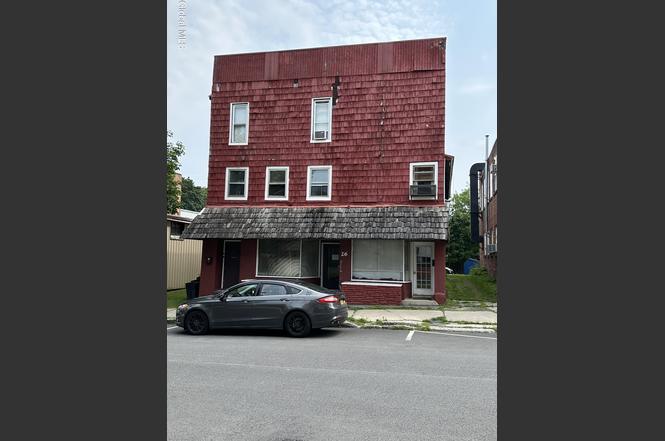
26 N Market St · Johnstown, NY
Flood risk No data
- FEMA flood zone
- —
- Chance of flooding over 30 yrs
- —
- Est. flood insurance / yr
- —
Fire risk No data
- Est. fire insurance / yr
- —
Heat risk No data
- Hot days now (above threshold)
- —
- Hot days in 30 yrs
- —
Wind risk No data
- Chance of severe wind over 30 yrs
- —
Air-quality risk No data
- Unhealthy air days now
- —
- Unhealthy air days in 30 yrs
- —
Risk factors via First Street. Map © Google.
Why this score? — see what drove the A- grade
The composite is a weighted blend of 9 inputs, each scored 0–100. Each bar is that input's sub-score; the figure is the points it added to the 100-point composite (weight × sub-score).
- Cash flow +30.0/30.0
- 1% rule +10.0/10.0
- DSCR +10.0/10.0
- Appreciation +10.0/10.0
- ARV discount +8.7/15.0
- Livability +3.9/5.0
- Schools +3.5/10.0
- Rent growth +2.5/5.0
- Condition / age +2.5/5.0
$160,900
🖨 Deal sheet 📄 Offer letter ✓ Due diligence
Multi-family units
County records classify this as Multi-Family (5+ Unit). Listing-text estimate: 2 units. estimate disagrees with records
5+ unit building — per-unit beds/baths from public records are typically unavailable; the breakdown below (if shown) is an estimate from the listing text.
Listing remarks
This multi-family property presents an exciting opportunity for investors or owner-occupants seeking versatility and income potential. Featuring five bedrooms and three full bathrooms and two half bathrooms across 6,120 square feet, this building combines commercial and residential spaces. The ground floor offers two vacant storefronts. One unit retains salon hookups, while the other previously served as both a food pantry and restaurant, demonstrating its adaptability for various business ventures. Three residential apartments house long-term tenants, providing immediate rental income stability. The mix includes one comfortable one-bedroom unit and two spacious two-bedroom apartments, with
Key facts
- Restaurant
- Food pantry
- Salon hookups
Tags
Property features AI
Finance
- Financial info: Five total units; Tenants are responsible for internet, cable TV, electricity and gas
Exterior
- Parking: Off-street parking for 4 vehicles
- Utilities: Public water; Public sewer; Electric with circuit breakers
- Home design: Multi-family property
- Construction: Clapboard, block, shingle siding, vinyl siding and wood siding construction
- Exterior features: Metal and shingle roofs; Lot dimensions approximately 33' x 60'
Interior
- Kitchen: No kitchen appliance details provided
- Bedrooms: Unit mix includes one 1-bedroom unit and two 2-bedroom units (per-unit bedroom counts listed in unit sections)
- Bathrooms: Three full bathrooms; Two half bathrooms
- Heating & cooling: Forced air heating; Space heaters; Natural gas heating
- Interior features: Full unfinished basement
- Laundry & utility: Tenant pays electricity, gas, internet and cable TV
Neighborhood map
What this means for you Summary
Snapshot
- This is a 2 × 3-bed/2.5-bath units multifamily listed at $161k.
Deal economics
- At list price, monthly cash flow is $1k ($18k/yr) — positive. Per door: $748/mo.
- The deal already cash-flows at list — no discount required.
- Meets the 1% rule at list price ($3k rent vs $161k).
- Recommended offer: $142k (12.0% below list) — sets the bar for market timing.
- Cap rate 17.4% vs local median 4.0% in Johnstown — top-decile yield for the area; either an underpriced asset or a hidden risk that comps aren't pricing in. Stress-test before assuming the spread holds.
Location & tenants
- Location reads 78/100 on livability (#168 in NY, #2,603 nationally) — a middle-class / working-renter tenant base. Strengths: housing A+, health & safety A+, cost of living A; Watch: crime D-, amenities D-.
- Johnstown City School District (town): math 35% / reading 47% proficiency, ranked #509 of 590 in NY (top 86%) — families likely to look elsewhere, expect single-tenant / working-renter base with shorter leases.
- Market conditions: 82 active listings in the ZIP; 112 units permitted in Fulton County in 2024 (50 in 5+ unit buildings).
Forward outlook
- In year one you build about $17k of equity ($1k loan paydown + $16k appreciation (10.0% local appreciation)).
- Fulton County population projected at -23% by 2050 — secular population decline; favor cash flow + early exit over multi-decade hold.
- At projected returns (10.0% appreciation + 3.0% rent growth), your $45k cash investment doubles in ~2 years — after that, you're playing with house money.
- By year 3, paydown + projected appreciation supports a ~$44k cash-out refi (75% LTV) — recoverable capital for the next deal without selling this one.
Negotiation context
- It's been on market 303 days — a 12% lower offer ($142k) is reasonable based on typical stale-listing flexibility.
Risks & watch-outs
- Watch-outs: built in 1907 — expect roof / HVAC / electrical / plumbing capex.
Questions for the listing agent
- It's been on market 303 days. Have you received any prior offers? Is the seller open to a 12% concession, seller financing, or rate buy-down credit?
- Can we see the unit-by-unit rent roll, current vacancy, and any below-market leases? What's the average tenancy length?
- What capital expenditures (roof, boiler, parking lot, exteriors) have been made in the last 5 years, and what's planned in the next 2?
- Built in 1907 — when were the roof, HVAC, electrical panel, plumbing, and water heater last replaced?
- Why hasn't it sold? Are there any deal-killer items the seller is aware of (foundation, flood, title, zoning, code violations)?
- Is there a deadline driving the sale (1031 exchange, divorce, estate, relocation)? That informs how much negotiation room exists.
- Crime grade is D in this area — have there been break-ins, vandalism, or insurance claims at this property in the last 3 years? What carrier currently insures it and at what premium?
- What's the average days-on-market for RENTAL listings here right now (not sales)? A rising rental-DOM trend means longer vacancies and softer asking-rent achievability than the comps imply.
- What's the recent tenant-quality profile in this submarket — average credit score on applications, eviction rate, late-payment / NSF rate, and stable-employment percentage? A property-management company in the area should have these aggregated.
- How much new apartment / multifamily construction is in the pipeline within 1–3 miles? Heavy new supply (>2% of stock underway) typically softens rents 12–24 months out; light construction supports rent growth.
Investment metrics
- 1% rule
- 2.05% ✓
- Cap rate
- 17.44%
- Cash-on-cash
- 39.82%
- DSCR
- 2.77
- GRM
- 4.1
CMA / ARV
- ARV (on-the-fly)
- $165,240
- Comps found
- 1
Show comp detail 1 sale within ~0.75 mi
| Address | Dist | Beds/Ba | Sqft | Sold | Price | $/sf | Match |
|---|---|---|---|---|---|---|---|
| 301 N Perry St | 0.60mi | 7/3.0 (+1) | 5,628 (-8%) | 21mo | $154,600 | $27 | 28 |
Match score weights: distance 35% · size 25% · config 20% · recency 20%. Top-matched comps best support the ARV.
Projected returns pro-forma
10.0% appreciation · 3.0% rent growth · sell at horizon
- IRR
- 55.1%
- Equity multiple
- 5.06×
- Total profit
- $182,901
- Equity at exit
- $144,951
- IRR
- 48.6%
- Equity multiple
- 11.30×
- Total profit
- $463,832
- Equity at exit
- $312,593
Cash invested: $45,052 (down + closing). Projections, not guarantees.
Landlord ↔ Tenant lean methodology
- Overall (STATE)
- 15 Strongly Tenant-Friendly
- State New York
- 15 Strongly Tenant-Friendly · D+10
- County
- — inherits STATE
- City
- — inherits STATE
ZIP-level market 12095
- Home prices YoY
- 3.8%
- Active inventory
- 82
- Price-to-rent
- 8.1×
Monthly cashflow live
- Estimated rent
- $3,300 medium interval (Pro) →
- Mortgage (P&I)
- −$844
- Tax est. 1.5%
- −$201 /mo · $2,414/yr
- Insurance
- −$67
- HOA
- −$0
- Vacancy / Maint / Mgmt
- −$693
- Net cashflow
- $1,495
Break-even live
2-unit breakdown (identical units grouped — click to expand)
| Units | Beds | Baths | Est. rent |
|---|---|---|---|
| 2× units | 3 | 2.5 | $3,300 |
| #1 | 3 | 2.5 | $1,650 |
| #2 | 3 | 2.5 | $1,650 |
| Total (2 units) | $3,300 | ||
UW: 25.0% down · 7.5% · 30yr · 1.5% tax · 5.0% vac · 8.0% maint · 8.0% mgmt
Financing live
Cash to close
- Down payment
- $40,225
- Closing costs
- $4,827
- Reserves months
- —
- Total cash needed
- —
Loan-product check · same deal, 3 products live
Conventional
25% down · 7.5% · 30yr
- Down + closing
- —
- Monthly P&I
- —
- Monthly cashflow
- —
- DSCR
- —
- Eligible?
- —
Personal DTI + credit; lowest rate.
DSCR
20% down · 8.5% · 30yr
- Down + closing
- —
- Monthly P&I
- —
- Monthly cashflow
- —
- DSCR
- —
- Eligible?
- —
No personal income docs; deal must DSCR.
Hard money
10% down · 12.0% · 12mo
- Down + closing
- —
- Monthly P&I
- —
- Monthly cashflow
- —
- DSCR
- —
- Eligible?
- —
Short-term bridge; refi at stabilization.
Listing history 17 events
-
2026-06-18days on market $160,900 Active 303 DOM
-
2026-06-17days on market $160,900 Active 302 DOM
-
2026-06-16days on market $160,900 Active 301 DOM
-
2026-06-15days on market $160,900 Active 300 DOM
-
2026-06-13days on market $160,900 Active 298 DOM
-
2026-06-12days on market $160,900 Active 297 DOM
-
2026-06-09days on market $160,900 Active 294 DOM
-
2026-06-08days on market $160,900 Active 293 DOM
-
2026-06-07days on market $160,900 Active 292 DOM
-
2026-06-07days on market $160,900 Active 291 DOM
-
2026-06-04days on market $160,900 Active 288 DOM
-
2026-06-02days on market $160,900 Active 287 DOM
-
2026-06-01days on market $160,900 Active 286 DOM
-
2026-05-31days on market $160,900 Active 285 DOM
-
2026-03-31price $160,900
-
2025-11-14price $164,900
-
2025-08-19$174,900 Active
ⓘ Source: listings_history table (triggers on properties + properties_extension) + one-shot
backfill from property_details.listing_events for pre-trigger history.
Nearby sold comps map
Loading sold comps map…
Walkable amenities ~0.75 mi
Loading nearby amenities…
Taxation est. · year 1
- Rental income
- $39,600
- − Mortgage interest
- −$9,013
- − Property taxes
- −$2,414
- − Insurance
- −$804
- − Repairs & maintenance
- −$3,168
- − Management
- −$3,168
- − Depreciation
- −$4,681
- Taxable income
- $16,352
- Est. tax owed @ 24.0%
- −$3,925
- After-tax cash flow
- $14,016/yr
For passive investors: Depreciation is non-cash, so a rental often shows a tax loss while cash-flowing — sheltering income. Rental losses are passive: they offset passive income freely, and up to $25,000/yr can offset ordinary (W-2) income if you actively participate and your MAGI is under $100k (phasing out to $0 by $150k); unused losses carry forward. On sale, claimed depreciation is recaptured at up to 25%, and gains may owe capital-gains tax (a 1031 exchange can defer both). Figures are a year-1 estimate at your 24.0% rate — not tax advice; consult a CPA.
Schools (NCES district)
- District
- Johnstown City School District
- NCES district ID
- 3615980
- Math proficiency
- 35% ▼ -8.00%
- Reading proficiency
- 47% ▲ 4.00%
- Median HH income
- $45,999
- Composite
- 34.89/100
- National rank
- #5082
- State rank
- #509 of 590 in NY
Livability — Johnstown
- Score
- 78/100
- State rank
- #168
- US rank
- #2603
Category grades
Schools grade is shown separately in the Schools card above.
Census & demographics
- Census place
- Johnstown, NY
- Population (ZIP)
- 12,013
Population outlook (Fulton County) Hauer SSP2
- Today (2025)
- 51,132 people
- By 2030
- 49,114 · -3.9%
- By 2040
- 44,373 · -13.2%
- By 2050
- 39,321 · -23.1%
- By 2075
- 28,503 · -44.3%
- By 2100
- 19,268 · -62.3%
Race, ethnicity, and origin ACS 2023
- Neighborhood character
- Predominantly White (90%)
- Race & ethnicity
- White 90% Hispanic / Latino 4% Two or more races 4% Black 2%
- Common ancestry
- Iranian 6% Romanian 5% Lithuanian 4%
- Foreign-born
- 2% · Canada
- Languages at home
- 97% English-only · Spanish 2%
Political lean MEDSL · Fulton
- 2024 margin
- Solid R (+35.9) · D 32.1% · R 67.9%
- 2008→2024 swing
- -26.6pp toward R · 2008: -9.2pp · 2024: -35.9pp
- All cycles
- 2024: R+35.9 2020: R+31.4 2016: R+35.5 2012: R+10.5 2008: R+9.2
Not yet ingested
- Civics
- —
Market trends
- HPI YoY
- ▲ 10.82%
- Current HPI
- 297.365
- Rent YoY
- —
- Metro
- —
- State GDP YoY
- ▲ 2.60%
- F500 in state
- 92
Industry mix (Fortune 500 HQ in NY)
| Industry | F500 HQs | Revenue |
|---|---|---|
| Financial Services | 10 | $950B |
|
||
| Consumer Goods | 9 | $162B |
|
||
| Insurance | 4 | $225B |
|
||
| Telecommunications | 2 | $144B |
|
||
| Pharmaceuticals | 2 | $112B |
|
||
| Media / Entertainment | 2 | $69B |
|
||
Price history
-8.0% since first listed3 events — show timeline
- 2026-03-31 Price Changed $160,900 Global MLS
- 2025-11-14 Price Changed $164,900 Global MLS
- 2025-08-19 Listed $174,900 Global MLS
Cash-flow waterfall
monthlySold comps — $/sqft
last 12 mo · ≤1 miLoading sold comps…