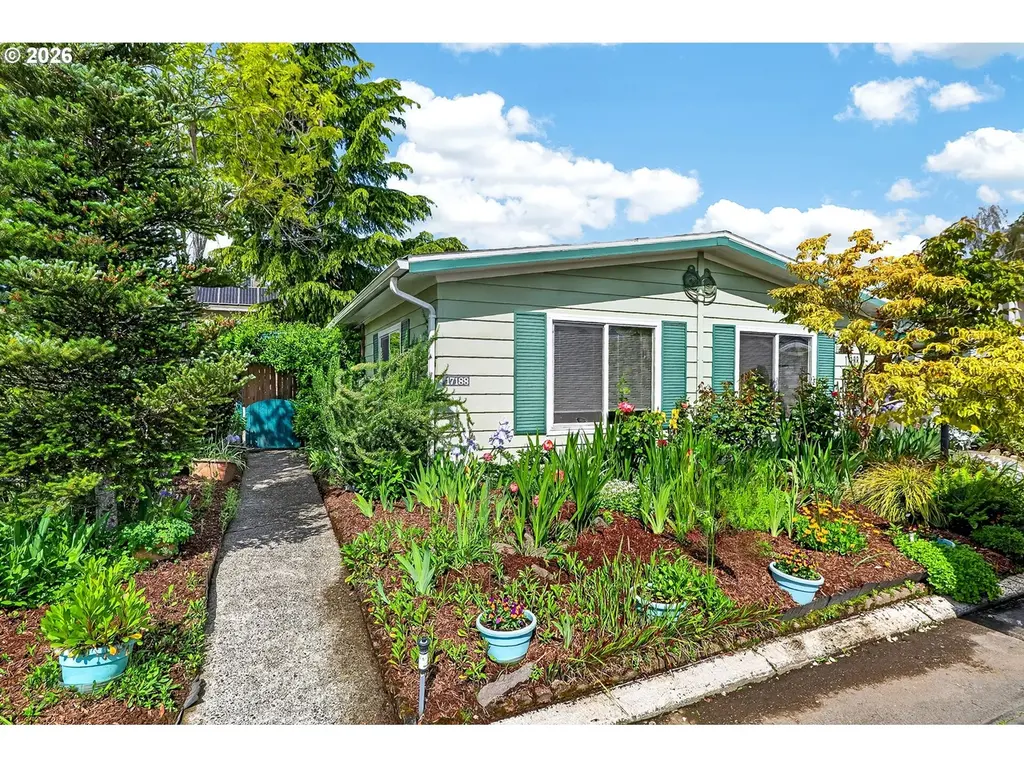
17188 SW Eldorado Dr #111 · King City, OR
Flood risk 1/10 · Minimal
- FEMA flood zone
- X (unshaded)
- Chance of flooding over 30 yrs
- 0.0%
- Est. flood insurance / yr
- $507 – $1,088
Fire risk 4/10 · Minor
- Est. fire insurance / yr
- $498 – $926
Heat risk 3/10 · Minor
- Hot days now (above 92°F)
- 7 days/yr
- Hot days in 30 yrs
- 14 days/yr
Wind risk 1/10 · Minimal
- Chance of severe wind over 30 yrs
- —
Air-quality risk 9/10 · Severe
- Unhealthy air days now
- 12 days/yr
- Unhealthy air days in 30 yrs
- 13 days/yr
Risk factors via First Street. Map © Google.
Why this score? — see what drove the C- grade
The composite is a weighted blend of 9 inputs, each scored 0–100. Each bar is that input's sub-score; the figure is the points it added to the 100-point composite (weight × sub-score).
- Cash flow +15.0/30.0
- ARV discount +15.0/15.0
- 1% rule +5.0/10.0
- DSCR +5.0/10.0
- Schools +4.9/10.0
- Livability +4.2/5.0
- Condition / age +2.5/5.0
- Rent growth +2.4/5.0
- Appreciation +0.0/10.0
$39,999
🖨 Deal sheet 📄 Offer letter ✓ Due diligence
Listing remarks
Welcome home to comfortable, easy living in Eldorado Villas, a sought-after 55+ community designed for connection, convenience, and an active lifestyle. Filled with natural light and warm, inviting spaces, this well-maintained manufactured home offers 2 bedrooms, a spacious living room, dedicated dining area, and a thoughtfully designed kitchen with a functional layout that makes everyday living and entertaining feel effortless. Large windows throughout bring in beautiful natural light, creating an airy and welcoming feel from the moment you step inside. The spacious primary suite offers not only double closets, an ensuite bathroom but a special connection to the outdoors with sliding glass
Key facts
- Covered front porch
- Community amenities
- Natural light
Tags
Property features AI
Finance
- Other: Property is a resale; Located in a park (manufactured home space)
- Financial info: Monthly lot rent (listed)
- HOA & community: Community amenities include gym, library, maintained grounds, management, meeting/party rooms, pool and recreation facilities
Exterior
- Parking: Carport (1 space)
- Utilities: Public water; Public sewer; Gas fuel
- Home design: Manufactured home in a park (residential, detached); One-level living; Built in 1974; No notable view; Main living area approximately 1,248
- Construction: Metal siding; Composition roof; Built in 1974
- Exterior features: Covered patio; Fenced yard; Garden; Yard; Level lot
Interior
- Kitchen: Built-in oven; Built-in range; Dishwasher; Disposal; Free-standing refrigerator; Pantry
- Bedrooms: Primary bedroom on main level with ensuite and double closet; Second bedroom on main level with closet
- Flooring: Wall-to-wall carpet throughout main living areas and bedrooms
- Bathrooms: Two full bathrooms (both on the main level)
- Heating & cooling: Forced air heating (gas hot water); Central air conditioning
- Interior features: Wall-to-wall carpet; Accessible (minimal steps, one level)
Neighborhood map
What this means for you Summary
Snapshot
- This is a 3-bed/2.0-bath manufactured listed at $40k.
Deal economics
- At list price, monthly cash flow is $1k ($16k/yr) — positive.
- The deal already cash-flows at list — no discount required.
- Meets the 1% rule at list price ($2k rent vs $40k).
- Cap rate 46.2% vs local median 2.7% in King City — top-decile yield for the area; either an underpriced asset or a hidden risk that comps aren't pricing in. Stress-test before assuming the spread holds.
Location & tenants
- Location reads 85/100 on livability (#24 in OR, #539 nationally) — a professional / high-income tenant draw. Strengths: crime A+, commute A+, housing A+.
- Tigard-Tualatin SD 23J (suburban): math 47% / reading 65% proficiency, ranked #6 of 58 in OR (top 10%) — acceptable for families but not a draw, mixed tenant base, ~2y average lease.
- Zoned schools: Deer Creek Elementary School (565 students, 32% FRL); Twality Middle School (math 54% / reading 64%, grade B, #17 of 128 statewide, top 14%, 918 students, 31% FRL); Tualatin High School (math 75% / reading 75%, grade A-, #2 of 143 statewide, top 6%, 1,747 students, 25% FRL) — zoned schools at 29% FRL track the district average.
- Market conditions: Rents soft (-0.4%/yr); 412 active listings in the ZIP; 19 comparable units currently listed for rent nearby; rentals leasing fast (median 8d on market — plan ~1-2 weeks tenant-placement turnaround); solid renter incomes; 2,224 units permitted in Washington County in 2024 (242 in 5+ unit buildings).
Forward outlook
- Local home prices are declining (-3.0%/yr); year-one equity from $276 of loan paydown is wiped out by about $1k of value loss. Plan a longer hold.
- Washington County population projected at +33% by 2050 — long-run rental-demand tailwind backs the buy-and-hold thesis.
- At projected returns (-3.0% appreciation + 0.0% rent growth), your $11k cash investment doubles in ~1 year — after that, you're playing with house money.
Negotiation context
- Only 5 days on market — expect competitive offers; lowballing is unlikely to land.
- Current owner paid $32k; 23% above their basis — modest negotiation headroom, anchor on the comps not their cost.
Questions for the listing agent
- Built in 1974 — when were the roof, HVAC, electrical panel, plumbing, and water heater last replaced?
- Is there a deadline driving the sale (1031 exchange, divorce, estate, relocation)? That informs how much negotiation room exists.
- What's the average days-on-market for RENTAL listings here right now (not sales)? A rising rental-DOM trend means longer vacancies and softer asking-rent achievability than the comps imply.
- What's the recent tenant-quality profile in this submarket — average credit score on applications, eviction rate, late-payment / NSF rate, and stable-employment percentage? A property-management company in the area should have these aggregated.
- How much new for-sale + rental construction is in the pipeline within 1–3 miles? Heavy new supply typically softens prices + rents 12–24 months out; constrained supply supports both.
Investment metrics
- 1% rule
- 5.03% ✓
- Cap rate
- 46.17%
- Cash-on-cash
- 142.41%
- DSCR
- 7.34
- GRM
- 1.7
CMA / ARV
- ARV (median comp)
- $76,358
- List price
- $39,999
- Delta
- -47.62%
- Verdict
- UNDERPRICED
- Comps
- 20 within 1.0 mi
Show comp detail 12 sales within ~0.75 mi
| Address | Dist | Beds/Ba | Sqft | Sold | Price | $/sf | Match |
|---|---|---|---|---|---|---|---|
| 17188 SW Eldorado Dr #111 | 0.00mi | 2/2.0 (-1) | 1,248 (0%) | 1mo | $32,500 | $26 | 94 |
| 17151 SW Eldorado Dr #85 | 0.09mi | 2/2.0 (-1) | 1,344 (+8%) | 3mo | $62,000 | $46 | 76 |
| 17041 SW Eldorado Dr | 0.13mi | 2/2.0 (-1) | 1,152 (-8%) | 3mo | $81,500 | $71 | 74 |
| 18485 SW Pacific Dr #37 | 0.43mi | 3/2.0 | 1,296 (+4%) | 0mo | $85,000 | $66 | 73 |
| 17009 SW Eldorado Dr #5 | 0.19mi | 2/2.0 (-1) | 1,152 (-8%) | 1mo | $60,000 | $52 | 72 |
| 17084 SW Eldorado Dr | 0.14mi | 2/2.0 (-1) | 1,152 (-8%) | 7mo | $42,000 | $36 | 70 |
| 12450 SW Fischer Rd #277 | 0.23mi | 2/2.0 (-1) | 1,344 (+8%) | 7mo | $55,000 | $41 | 66 |
| 18485 SW Pacific Dr #92 | 0.52mi | 3/2.0 | 1,284 (+3%) | 8mo | $107,500 | $84 | 64 |
| 11768 SW Royal Villa Dr #124 | 0.64mi | 2/2.0 (-1) | 1,248 (0%) | 2mo | $28,000 | $22 | 64 |
| 18485 SW Pacific Dr #69 | 0.50mi | 2/2.0 (-1) | 1,104 (-12%) | 1mo | $68,000 | $62 | 52 |
| 18485 SW Pacific Dr #74 | 0.50mi | 3/2.0 | 1,404 (+12%) | 6mo | $82,590 | $59 | 51 |
| 11656 SW Royal Villa Dr #71 | 0.73mi | 3/2.0 | 1,344 (+8%) | 6mo | $42,500 | $32 | 48 |
Match score weights: distance 35% · size 25% · config 20% · recency 20%. Top-matched comps best support the ARV.
Projected returns pro-forma
-3.0% appreciation · 0.0% rent growth · sell at horizon
- IRR
- —
- Equity multiple
- 7.46×
- Total profit
- $72,302
- Equity at exit
- $5,964
- IRR
- —
- Equity multiple
- 14.33×
- Total profit
- $149,279
- Equity at exit
- $3,458
Cash invested: $11,200 (down + closing). Projections, not guarantees.
Landlord ↔ Tenant lean methodology
- Overall (STATE)
- 28 Tenant-Leaning
- State Oregon
- 28 Tenant-Leaning · D+6
- County
- — inherits STATE
- City
- — inherits STATE
ZIP-level market 97224
- Rents YoY
- -0.4%
- Active inventory
- 412
- Price-to-rent
- 1.7×
Monthly cashflow live
- Estimated rent
- $2,010 high interval (Pro) →
- Mortgage (P&I)
- −$210
- Tax from tax record
- −$32 /mo · $388/yr
- Insurance
- −$17
- HOA
- −$0
- Vacancy / Maint / Mgmt
- −$422
- Net cashflow
- $1,329
Break-even live
UW: 25.0% down · 7.5% · 30yr · 1.5% tax · 5.0% vac · 8.0% maint · 8.0% mgmt
Financing live
Cash to close
- Down payment
- $10,000
- Closing costs
- $1,200
- Reserves months
- —
- Total cash needed
- —
Loan-product check · same deal, 3 products live
Conventional
25% down · 7.5% · 30yr
- Down + closing
- —
- Monthly P&I
- —
- Monthly cashflow
- —
- DSCR
- —
- Eligible?
- —
Personal DTI + credit; lowest rate.
DSCR
20% down · 8.5% · 30yr
- Down + closing
- —
- Monthly P&I
- —
- Monthly cashflow
- —
- DSCR
- —
- Eligible?
- —
No personal income docs; deal must DSCR.
Hard money
10% down · 12.0% · 12mo
- Down + closing
- —
- Monthly P&I
- —
- Monthly cashflow
- —
- DSCR
- —
- Eligible?
- —
Short-term bridge; refi at stabilization.
Rent comps 19 comps
| Address | Beds | Baths | Sqft | Rent | $/sqft | DOM | Units | Dist |
|---|---|---|---|---|---|---|---|---|
| 17865 SW Pacific Hwy Tualatin, OR | 1.0–3.0 | 1.0–2.0 | 970 | $2,242 | $2.31 | 1d | 13 | 0.23mi |
| 16849 SW 131st Ave Portland, OR | 2.0 | 2.0 | 1029 | $1,950 | $1.90 | 14d | 1 | 0.35mi |
| 12070 SW Fischer Rd Portland, OR | 1.0–3.0 | 1.0–2.0 | 925 | $2,099 | $2.27 | 1d | 9 | 0.41mi |
| 13060 SW Dickson St Portland, OR | 2.0 | 2.0 | 1108 | $1,850 | $1.67 | 43d | 1 | 0.45mi |
| 16444 SW 130th Ter King City, OR | 2.0 | 2.0 | 1002 | $1,695 | $1.69 | 43d | 1 | 0.48mi |
| 11865 SW Tualatin Rd Tualatin, OR | 2.0–3.0 | 2.0–2.5 | 1154 | $2,737 | $2.37 | 1d | 19 | 0.50mi |
| 17000 SW Pacific Hwy Portland, OR | 1.0–2.0 | 1.0–2.0 | 684 | $1,575 | $2.30 | 43d | 3 | 0.55mi |
| 10900 SW Gaarde St Portland, OR | 2.0 | 1.0 | 825 | $1,525 | $1.85 | 7d | 4 | 0.55mi |
| 10900 SW Gaarde St Unit 273-16 Tigard, OR | 2.0 | 1.0 | 900 | $1,575 | $1.75 | 23d | 1 | 0.55mi |
| 17979 SW 115th Ave Unit 6 Tualatin, OR | 2.0 | 1.5 | 1064 | $1,625 | $1.53 | 23d | 1 | 0.58mi |
| 17987 SW 115th Ave Unit 1 Tualatin, OR | 2.0 | 1.0 | 900 | $1,475 | $1.64 | 23d | 1 | 0.63mi |
| 17989 SW 115th Ave Tualatin, OR | 2.0 | 1.0–1.5 | 982 | $1,550 | $1.58 | 23d | 2 | 0.65mi |
| 13830 SW Chinn Ln Portland, OR | 1.0–3.0 | 1.0–2.0 | 839 | $2,100 | $2.50 | 3d | 11 | 0.91mi |
| 14495 SW Beef Bend Rd Portland, OR | 1.0–2.0 | 1.0–2.0 | 845 | $1,925 | $2.28 | 4d | 12 | 1.01mi |
| 16055 SW 108th Ave Tigard, OR | 1.0–2.0 | 1.0–2.0 | 852 | $1,940 | $2.28 | 7d | 9 | 1.20mi |
| 11773 SW King George Dr King City, OR | 1.0–2.0 | 1.0–2.0 | 826 | $2,500 | $3.03 | 11d | 7 | 1.20mi |
| 11390 SW Naeve St Tigard, OR | 1.0–2.0 | 1.0–2.0 | 893 | $2,119 | $2.37 | 3d | 5 | 1.39mi |
| 11545 SW Beef Bend Rd Portland, OR | 2.0 | 2.0 | 935 | $1,514 | $1.62 | 2d | 1 | 1.40mi |
| 15199 SW Royalty Pkwy Portland, OR | 1.0–3.0 | 1.0–2.0 | 884 | $2,205 | $2.49 | 1d | 12 | 1.44mi |
Listing history 3 events
-
2026-05-17status Pending 1535-char remark
-
2026-05-12$39,999 Active 1535-char remark
-
1996-04-20soldstatus $22,000
ⓘ Source: listings_history table (triggers on properties + properties_extension) + one-shot
backfill from property_details.listing_events for pre-trigger history.
Tax reassessment forecast OR · Resets to sale price
- Current annual tax
- $388 · $32/mo
- Projected year-2 tax
- $388 · $32/mo
- Expected delta
- $0/yr ($0/mo · 0.0%)
ⓘ Screening estimate from a state-policy table — verify with the county assessor before closing.
Climate risk First Street
- Flood 1/10 Low FEMA zone X (unshaded) · 0% chance over 30 yrs
- Wildfire 4/10 Moderate
- Heat 3/10 Moderate 7 d/yr ≥92°F today · 14 d/yr by 30 yrs out
- Wind 1/10 Low
- Air quality 9/10 Extreme 12 unhealthy d/yr today · 13 by 30 yrs out
Nearby sold comps map
Loading sold comps map…
Walkable amenities ~0.75 mi
Loading nearby amenities…
Taxation est. · year 1
- Rental income
- $24,120
- − Mortgage interest
- −$2,241
- − Property taxes
- −$388
- − Insurance
- −$200
- − Repairs & maintenance
- −$1,930
- − Management
- −$1,930
- − Depreciation
- −$1,164
- Taxable income
- $16,269
- Est. tax owed @ 24.0%
- −$3,904
- After-tax cash flow
- $12,045/yr
For passive investors: Depreciation is non-cash, so a rental often shows a tax loss while cash-flowing — sheltering income. Rental losses are passive: they offset passive income freely, and up to $25,000/yr can offset ordinary (W-2) income if you actively participate and your MAGI is under $100k (phasing out to $0 by $150k); unused losses carry forward. On sale, claimed depreciation is recaptured at up to 25%, and gains may owe capital-gains tax (a 1031 exchange can defer both). Figures are a year-1 estimate at your 24.0% rate — not tax advice; consult a CPA.
Schools (NCES district)
- District
- Tigard-Tualatin SD 23J
- NCES district ID
- 4112240
- Math proficiency
- 47% ▼ -3.00%
- Reading proficiency
- 65% ▲ 3.00%
- Median HH income
- $60,739
- Composite
- 48.72/100
- National rank
- #2100
- State rank
- #6 of 58 in OR
Livability — King City
- Score
- 85/100
- State rank
- #24
- US rank
- #539
Category grades
Schools grade is shown separately in the Schools card above.
Census & demographics
- County
- Washington County · 583,254 people
- Metro
- Portland-Vancouver-Hillsboro, OR-WA
- Population (ZIP)
- 36,569
- Household income
- $98,125
- Rent vs Own
- Severe rent burden
- 1468.0
Population outlook (Washington County) Hauer SSP2
- Today (2025)
- 674,042 people
- By 2030
- 721,804 · +7.1%
- By 2040
- 812,732 · +20.6%
- By 2050
- 895,143 · +32.8%
- By 2075
- 1,058,806 · +57.1%
- By 2100
- 1,131,692 · +67.9%
Race, ethnicity, and origin ACS 2023
- Neighborhood character
- Predominantly White (73%)
- Race & ethnicity
- White 73% Hispanic / Latino 10% Two or more races 8% Asian 8% Black 3%
- Hispanic origin (detail)
- Mexican 7%
- Common ancestry
- Italian 4% Lithuanian 4% Slovak 3%
- Foreign-born
- 13% · Canada, Vietnam, China
- Languages at home
- 83% English-only · Spanish 7% Other Indo-European 3% Vietnamese 2%
Political lean MEDSL · Washington
- 2024 margin
- Solid D (+34.0) · D 65.3% · R 31.3% · Other 3.4%
- 2008→2024 swing
- +11.8pp toward D · 2008: 22.1pp · 2024: 34.0pp
- All cycles
- 2024: D+34.0 2020: D+34.6 2016: D+26.7 2012: D+17.5 2008: D+22.1
Not yet ingested
- Civics
- —
Market trends
- HPI YoY
- ▼ -287.40%
- Current HPI
- 277.57
- Rent YoY
- ▼ -0.38%
- Metro
- Portland-Vancouver-Hillsboro, OR-WA
- State GDP YoY
- ▲ 2.05%
- F500 in state
- 2
Industry mix (Fortune 500 HQ in OR)
| Industry | F500 HQs | Revenue |
|---|---|---|
| Consumer Goods | 1 | $51B |
|
||
Price history
+47.7% since first listed4 events — show timeline
- 2026-05-29 Sold (MLS) $32,500 RMLS
- 2026-05-17 Pending — RMLS
- 2026-05-12 Listed $39,999 RMLS
- 1996-04-20 Sold (Public Records) $22,000 Public Records
Property tax history
+6.0%/yrLatest (2016): $388 · +6366.7% YoY. Source: county tax records.
Cash-flow waterfall
monthlySold comps — $/sqft
last 12 mo · ≤1 miLoading sold comps…