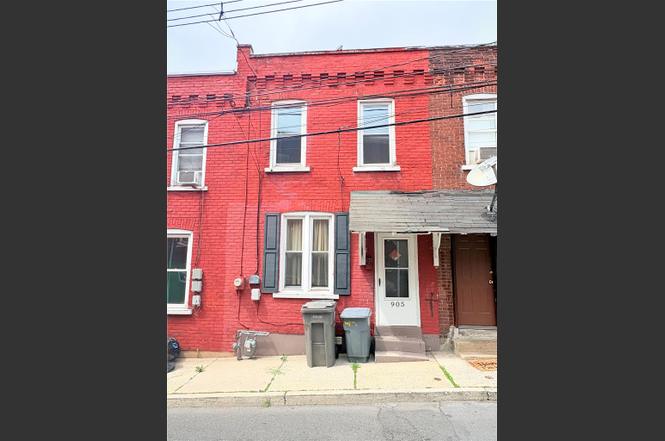
905 Mechanic St · Bethlehem, PA
Flood risk 1/10 · Minimal
- FEMA flood zone
- X (unshaded)
- Chance of flooding over 30 yrs
- 0.0%
- Est. flood insurance / yr
- $473 – $860
Fire risk 2/10 · Minimal
- Est. fire insurance / yr
- $511 – $949
Heat risk 5/10 · Moderate
- Hot days now (above 99°F)
- 7 days/yr
- Hot days in 30 yrs
- 15 days/yr
Wind risk 4/10 · Minor
- Chance of severe wind over 30 yrs
- 21.0%
Air-quality risk 4/10 · Minor
- Unhealthy air days now
- 3 days/yr
- Unhealthy air days in 30 yrs
- 6 days/yr
Risk factors via First Street. Map © Google.
Why this score? — see what drove the B- grade
The composite is a weighted blend of 9 inputs, each scored 0–100. Each bar is that input's sub-score; the figure is the points it added to the 100-point composite (weight × sub-score).
- Cash flow +27.7/30.0
- ARV discount +10.4/15.0
- DSCR +9.8/10.0
- 1% rule +7.2/10.0
- Rent growth +4.3/5.0
- Livability +4.1/5.0
- Schools +3.5/10.0
- Condition / age +2.5/5.0
- Appreciation +0.0/10.0
$164,900
🖨 Deal sheet 📄 Offer letter ✓ Due diligence
Listing remarks MLS
A great opportunity is available for a solid, low maintenance 3 BR, 1.5 bath brick row house near ArtsQuest, Wind Creek Casino, Northampton Community College, Fab Lab and Bethlehem's flourishing southside. This move-in ready home is newly painted with brand new wall to wall carpeting throughout and an updated kitchen w/ new vinyl floor, new stove and hood, and new countertops. Other upgrades include new tub and surround in full bath, hot water heater (2015) and upgraded electric meter. Take advantage of low taxes, gas heat and convenience to Rt 78. Why rent when you can own this affordable home with great views of the SteelStacks?! Also a great investment property!
Key facts
- Red brick exterior
- Unfinished basement
- Private rear yard
Tags
Property features AI
Exterior
- Parking: No garage
- Utilities: Public water; Public sewer; Electric service with circuit breakers
- Home design: Two-story brick home; Rubber roof
- Construction: Brick construction
- Exterior features: Small lot (approximately 0.028 acres)
Interior
- Kitchen: Gas oven and gas range; Microwave; Dishwasher; Refrigerator
- Bedrooms: Three bedrooms located on the second floor
- Flooring: Laminate flooring; Resilient flooring; Tile flooring
- Bathrooms: One full bathroom on the first floor; One half bathroom on the second floor
- Heating & cooling: Hot water gas baseboard heating; Ceiling fans for cooling
- Interior features: Dining area and a separate/formal dining room; Basement (partial)
- Laundry & utility: Washer and dryer included; Washer hookup and dryer hookup (electric dryer hookup available); Gas water heater
Neighborhood map
What this means for you Summary
Snapshot
- This is a 3-bed/1.0-bath townhouse listed at $165k.
Deal economics
- At list price, monthly cash flow is $498 ($6k/yr) — positive.
- The deal already cash-flows at list — no discount required.
- Meets the 1% rule at list price ($2k rent vs $165k).
- Cap rate 9.9% vs local median 4.3% in Bethlehem — top-decile yield for the area; either an underpriced asset or a hidden risk that comps aren't pricing in. Stress-test before assuming the spread holds.
Location & tenants
- Location reads 82/100 on livability (#138 in PA, #1,122 nationally) — a professional / high-income tenant draw. Strengths: amenities A+, cost of living A+, housing A+; Watch: commute F.
- Bethlehem Area SD (urban): math 31% / reading 49% proficiency, ranked #342 of 539 in PA (top 64%) — families likely to look elsewhere, expect single-tenant / working-renter base with shorter leases.
- Market conditions: Rents rising fast (+7.2%/yr); 156 active listings in the ZIP; 40 comparable units currently listed for rent nearby; rentals at typical pace (median 21d on market — plan ~3-4 weeks tenant-placement turnaround); 567 units permitted in Northampton County in 2024 (151 in 5+ unit buildings).
- This rent runs 40% of the median local income ($61k/yr) — at the standard rent-burdened threshold; future hikes will face affordability resistance.
Forward outlook
- Local home prices are declining (-3.0%/yr); year-one equity from $1k of loan paydown is wiped out by about $5k of value loss. Plan a longer hold.
- At projected returns (-3.0% appreciation + 7.2% rent growth), your $46k cash investment doubles in ~7 years — after that, you're playing with house money.
Negotiation context
- Only 2 days on market — expect competitive offers; lowballing is unlikely to land.
- 3 sale attempts since 20y ago with the ask held roughly flat each time — persistent listings suggest the price (not the market) is what's stuck; bring a comps-based counter.
- Current owner paid $92k; list at $165k implies a 80% gain — meaningful room to come down on a strong offer.
Risks & watch-outs
- Watch-outs: built in 1900 — expect roof / HVAC / electrical / plumbing capex.
- Climate carrying-cost: extreme-heat days projected 7→15/yr by 2055 (HVAC capex compounding) — expect insurance premiums to compound above CPI over the hold.
Questions for the listing agent
- Built in 1900 — when were the roof, HVAC, electrical panel, plumbing, and water heater last replaced?
- Is there a deadline driving the sale (1031 exchange, divorce, estate, relocation)? That informs how much negotiation room exists.
- Schools are B-rated — typically a magnet for longer-tenancy family renters. What's the average tenant stay here, and is there a school-zone premium baked into asking?
- What's the average days-on-market for RENTAL listings here right now (not sales)? A rising rental-DOM trend means longer vacancies and softer asking-rent achievability than the comps imply.
- What's the recent tenant-quality profile in this submarket — average credit score on applications, eviction rate, late-payment / NSF rate, and stable-employment percentage? A property-management company in the area should have these aggregated.
- How much new for-sale + rental construction is in the pipeline within 1–3 miles? Heavy new supply typically softens prices + rents 12–24 months out; constrained supply supports both.
Investment metrics
- 1% rule
- 1.22% ✓
- Cap rate
- 9.92%
- Cash-on-cash
- 12.96%
- DSCR
- 1.58
- GRM
- 6.9
CMA / ARV
- ARV (on-the-fly)
- $176,220
- Comps found
- 12
Show comp detail 12 sales within ~0.75 mi
| Address | Dist | Beds/Ba | Sqft | Sold | Price | $/sf | Match |
|---|---|---|---|---|---|---|---|
| 662 Atlantic St | 0.33mi | 2/1.0 (-1) | 1,074 (+1%) | 2mo | $140,000 | $130 | 77 |
| 614 Buchanan St | 0.30mi | 3/1.0 | 1,027 (-4%) | 3mo | $192,000 | $187 | 77 |
| 519 Jackson St | 0.35mi | 3/1.0 | 1,128 (+6%) | 4mo | $125,000 | $111 | 71 |
| 512 Atlantic St | 0.20mi | 2/1.0 (-1) | 1,105 (+4%) | 12mo | $169,900 | $154 | 70 |
| 754 E 5th St | 0.18mi | 2/1.0 (-1) | 988 (-8%) | 6mo | $130,000 | $132 | 68 |
| 513 Jackson St | 0.35mi | 2/1.0 (-1) | 1,075 (+1%) | 11mo | $172,000 | $160 | 68 |
| 322 State St | 0.05mi | 2/1.0 (-1) | 960 (-10%) | 10mo | $180,000 | $188 | 67 |
| 670 Atlantic St | 0.34mi | 3/1.0 | 1,184 (+11%) | 2mo | $138,000 | $117 | 64 |
| 740 Laufer St | 0.22mi | 3/1.5 | 910 (-15%) | 3mo | $150,000 | $165 | 60 |
| 527 Maple St | 0.72mi | 3/1.5 | 1,058 (-1%) | 10mo | $275,000 | $260 | 55 |
| 11 W 2nd St #139 | 0.73mi | 2/2.0 (-1) | 1,212 (+14%) | 2mo | $295,000 | $243 | 32 |
| 11 W 2nd St #210 | 0.73mi | 2/2.0 (-1) | 1,224 (+15%) | 8mo | $272,000 | $222 | 26 |
Match score weights: distance 35% · size 25% · config 20% · recency 20%. Top-matched comps best support the ARV.
Projected returns pro-forma
-3.0% appreciation · 7.18% rent growth · sell at horizon
- IRR
- 7.3%
- Equity multiple
- 1.30×
- Total profit
- $13,813
- Equity at exit
- $24,587
- IRR
- 19.9%
- Equity multiple
- 3.00×
- Total profit
- $92,209
- Equity at exit
- $14,258
Cash invested: $46,172 (down + closing). Projections, not guarantees.
Landlord ↔ Tenant lean methodology
- Overall (STATE)
- 62 Landlord-Friendly
- State Pennsylvania
- 62 Landlord-Friendly · EVEN
- County
- — inherits STATE
- City
- — inherits STATE
ZIP-level market 18015
- Home prices YoY
- -30.7%
- Rents YoY
- 7.2%
- Active inventory
- 156
- Price-to-rent
- 6.9×
Monthly cashflow live
- Estimated rent
- $2,005 high interval (Pro) →
- Mortgage (P&I)
- −$865
- Tax from tax record
- −$152 /mo · $1,825/yr
- Insurance
- −$69
- HOA
- −$0
- Vacancy / Maint / Mgmt
- −$421
- Net cashflow
- $498
Break-even live
UW: 25.0% down · 7.5% · 30yr · 1.5% tax · 5.0% vac · 8.0% maint · 8.0% mgmt
Financing live
Cash to close
- Down payment
- $41,225
- Closing costs
- $4,947
- Reserves months
- —
- Total cash needed
- —
Loan-product check · same deal, 3 products live
Conventional
25% down · 7.5% · 30yr
- Down + closing
- —
- Monthly P&I
- —
- Monthly cashflow
- —
- DSCR
- —
- Eligible?
- —
Personal DTI + credit; lowest rate.
DSCR
20% down · 8.5% · 30yr
- Down + closing
- —
- Monthly P&I
- —
- Monthly cashflow
- —
- DSCR
- —
- Eligible?
- —
No personal income docs; deal must DSCR.
Hard money
10% down · 12.0% · 12mo
- Down + closing
- —
- Monthly P&I
- —
- Monthly cashflow
- —
- DSCR
- —
- Eligible?
- —
Short-term bridge; refi at stabilization.
Rent comps 40 comps
| Address | Beds | Baths | Sqft | Rent | $/sqft | DOM | Units | Dist |
|---|---|---|---|---|---|---|---|---|
| 938 E 4th St #401 Bethlehem, PA | 2.0 | 1.0 | 928 | $2,150 | $2.32 | 43d | 1 | 0.05mi |
| 938 E 4th St Unit 102 Bethlehem, PA | 2.0 | 1.0 | 813 | $1,970 | $2.42 | 43d | 1 | 0.05mi |
| 938 E 4th St Unit 201 Bethlehem, PA | 2.0 | 1.0 | 982 | $2,350 | $2.39 | 43d | 1 | 0.05mi |
| 938 E 4th St Unit G02 Bethlehem, PA | 2.0 | 1.0 | 813 | $1,970 | $2.42 | 14d | 1 | 0.05mi |
| 1113 E 4th St Unit 1 Bethlehem, PA | 2.0 | 1.0 | 1000 | $1,350 | $1.35 | 23d | 1 | 0.14mi |
| 738 E 4th St Unit 1 Bethlehem, PA | 3.0 | 1.0 | 750 | $1,600 | $2.13 | 14d | 1 | 0.16mi |
| 740 Laufer St Bethlehem, PA | 3.0 | 1.5 | 910 | $1,650 | $1.81 | 14d | 1 | 0.21mi |
| 610 E 3rd St Bethlehem, PA | 1.0–2.0 | 1.0–2.0 | 974 | $3,008 | $3.09 | 2d | 8 | 0.27mi |
| 1201 E 4th St Unit 4 Bethlehem, PA | 3.0 | 1.5 | 1100 | $1,800 | $1.64 | 43d | 1 | 0.29mi |
| 1209 Mechanic St Bethlehem, PA | 3.0 | 1.0 | 1003 | $2,000 | $1.99 | 21d | 1 | 0.30mi |
| 436 Pierce St Bethlehem, PA | 4.0 | 2.0 | 1452 | $2,250 | $1.55 | 2d | 1 | 0.31mi |
| 1236 E 7th St Bethlehem, PA | 3.0 | 2.5 | 1424 | $2,350 | $1.65 | 2d | 1 | 0.42mi |
| 824 E 8th St Bethlehem, PA | 2.0 | 1.5 | 952 | $1,400 | $1.47 | 43d | 1 | 0.42mi |
| 1275 E 4th St Unit 202 Bethlehem, PA | 2.0 | 2.0 | 1225 | $1,950 | $1.59 | 23d | 1 | 0.46mi |
| 1306 E 4th St #3 Bethlehem, PA | 2.0 | 1.0 | 1000 | $1,550 | $1.55 | 43d | 1 | 0.48mi |
| 311 E 3rd St Bethlehem, PA | 2.0 | 2.0 | 1189 | $2,330 | $1.96 | 2d | 3 | 0.50mi |
| 11 W 2nd St Bethlehem, PA | 2.0 | 2.0 | 1620 | $2,550 | $1.57 | 23d | 4 | 0.78mi |
| 650 E North St Bethlehem, PA | 2.0 | 1.0–2.0 | 935 | $2,350 | $2.51 | 14d | 7 | 0.82mi |
| 530 High St Unit 32 Bethlehem, PA | 2.0 | 1.0 | 800 | $1,595 | $1.99 | 14d | 1 | 0.84mi |
| 42 E Wall St Bethlehem, PA | 4.0 | 1.0 | 1474 | $2,550 | $1.73 | 23d | 1 | 0.86mi |
| 30 E Market St Bethlehem, PA | 2.0 | 1.0 | 800 | $1,650 | $2.06 | 23d | 1 | 0.92mi |
| 30 E Market St Apt 1 Bethlehem, PA | 2.0 | 1.0 | 1200 | $1,950 | $1.62 | 43d | 1 | 0.92mi |
| 708 Linden St Unit 2 Bethlehem, PA | 2.0 | 1.0 | 800 | $1,500 | $1.88 | 14d | 1 | 0.92mi |
| 1630 E 9th St Bethlehem, PA | 2.0 | 1.0 | 750 | $1,750 | $2.33 | 14d | 1 | 0.92mi |
| 228 W 3rd St Bethlehem, PA | 2.0 | 1.0 | 750 | $1,595 | $2.13 | 43d | 1 | 0.94mi |
| 746 Linden St Unit 2 Bethlehem, PA | 3.0 | 1.0 | 1008 | $1,975 | $1.96 | 43d | 1 | 0.98mi |
| 316 E Union Blvd Bethlehem, PA | 4.0 | 2.0 | 1460 | $2,145 | $1.47 | 43d | 1 | 0.99mi |
| 822 Elm St Bethlehem, PA | 3.0 | 1.5 | 1406 | $2,195 | $1.56 | 14d | 1 | 1.00mi |
| 229 E Union Blvd Unit 2nd Floor Bethlehem, PA | 2.0 | 1.0 | 982 | $1,595 | $1.62 | 2d | 1 | 1.04mi |
| 229 E Union Blvd Unit 1st Floor Bethlehem, PA | 2.0 | 1.0 | 1000 | $1,675 | $1.68 | 2d | 1 | 1.04mi |
| 537 Goepp Cir Unit B Bethlehem, PA | 3.0 | 1.5 | 1225 | $1,895 | $1.55 | 43d | 1 | 1.06mi |
| 521 Hess St Bethlehem, PA | 3.0 | 1.0 | 1120 | $1,500 | $1.34 | 21d | 1 | 1.06mi |
| 401 E Goepp St #2 Bethlehem, PA | 2.0 | 1.0 | 750 | $1,875 | $2.50 | 23d | 1 | 1.07mi |
| 62 E Garrison St Bethlehem, PA | 2.0 | 2.0 | 800 | $1,450 | $1.81 | 43d | 1 | 1.08mi |
| 30 W Broad St Bethlehem, PA | 1.0–2.0 | 1.0–2.0 | 648 | $2,490 | $3.84 | 14d | 14 | 1.12mi |
| 30 W Broad St Bethlehem, PA | 1.0–2.0 | 1.0–2.0 | 660 | $2,620 | $3.97 | 2d | 20 | 1.12mi |
| 406 W 9th St Bethlehem, PA | 3.0 | 1.0 | 1152 | $2,100 | $1.82 | 21d | 1 | 1.12mi |
| 122 E Goepp St Unit 1 Bethlehem, PA | 3.0 | 1.0 | 1137 | $1,895 | $1.67 | 2d | 1 | 1.14mi |
| 414 Cherokee St Unit 414 2nd Fl Bethlehem, PA | 2.0 | 1.0 | 800 | $1,800 | $2.25 | 14d | 1 | 1.15mi |
| 69 E Goepp St Bethlehem, PA | 3.0 | 1.0 | 1100 | $2,150 | $1.95 | 2d | 1 | 1.19mi |
Listing history 3 events
-
2026-06-18days on market $164,900 Active 2 DOM
-
2026-06-16remarks 699-char remark
-
2026-06-16$164,900 Active 1 DOM
ⓘ Source: listings_history table (triggers on properties + properties_extension) + one-shot
backfill from property_details.listing_events for pre-trigger history.
Tax reassessment forecast PA · Partial reset (capped growth)
- Current annual tax
- $1,825 · $152/mo
- Projected year-2 tax
- $2,215 · $185/mo
- Expected delta
- +$390/yr (+$33/mo · 21.4%)
ⓘ Screening estimate from a state-policy table — verify with the county assessor before closing.
Climate risk First Street
- Flood 1/10 Low FEMA zone X (unshaded) · 0% chance over 30 yrs
- Wildfire 2/10 Low
- Heat 5/10 Major 7 d/yr ≥99°F today · 15 d/yr by 30 yrs out
- Wind 4/10 Moderate 21% chance of damaging wind over 30 yrs
- Air quality 4/10 Moderate 3 unhealthy d/yr today · 6 by 30 yrs out
Nearby sold comps map
Loading sold comps map…
Walkable amenities ~0.75 mi
Loading nearby amenities…
Taxation est. · year 1
- Rental income
- $24,062
- − Mortgage interest
- −$9,237
- − Property taxes
- −$1,825
- − Insurance
- −$824
- − Repairs & maintenance
- −$1,925
- − Management
- −$1,925
- − Depreciation
- −$4,797
- Taxable income
- $3,528
- Est. tax owed @ 24.0%
- −$847
- After-tax cash flow
- $5,135/yr
For passive investors: Depreciation is non-cash, so a rental often shows a tax loss while cash-flowing — sheltering income. Rental losses are passive: they offset passive income freely, and up to $25,000/yr can offset ordinary (W-2) income if you actively participate and your MAGI is under $100k (phasing out to $0 by $150k); unused losses carry forward. On sale, claimed depreciation is recaptured at up to 25%, and gains may owe capital-gains tax (a 1031 exchange can defer both). Figures are a year-1 estimate at your 24.0% rate — not tax advice; consult a CPA.
Schools (NCES district)
- District
- Bethlehem Area SD
- NCES district ID
- 4203570
- Math proficiency
- 31% ▼ -2.00%
- Reading proficiency
- 49% ▼ -6.00%
- Median HH income
- $55,124
- Composite
- 34.92/100
- National rank
- #5068
- State rank
- #342 of 539 in PA
Livability — Bethlehem
- Score
- 82/100
- State rank
- #138
- US rank
- #1122
Category grades
Schools grade is shown separately in the Schools card above.
Census & demographics
- Census place
- Bethlehem, PA
- County
- Northampton County · 236,814 people
- City population
- 129,661
- Metro
- Allentown-Bethlehem-Easton, PA-NJ
- Population (ZIP)
- 34,852
- Household income
- $60,800
- Rent vs Own
- Severe rent burden
- 1525.0
Population outlook (Northampton County) Hauer SSP2
- Today (2025)
- 312,227 people
- By 2030
- 314,769 · +0.8%
- By 2040
- 316,914 · +1.5%
- By 2050
- 318,037 · +1.9%
- By 2075
- 334,003 · +7.0%
- By 2100
- 344,696 · +10.4%
Race, ethnicity, and origin ACS 2023
- Neighborhood character
- Diverse neighborhood (Simpson 0.62)
- Race & ethnicity
- White 53% Hispanic / Latino 29% Two or more races 14% Black 10% Asian 5%
- Hispanic origin (detail)
- Mexican 2% Puerto Rican 19% Dominican 3%
- Common ancestry
- Romanian 4% Danish 1% Iranian 1%
- Foreign-born
- 12% · Canada, China, Jamaica
- Languages at home
- 73% English-only · Spanish 21% Chinese 2% Other Indo-European 2%
Political lean MEDSL · Northampton
- 2024 margin
- Toss-up / Even · D 48.6% · R 50.4%
- 2008→2024 swing
- -14.1pp toward R · 2008: 12.3pp · 2024: -1.8pp
- All cycles
- 2024: R+1.8 2020: D+0.7 2016: R+3.8 2012: D+4.6 2008: D+12.3
Not yet ingested
- Civics
- —
Market trends
- HPI YoY
- ▼ -122.95%
- Current HPI
- 277.4721
- Rent YoY
- ▲ 7.18%
- Metro
- Allentown-Bethlehem-Easton, PA-NJ
- State GDP YoY
- ▲ 1.68%
- F500 in state
- 34
Industry mix (Fortune 500 HQ in PA)
| Industry | F500 HQs | Revenue |
|---|---|---|
| Healthcare | 2 | $309B |
|
||
| Insurance | 2 | $27B |
|
||
| Telecommunications / Media | 1 | $124B |
|
||
| Industrial Distribution | 1 | $22B |
|
||
| Financial Services | 1 | $20B |
|
||
| Chemicals / Materials | 1 | $18B |
|
||
Price history
+724.5% since first listed9 events — show timeline
- 2026-06-15 Listed $164,900 GLVRMLS
- 2020-03-02 Sold (Public Records) $91,500 Public Records
- 2020-02-19 Sold (MLS) $91,500 GLVRMLS
- 2020-01-15 Pending — GLVRMLS
- 2020-01-08 Listed $95,000 GLVRMLS
- 2007-03-21 Sold (Public Records) $68,000 Public Records
- 2007-03-09 Sold (MLS) $68,000 GLVRMLS
- 2006-11-30 Listed $73,900 GLVRMLS
- 1988-10-01 Sold (Public Records) $20,000 Public Records
Property tax history
+1.5%/yrLatest (2026): $1,825 · +3.5% YoY. Source: county tax records.
Cash-flow waterfall
monthlySold comps — $/sqft
last 12 mo · ≤1 miLoading sold comps…