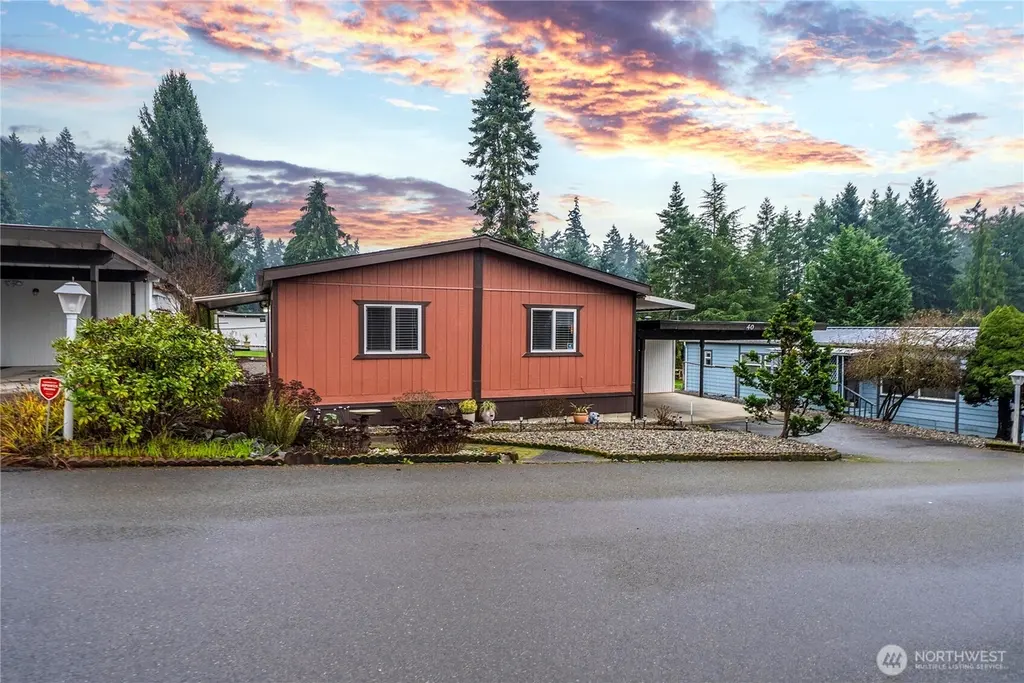
9314 Canyon Rd E #40 · Summit, WA
Flood risk 1/10 · Minimal
- FEMA flood zone
- X (unshaded)
- Chance of flooding over 30 yrs
- 0.0%
- Est. flood insurance / yr
- $473 – $860
Fire risk 1/10 · Minimal
- Est. fire insurance / yr
- $604 – $1,122
Heat risk 3/10 · Minor
- Hot days now (above 87°F)
- 7 days/yr
- Hot days in 30 yrs
- 14 days/yr
Wind risk 1/10 · Minimal
- Chance of severe wind over 30 yrs
- —
Air-quality risk 7/10 · Major
- Unhealthy air days now
- 10 days/yr
- Unhealthy air days in 30 yrs
- 12 days/yr
Risk factors via First Street. Map © Google.
Why this score? — see what drove the C+ grade
The composite is a weighted blend of 9 inputs, each scored 0–100. Each bar is that input's sub-score; the figure is the points it added to the 100-point composite (weight × sub-score).
- Cash flow +30.0/30.0
- 1% rule +10.0/10.0
- DSCR +10.0/10.0
- Schools +3.9/10.0
- Livability +3.3/5.0
- Rent growth +2.9/5.0
- Condition / age +2.5/5.0
- ARV discount +0.0/15.0
- Appreciation +0.0/10.0
$122,000
🖨 Deal sheet 📄 Offer letter ✓ Due diligence
Listing remarks
Discover your dream home in vibrant Canyon Terrace, a welcoming 55+ community! This stunning turnkey 3-bed, 1.75-bath gem shines with fresh updates: new flooring, paint, trim, fixtures, bathrooms, roof & more! All appliances included for instant comfort. Relax under the covered carport for 2 cars, with sheltered entries, accessibility ramp, ample storage, and easy low-maintenance landscaping on a spacious lot. Dive into fun community amenities: clubhouse with library & game room (billiards + ping-pong), plus RV/boat storage. Prime spot off Canyon Road for effortless freeway access. Don't miss out—move in today and fall in love with your new lifestyle!
Key facts
- New flooring
- New paint
- New trim
Tags
Neighborhood map
What this means for you Summary
Snapshot
- This is a 3-bed/2.0-bath manufactured listed at $122k.
Deal economics
- At list price, monthly cash flow is $690 ($8k/yr) — positive.
- The deal already cash-flows at list — no discount required.
- Meets the 1% rule at list price ($2k rent vs $122k).
- Recommended offer: $107k (12.0% below list) — sets the bar for market timing.
- Cap rate 13.1% vs local median 2.5% in Summit — top-decile yield for the area; either an underpriced asset or a hidden risk that comps aren't pricing in. Stress-test before assuming the spread holds.
Location & tenants
- Location reads 66/100 on livability (#318 in WA) — a middle-class / working-renter tenant base. Strengths: housing A+, health & safety A+, employment A; Watch: schools D-, amenities F, commute F.
- Franklin Pierce School District (suburban): math 35% / reading 51% proficiency, ranked #197 of 291 in WA (top 68%) — families likely to look elsewhere, expect single-tenant / working-renter base with shorter leases.
- Market conditions: Rents rising (+1.4%/yr); 227 active listings in the ZIP; 13 comparable units currently listed for rent nearby; rentals leasing fast (median 10d on market — plan ~1-2 weeks tenant-placement turnaround); solid renter incomes; 3,209 units permitted in Pierce County in 2024 (1,269 in 5+ unit buildings).
Forward outlook
- Local home prices are declining (-3.0%/yr); year-one equity from $843 of loan paydown is wiped out by about $4k of value loss. Plan a longer hold.
- Pierce County population projected at +26% by 2050 — long-run rental-demand tailwind backs the buy-and-hold thesis.
- At projected returns (-3.0% appreciation + 1.4% rent growth), your $34k cash investment doubles in ~6 years — after that, you're playing with house money.
Negotiation context
- It's been on market 158 days — a 12% lower offer ($107k) is reasonable based on typical stale-listing flexibility.
- 2 sale attempts since 3y ago; this cycle's ask has dropped $28k (19%) from the opening price — seller is motivated, your offer sets the floor, not the list.
- Current owner paid $73k; list at $122k implies a 67% gain — meaningful room to come down on a strong offer.
Questions for the listing agent
- It's been on market 158 days. Have you received any prior offers? Is the seller open to a 12% concession, seller financing, or rate buy-down credit?
- Why hasn't it sold? Are there any deal-killer items the seller is aware of (foundation, flood, title, zoning, code violations)?
- Is there a deadline driving the sale (1031 exchange, divorce, estate, relocation)? That informs how much negotiation room exists.
- Schools are D-rated, which usually means shorter tenancies and higher turnover. Who's the typical renter profile here, and what's been the actual vacancy rate?
- What's the average days-on-market for RENTAL listings here right now (not sales)? A rising rental-DOM trend means longer vacancies and softer asking-rent achievability than the comps imply.
- What's the recent tenant-quality profile in this submarket — average credit score on applications, eviction rate, late-payment / NSF rate, and stable-employment percentage? A property-management company in the area should have these aggregated.
- How much new for-sale + rental construction is in the pipeline within 1–3 miles? Heavy new supply typically softens prices + rents 12–24 months out; constrained supply supports both.
Investment metrics
- 1% rule
- 1.54% ✓
- Cap rate
- 13.08%
- Cash-on-cash
- 24.24%
- DSCR
- 2.08
- GRM
- 5.4
CMA / ARV
- ARV (median comp)
- $95,387
- List price
- $122,000
- Delta
- 27.90%
- Verdict
- OVERPRICED
- Comps
- 2 within 1.0 mi
Show comp detail 3 sales within ~0.75 mi
| Address | Dist | Beds/Ba | Sqft | Sold | Price | $/sf | Match |
|---|---|---|---|---|---|---|---|
| 9314 Canyon Rd E #4 | 0.00mi | 2/1.5 (-1) | 924 (-14%) | 7mo | $55,000 | $60 | 63 |
| 9314 Canyon Rd E #33 | 0.00mi | 2/2.0 (-1) | 924 (-14%) | 12mo | $25,000 | $27 | 61 |
| 9314 Canyon Rd E | 0.00mi | 2/2.0 (-1) | 1,238 (+15%) | 24mo | $52,500 | $42 | 51 |
Match score weights: distance 35% · size 25% · config 20% · recency 20%. Top-matched comps best support the ARV.
Projected returns pro-forma
-3.0% appreciation · 1.41% rent growth · sell at horizon
- IRR
- 15.8%
- Equity multiple
- 1.62×
- Total profit
- $21,216
- Equity at exit
- $18,191
- IRR
- 23.2%
- Equity multiple
- 2.85×
- Total profit
- $63,309
- Equity at exit
- $10,548
Cash invested: $34,160 (down + closing). Projections, not guarantees.
Landlord ↔ Tenant lean methodology
- Overall (STATE)
- 28 Tenant-Leaning
- State Washington
- 28 Tenant-Leaning · D+8
- County
- — inherits STATE
- City
- — inherits STATE
ZIP-level market 98371
- Rents YoY
- 1.4%
- Active inventory
- 227
- Price-to-rent
- 5.4×
Monthly cashflow live
- Estimated rent
- $1,874 high interval (Pro) →
- Mortgage (P&I)
- −$640
- Tax from tax record
- −$100 /mo · $1,198/yr
- Insurance
- −$51
- HOA
- −$0
- Vacancy / Maint / Mgmt
- −$394
- Net cashflow
- $690
Break-even live
UW: 25.0% down · 7.5% · 30yr · 1.5% tax · 5.0% vac · 8.0% maint · 8.0% mgmt
Financing live
Cash to close
- Down payment
- $30,500
- Closing costs
- $3,660
- Reserves months
- —
- Total cash needed
- —
Loan-product check · same deal, 3 products live
Conventional
25% down · 7.5% · 30yr
- Down + closing
- —
- Monthly P&I
- —
- Monthly cashflow
- —
- DSCR
- —
- Eligible?
- —
Personal DTI + credit; lowest rate.
DSCR
20% down · 8.5% · 30yr
- Down + closing
- —
- Monthly P&I
- —
- Monthly cashflow
- —
- DSCR
- —
- Eligible?
- —
No personal income docs; deal must DSCR.
Hard money
10% down · 12.0% · 12mo
- Down + closing
- —
- Monthly P&I
- —
- Monthly cashflow
- —
- DSCR
- —
- Eligible?
- —
Short-term bridge; refi at stabilization.
Rent comps 13 comps
| Address | Beds | Baths | Sqft | Rent | $/sqft | DOM | Units | Dist |
|---|---|---|---|---|---|---|---|---|
| 9020 Pipeline Rd E Apt 3 Tacoma, WA | 2.0 | 1.0 | 790 | $1,450 | $1.84 | 43d | 1 | 0.14mi |
| 9020 Pipeline Rd E Unit 4 Tacoma, WA | 2.0 | 1.0 | 790 | $1,515 | $1.92 | 43d | 1 | 0.14mi |
| 9012 Pipeline Rd E Unit 7 Tacoma, WA | 2.0 | 1.0 | 790 | $1,495 | $1.89 | 4d | 1 | 0.16mi |
| 2506 103rd St E Puyallup, WA | 2.0 | 1.0 | 1025 | $1,877 | $1.83 | 4d | 3 | 0.72mi |
| 4016 84th St E Tacoma, WA | 3.0 | 1.0 | 940 | $1,695 | $1.80 | 10d | 1 | 0.87mi |
| 8222 Pipeline Rd E Tacoma, WA | 2.0 | 1.0 | 785 | $1,895 | $2.41 | 43d | 1 | 0.97mi |
| 10823 50th Ave E Tacoma, WA | 1.0–2.0 | 1.0–2.0 | 916 | $2,391 | $2.61 | 1d | 3 | 1.07mi |
| 6406 104th St E Unit 6402 Puyallup, WA | 2.0 | 1.0 | 900 | $1,600 | $1.78 | 43d | 1 | 1.07mi |
| 5923 111th Street Ct E Puyallup, WA | 3.0 | 2.5 | 1364 | $2,600 | $1.91 | 1d | 1 | 1.24mi |
| 6115 111th St E Puyallup, WA | 1.0–3.0 | 1.0–2.0 | 911 | $2,391 | $2.62 | 1d | 16 | 1.27mi |
| 5909 111th Street Ct E Puyallup, WA | 3.0 | 2.5 | 1356 | $2,395 | $1.77 | 14d | 1 | 1.27mi |
| 5617 112th St E Puyallup, WA | 1.0–3.0 | 1.0–2.0 | 947 | $2,195 | $2.32 | 11d | 17 | 1.29mi |
| 9604 S Fruitland Unit 7502 Puyallup, WA | 2.0 | 2.0 | 1492 | $2,500 | $1.68 | 1d | 1 | 1.42mi |
Listing history 16 events
-
2026-06-09days on market $122,000 Active 158 DOM
-
2026-06-08days on market $122,000 Active 157 DOM
-
2026-06-07days on market $122,000 Active 156 DOM
-
2026-06-04days on market $122,000 Active 153 DOM
-
2026-06-03days on market $122,000 Active 152 DOM
-
2026-06-02days on market $122,000 Active 151 DOM
-
2026-06-01days on market $122,000 Active 150 DOM
-
2026-05-31days on market $122,000 Active 149 DOM
-
2026-04-11price $130,000
-
2026-02-27price $135,000
-
2026-01-22price $140,000
-
2026-01-02$150,000 Active
-
2024-03-13soldstatus $73,000 Closed
-
2024-02-22status Pending
-
2024-01-23price $84,500
-
2023-11-29$93,000 Active
ⓘ Source: listings_history table (triggers on properties + properties_extension) + one-shot
backfill from property_details.listing_events for pre-trigger history.
Tax reassessment forecast WA · Resets to sale price
- Current annual tax
- $1,198 · $100/mo
- Projected year-2 tax
- $1,198 · $100/mo
- Expected delta
- $0/yr ($0/mo · 0.0%)
ⓘ Screening estimate from a state-policy table — verify with the county assessor before closing.
Climate risk First Street
- Flood 1/10 Low FEMA zone X (unshaded) · 0% chance over 30 yrs
- Wildfire 1/10 Low
- Heat 3/10 Moderate 7 d/yr ≥87°F today · 14 d/yr by 30 yrs out
- Wind 1/10 Low
- Air quality 7/10 Severe 10 unhealthy d/yr today · 12 by 30 yrs out
Nearby sold comps map
Loading sold comps map…
Walkable amenities ~0.75 mi
Loading nearby amenities…
Taxation est. · year 1
- Rental income
- $22,487
- − Mortgage interest
- −$6,834
- − Property taxes
- −$1,198
- − Insurance
- −$610
- − Repairs & maintenance
- −$1,799
- − Management
- −$1,799
- − Depreciation
- −$3,549
- Taxable income
- $6,698
- Est. tax owed @ 24.0%
- −$1,607
- After-tax cash flow
- $6,671/yr
For passive investors: Depreciation is non-cash, so a rental often shows a tax loss while cash-flowing — sheltering income. Rental losses are passive: they offset passive income freely, and up to $25,000/yr can offset ordinary (W-2) income if you actively participate and your MAGI is under $100k (phasing out to $0 by $150k); unused losses carry forward. On sale, claimed depreciation is recaptured at up to 25%, and gains may owe capital-gains tax (a 1031 exchange can defer both). Figures are a year-1 estimate at your 24.0% rate — not tax advice; consult a CPA.
Schools (NCES district)
- District
- Franklin Pierce School District
- NCES district ID
- 5302940
- Math proficiency
- 35% ▬ 0.00%
- Reading proficiency
- 51% ▲ 2.00%
- Median HH income
- $49,240
- Composite
- 39.18/100
- National rank
- #8227
- State rank
- #197 of 291 in WA
Livability — Summit
- Score
- 66/100
- State rank
- #318
- US rank
- #11661
Category grades
Schools grade is shown separately in the Schools card above.
Census & demographics
- Census place
- Summit, WA
- County
- Pierce County · 788,257 people
- Metro
- Seattle-Tacoma-Bellevue, WA
- Population (ZIP)
- 24,682
- Household income
- $97,242
- Rent vs Own
- Severe rent burden
- 507.0
Population outlook (Pierce County) Hauer SSP2
- Today (2025)
- 956,648 people
- By 2030
- 1,010,862 · +5.7%
- By 2040
- 1,113,170 · +16.4%
- By 2050
- 1,206,524 · +26.1%
- By 2075
- 1,436,425 · +50.2%
- By 2100
- 1,563,654 · +63.5%
Race, ethnicity, and origin ACS 2023
- Neighborhood character
- Predominantly White (70%)
- Race & ethnicity
- White 70% Two or more races 12% Hispanic / Latino 11% Asian 6% Black 4%
- Hispanic origin (detail)
- Mexican 9%
- Common ancestry
- Portuguese 5% Slovak 3% Italian 2%
- Foreign-born
- 10% · Canada, South Korea, Vietnam
- Languages at home
- 85% English-only · Spanish 5% Korean 2% Vietnamese 2%
Political lean MEDSL · Pierce
- 2024 margin
- D (+10.8) · D 53.9% · R 43.1% · Other 3.0%
- 2008→2024 swing
- -1.4pp toward R · 2008: 12.2pp · 2024: 10.8pp
- All cycles
- 2024: D+10.8 2020: D+11.2 2016: D+7.5 2012: D+11.0 2008: D+12.2
Not yet ingested
- Civics
- —
Market trends
- HPI YoY
- ▼ -580.45%
- Current HPI
- 295.2143
- Rent YoY
- ▲ 1.41%
- Metro
- Seattle-Tacoma-Bellevue, WA
- State GDP YoY
- ▲ 4.65%
- F500 in state
- 22
Industry mix (Fortune 500 HQ in WA)
| Industry | F500 HQs | Revenue |
|---|---|---|
| Retail | 2 | $269B |
|
||
| Technology / Retail | 1 | $638B |
|
||
| Technology | 1 | $245B |
|
||
| Telecommunications | 1 | $38B |
|
||
| Food / Beverage | 1 | $36B |
|
||
| Automotive / Trucks | 1 | $34B |
|
||
Price history
+39.8% since first listed8 events — show timeline
- 2026-04-11 Price Changed $130,000 NWMLS as Distributed by MLS Grid
- 2026-02-27 Price Changed $135,000 NWMLS as Distributed by MLS Grid
- 2026-01-22 Price Changed $140,000 NWMLS as Distributed by MLS Grid
- 2026-01-02 Listed $150,000 NWMLS as Distributed by MLS Grid
- 2024-03-13 Sold (MLS) $73,000 NWMLS as Distributed by MLS Grid
- 2024-02-22 Pending — NWMLS as Distributed by MLS Grid
- 2024-01-23 Price Changed $84,500 NWMLS as Distributed by MLS Grid
- 2023-11-29 Listed $93,000 NWMLS as Distributed by MLS Grid
Property tax history
+10.1%/yrLatest (2026): $1,198 · +11.3% YoY. Source: county tax records.
Cash-flow waterfall
monthlySold comps — $/sqft
last 12 mo · ≤1 miLoading sold comps…