17 Main St · Waverly, NY
Flood risk No data
- FEMA flood zone
- —
- Chance of flooding over 30 yrs
- —
- Est. flood insurance / yr
- —
Fire risk No data
- Est. fire insurance / yr
- —
Heat risk No data
- Hot days now (above threshold)
- —
- Hot days in 30 yrs
- —
Wind risk No data
- Chance of severe wind over 30 yrs
- —
Air-quality risk No data
- Unhealthy air days now
- —
- Unhealthy air days in 30 yrs
- —
Risk factors via First Street. Map © Google.
Why this score? — see what drove the B+ grade
The composite is a weighted blend of 9 inputs, each scored 0–100. Each bar is that input's sub-score; the figure is the points it added to the 100-point composite (weight × sub-score).
- Cash flow +30.0/30.0
- 1% rule +10.0/10.0
- DSCR +10.0/10.0
- ARV discount +7.5/15.0
- Appreciation +7.0/10.0
- Schools +3.7/10.0
- Livability +3.4/5.0
- Rent growth +2.5/5.0
- Condition / age +1.0/5.0
$35,000
🖨 Deal sheet 📄 Offer letter ✓ Due diligence
Listing remarks
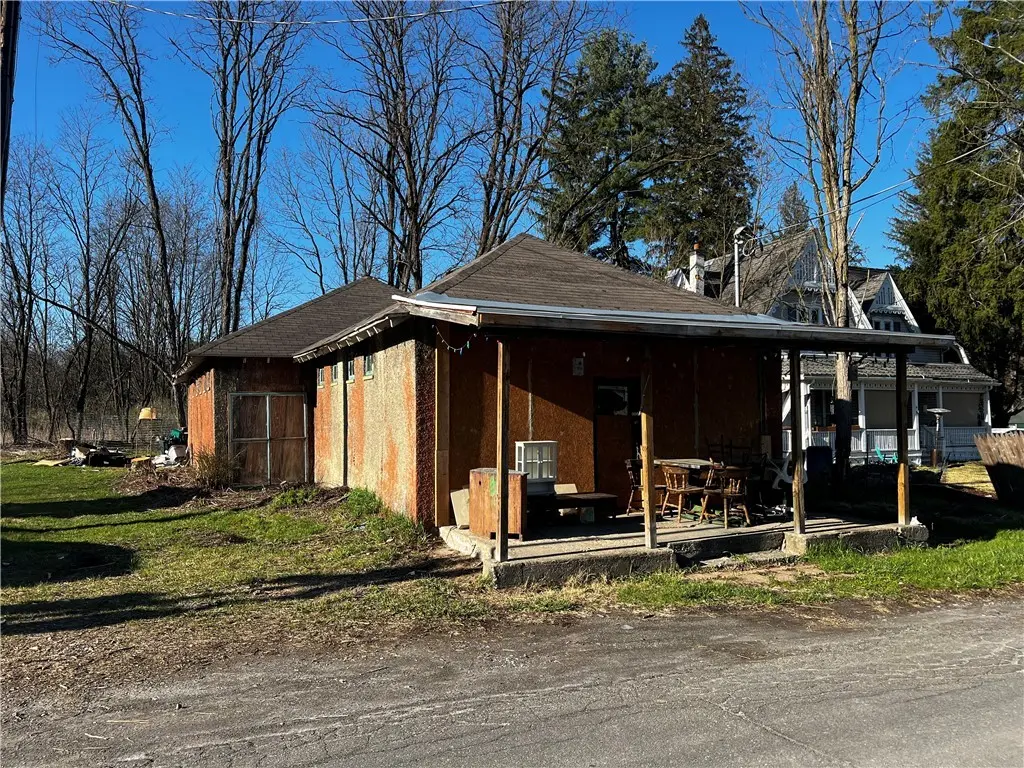
Truly a diamond in the rough! A blank canvas with big potential. Turn this into you own home or a rental! Originally a post office, Then an Art Studio for a local artist ! Seller's plan was to rehab and turn into a rental property. Business with living area! This building is begging to be brought back to life! Bring your tools and imagination see the potential here. Directions: From Waverly NY Take NY -34 N to Main Street, Lockwood Property will be on the Right Just before the RR Tracks Property As Is Condition there is a Well and Septic location unknown. Plumbing to half bath, commode and shop sink. Also Refer to Listing R1674476
Key facts
- 5,227 sq ft lot
- Built 1920
- Listed 9 days
Property features AI
Exterior
- Parking: No garage; No driveway
- Utilities: Electricity connected; Septic tank; Well water
- Home design: Single-story property; Existing/resale condition
- Construction: Block foundation; Block, concrete and stucco construction; Asphalt roof
- Exterior features: Owned propane tank; Rectangular lot (approx. 42 x 83)
Interior
- Bedrooms: One bedroom on the main level
- Flooring: Hardwood; Varies
- Bathrooms: One full bathroom; One half bathroom
- Heating & cooling: Propane heating
- Interior features: Loft; Some interiors vary in finish; see remarks
- Laundry & utility: Electric water heater
Neighborhood map
What this means for you Summary
Snapshot
- This is a 1-bed/0.5-bath single-family listed at $35k. Condition is rated poor.
Deal economics
- At list price, monthly cash flow is $549 ($7k/yr) — positive.
- The deal already cash-flows at list — no discount required.
- Meets the 1% rule at list price ($1k rent vs $35k).
- Cap rate 25.1% vs local median 4.6% in Waverly — top-decile yield for the area; either an underpriced asset or a hidden risk that comps aren't pricing in. Stress-test before assuming the spread holds.
Location & tenants
- Location reads 67/100 on livability (#569 in NY) — a middle-class / working-renter tenant base. Strengths: cost of living A+, housing A+, health & safety A; Watch: amenities F, commute F, employment F.
- Waverly Central School District (town): math 41% / reading 46% proficiency, ranked #480 of 590 in NY (top 81%) — families likely to look elsewhere, expect single-tenant / working-renter base with shorter leases.
- Market conditions: 9 active listings in the ZIP; 139 units permitted in Tioga County in 2024 (65 in 5+ unit buildings).
Forward outlook
- In year one you build about $2k of equity ($242 loan paydown + $1k appreciation (4.0% local appreciation)).
- Tioga County population projected at -27% by 2050 — secular population decline; favor cash flow + early exit over multi-decade hold.
- At projected returns (4.0% appreciation + 3.0% rent growth), your $10k cash investment doubles in ~2 years — after that, you're playing with house money.
Negotiation context
- Only 9 days on market — expect competitive offers; lowballing is unlikely to land.
Risks & watch-outs
- Watch-outs: built in 1920 — expect roof / HVAC / electrical / plumbing capex.
Questions for the listing agent
- Have any recent inspections been done? Can we get a copy of the seller's disclosures and any deferred-maintenance estimates?
- Built in 1920 — when were the roof, HVAC, electrical panel, plumbing, and water heater last replaced?
- Is there a deadline driving the sale (1031 exchange, divorce, estate, relocation)? That informs how much negotiation room exists.
- What's the average days-on-market for RENTAL listings here right now (not sales)? A rising rental-DOM trend means longer vacancies and softer asking-rent achievability than the comps imply.
- What's the recent tenant-quality profile in this submarket — average credit score on applications, eviction rate, late-payment / NSF rate, and stable-employment percentage? A property-management company in the area should have these aggregated.
- How much new for-sale + rental construction is in the pipeline within 1–3 miles? Heavy new supply typically softens prices + rents 12–24 months out; constrained supply supports both.
Investment metrics
- 1% rule
- 2.86% ✓
- Cap rate
- 25.10%
- Cash-on-cash
- 67.18%
- DSCR
- 3.99
- GRM
- 2.9
CMA / ARV
- ARV (on-the-fly)
- $83,622
- Comps found
- 1
Show comp detail 1 sale within ~0.75 mi
| Address | Dist | Beds/Ba | Sqft | Sold | Price | $/sf | Match |
|---|---|---|---|---|---|---|---|
| 5 Cayuta Ave | 0.20mi | 2/1.0 (+1) | 968 (-11%) | 11mo | $75,000 | $77 | 56 |
Match score weights: distance 35% · size 25% · config 20% · recency 20%. Top-matched comps best support the ARV.
Projected returns pro-forma
4.04% appreciation · 3.0% rent growth · sell at horizon
- IRR
- 72.9%
- Equity multiple
- 5.20×
- Total profit
- $41,146
- Equity at exit
- $17,832
- IRR
- 71.6%
- Equity multiple
- 10.71×
- Total profit
- $95,201
- Equity at exit
- $29,236
Cash invested: $9,800 (down + closing). Projections, not guarantees.
Landlord ↔ Tenant lean methodology
- Overall (STATE)
- 15 Strongly Tenant-Friendly
- State New York
- 15 Strongly Tenant-Friendly · D+10
- County
- — inherits STATE
- City
- — inherits STATE
ZIP-level market 14859
- Home prices YoY
- 1.5%
- Active inventory
- 9
- Price-to-rent
- 2.9×
Monthly cashflow live
- Estimated rent
- $1,001 medium interval (Pro) →
- Mortgage (P&I)
- −$184
- Tax est. 1.5%
- −$44 /mo · $525/yr
- Insurance
- −$15
- HOA
- −$0
- Vacancy / Maint / Mgmt
- −$210
- Net cashflow
- $549
Break-even live
UW: 25.0% down · 7.5% · 30yr · 1.5% tax · 5.0% vac · 8.0% maint · 8.0% mgmt
Financing live
Cash to close
- Down payment
- $8,750
- Closing costs
- $1,050
- Reserves months
- —
- Total cash needed
- —
Loan-product check · same deal, 3 products live
Conventional
25% down · 7.5% · 30yr
- Down + closing
- —
- Monthly P&I
- —
- Monthly cashflow
- —
- DSCR
- —
- Eligible?
- —
Personal DTI + credit; lowest rate.
DSCR
20% down · 8.5% · 30yr
- Down + closing
- —
- Monthly P&I
- —
- Monthly cashflow
- —
- DSCR
- —
- Eligible?
- —
No personal income docs; deal must DSCR.
Hard money
10% down · 12.0% · 12mo
- Down + closing
- —
- Monthly P&I
- —
- Monthly cashflow
- —
- DSCR
- —
- Eligible?
- —
Short-term bridge; refi at stabilization.
Listing history 8 events
-
2026-06-18days on market $35,000 Active 9 DOM
-
2026-06-17days on market $35,000 Active 8 DOM
-
2026-06-16days on market $35,000 Active 7 DOM
-
2026-06-15days on market $35,000 Active 6 DOM
-
2026-06-13days on market $35,000 Active 4 DOM
-
2026-06-12days on market $35,000 Active 3 DOM
-
2026-06-09remarks 641-char remark
-
2026-06-09$35,000 Active 1 DOM
ⓘ Source: listings_history table (triggers on properties + properties_extension) + one-shot
backfill from property_details.listing_events for pre-trigger history.
Nearby sold comps map
Loading sold comps map…
Walkable amenities ~0.75 mi
Loading nearby amenities…
Taxation est. · year 1
- Rental income
- $12,008
- − Mortgage interest
- −$1,961
- − Property taxes
- −$525
- − Insurance
- −$175
- − Repairs & maintenance
- −$961
- − Management
- −$961
- − Depreciation
- −$1,018
- Taxable income
- $6,408
- Est. tax owed @ 24.0%
- −$1,538
- After-tax cash flow
- $5,046/yr
For passive investors: Depreciation is non-cash, so a rental often shows a tax loss while cash-flowing — sheltering income. Rental losses are passive: they offset passive income freely, and up to $25,000/yr can offset ordinary (W-2) income if you actively participate and your MAGI is under $100k (phasing out to $0 by $150k); unused losses carry forward. On sale, claimed depreciation is recaptured at up to 25%, and gains may owe capital-gains tax (a 1031 exchange can defer both). Figures are a year-1 estimate at your 24.0% rate — not tax advice; consult a CPA.
Condition & rehab AI · 12 photos
This property requires extensive rehabilitation to bring it up to a livable condition. Significant structural and systems repairs are needed to make it move-in ready.
Repairs flagged
- Major Exterior siding — Severe peeling and damage
- Major Interior walls — Exposed ceiling beams and missing fixtures
- Major Flooring — Damaged and uneven
- Major Roof — Visible damage and potential leaks
- Major Plumbing — No visible plumbing in good condition
- Major Electrical — No visible electrical in good condition
- Major HVAC — No visible HVAC in good condition
Value-add opportunities
- Both Rehabilitation of exterior siding — Improves curb appeal and structural integrity
- Both Interior wall repairs and paint — Enhances interior aesthetics and living space
- Both Flooring replacement — Improves comfort and functionality
- Both Roof repair or replacement — Prevents water damage and extends property lifespan
- Both Plumbing and electrical upgrades — Ensures safety and functionality
- Both HVAC system installation — Improves comfort and energy efficiency
Renovation cost estimate screening
| Repair item | Severity | Est. cost |
|---|---|---|
| Exterior siding · Severe peeling and damage | Major | $15,000–50,000 |
| Interior walls · Exposed ceiling beams and missing fixtures | Major | $15,000–50,000 |
| Flooring · Damaged and uneven | Major | $15,000–50,000 |
| Roof · Visible damage and potential leaks | Major | $15,000–50,000 |
| Plumbing · No visible plumbing in good condition | Major | $15,000–50,000 |
| Electrical · No visible electrical in good condition | Major | $15,000–50,000 |
| HVAC · No visible HVAC in good condition | Major | $15,000–50,000 |
| Total estimated repair cost · 7 items | $105,000–350,000 |
Value-add ROI direction
- Both Rehabilitation of exterior siding — Improves curb appeal and structural integrity ↑
- Both Interior wall repairs and paint — Enhances interior aesthetics and living space ↑
- Both Flooring replacement — Improves comfort and functionality ↑
- Both Roof repair or replacement — Prevents water damage and extends property lifespan ↑
- Both Plumbing and electrical upgrades — Ensures safety and functionality ↑
- Both HVAC system installation — Improves comfort and energy efficiency ↑
ⓘ Cost ranges are severity-bucket heuristics (US national rule-of-thumb). Get contractor quotes + a written scope before underwriting a rehab budget.
Schools (NCES district)
- District
- Waverly Central School District
- NCES district ID
- 3630270
- Math proficiency
- 41% ▼ -4.00%
- Reading proficiency
- 46% ▲ 8.00%
- Median HH income
- $44,935
- Composite
- 36.9/100
- National rank
- #4544
- State rank
- #480 of 590 in NY
Livability — Waverly
- Score
- 67/100
- State rank
- #569
- US rank
- #10246
Category grades
Schools grade is shown separately in the Schools card above.
Census & demographics
- Population (ZIP)
- 1,100
Population outlook (Tioga County) Hauer SSP2
- Today (2025)
- 45,155 people
- By 2030
- 42,801 · -5.2%
- By 2040
- 37,960 · -15.9%
- By 2050
- 33,071 · -26.8%
- By 2075
- 24,144 · -46.5%
- By 2100
- 16,545 · -63.4%
Race, ethnicity, and origin ACS 2023
- Neighborhood character
- Predominantly White (97%)
- Race & ethnicity
- White 97% Two or more races 2%
- Common ancestry
- Serbian 4% Italian 2% Polish 2%
- Foreign-born
- 0% · China
Political lean MEDSL · Tioga
- 2024 margin
- Strong R (+22.9) · D 38.6% · R 61.4%
- 2008→2024 swing
- -12.7pp toward R · 2008: -10.2pp · 2024: -22.9pp
- All cycles
- 2024: R+22.9 2020: R+20.6 2016: R+27.6 2012: R+15.1 2008: R+10.2
Not yet ingested
- Civics
- —
Market trends
- HPI YoY
- ▲ 4.04%
- Current HPI
- 280.4947
- Rent YoY
- —
- Metro
- —
- State GDP YoY
- ▲ 2.60%
- F500 in state
- 92
Industry mix (Fortune 500 HQ in NY)
| Industry | F500 HQs | Revenue |
|---|---|---|
| Financial Services | 10 | $950B |
|
||
| Consumer Goods | 9 | $162B |
|
||
| Insurance | 4 | $225B |
|
||
| Telecommunications | 2 | $144B |
|
||
| Pharmaceuticals | 2 | $112B |
|
||
| Media / Entertainment | 2 | $69B |
|
||
Price history
1 event — show timeline
- 2026-06-09 Listed $35,000 UNYREIS
Cash-flow waterfall
monthlySold comps — $/sqft
last 12 mo · ≤1 miLoading sold comps…