450 Avant Ave · San Antonio, TX
Flood risk 1/10 · Minimal
- FEMA flood zone
- X (unshaded)
- Chance of flooding over 30 yrs
- 0.0%
- Est. flood insurance / yr
- $507 – $1,088
Fire risk 1/10 · Minimal
- Est. fire insurance / yr
- $1,222 – $2,270
Heat risk 8/10 · Major
- Hot days now (above 108°F)
- 7 days/yr
- Hot days in 30 yrs
- 22 days/yr
Wind risk 8/10 · Major
- Chance of severe wind over 30 yrs
- 80.0%
Air-quality risk 2/10 · Minimal
- Unhealthy air days now
- 1 days/yr
- Unhealthy air days in 30 yrs
- 2 days/yr
Risk factors via First Street. Map © Google.
Why this score? — see what drove the B- grade
The composite is a weighted blend of 9 inputs, each scored 0–100. Each bar is that input's sub-score; the figure is the points it added to the 100-point composite (weight × sub-score).
- Cash flow +30.0/30.0
- 1% rule +10.0/10.0
- DSCR +10.0/10.0
- ARV discount +7.5/15.0
- Livability +4.0/5.0
- Rent growth +2.8/5.0
- Condition / age +2.5/5.0
- Schools +1.4/10.0
- Appreciation +0.0/10.0
$69,999
🖨 Deal sheet 📄 Offer letter ✓ Due diligence
Listing remarks MLS
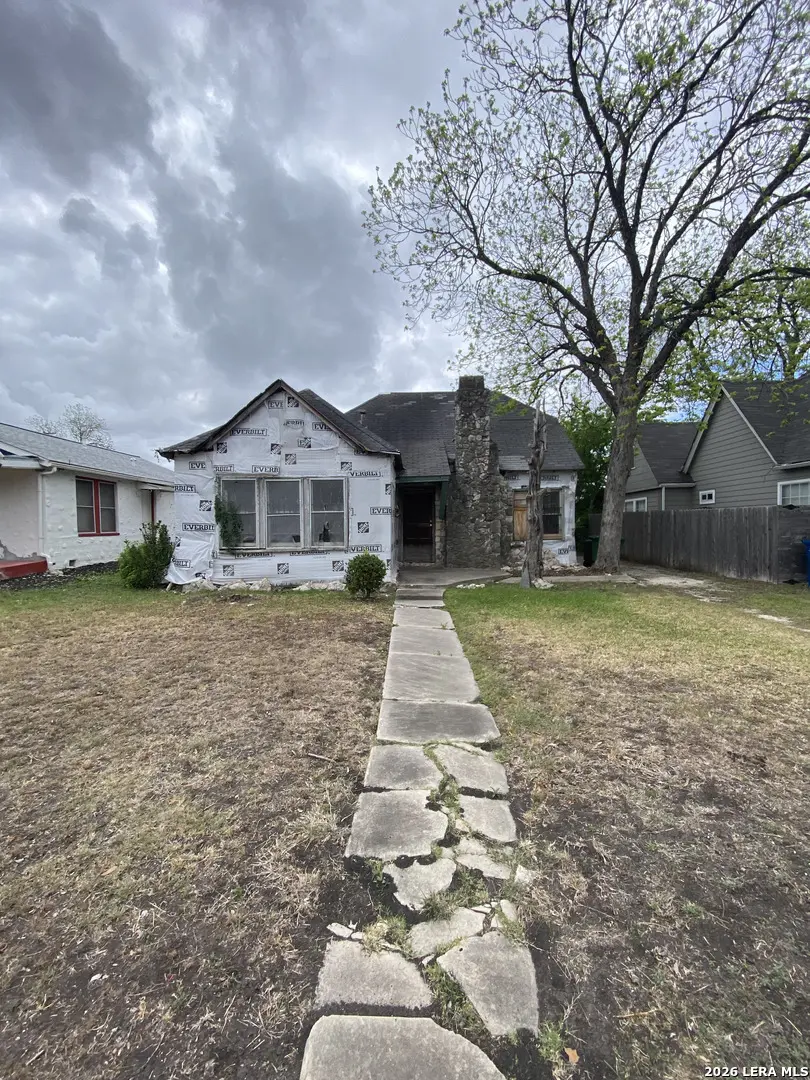
The most affordable home to hit the market in Highland Park in over two years. Nothing has been priced this low across active, sold, expired, or canceled listings in at least 24 months. Priced for a full renovation and ready for your vision. Two bedroom, one bath stone home on a generous 7,500 sqft lot in one of San Antonio's hottest revitalizing neighborhoods, minutes from downtown. 1,293 sqft of classic 1928 construction with stone exterior, central A/C, forced air heat, and pier & beam foundation. Incredible opportunity for investors, flippers, and builders looking to create serious equity in a neighborhood with strong appreciation. Fix and flip it, rent it, or make it your own. Sold strictly AS IS WHERE IS. No repairs. No inspections. No survey. Exempt from Seller's Disclosure. Buyer responsible for verifying all taxes, measurements, dimensions, and data. Room sizes not available. Proper footwear recommended when viewing. At this price in Highland Park, this will not last. Schedule your showing today.
Key facts
- Generous lot
- Stone home
- Forced air heat
Tags
Neighborhood map
What this means for you Summary
Snapshot
- This is a 2-bed/1.0-bath single-family listed at $70k.
Deal economics
- At list price, monthly cash flow is $678 ($8k/yr) — positive.
- The deal already cash-flows at list — no discount required.
- Meets the 1% rule at list price ($1k rent vs $70k).
- Recommended offer: $68k (3.0% below list) — sets the bar for market timing.
- Cap rate 17.9% vs local median 3.8% in San Antonio — top-decile yield for the area; either an underpriced asset or a hidden risk that comps aren't pricing in. Stress-test before assuming the spread holds.
Location & tenants
- Location reads 80/100 on livability (#31 in TX, #1,616 nationally) — a professional / high-income tenant draw. Strengths: amenities A+, commute A+, cost of living A+; Watch: schools C-, crime F.
- San Antonio ISD (urban): math 12% / reading 22% proficiency, ranked #805 of 826 in TX (top 98%) — low school quality limits family demand, transient renter base, plan for 1-2y turnover; 80% free/reduced lunch — lower-income household profile, screen leases tightly.
- Market conditions: Rents rising (+1.1%/yr); 269 active listings in the ZIP; 40 comparable units currently listed for rent nearby; rentals at typical pace (median 24d on market — plan ~3-4 weeks tenant-placement turnaround); 8,308 units permitted in Bexar County in 2024 (2,506 in 5+ unit buildings).
- This rent runs 32% of the median local income ($55k/yr) — at the standard rent-burdened threshold; future hikes will face affordability resistance.
Forward outlook
- Local home prices are declining (-3.0%/yr); year-one equity from $484 of loan paydown is wiped out by about $2k of value loss. Plan a longer hold.
- Bexar County population projected at +50% by 2050 — long-run rental-demand tailwind backs the buy-and-hold thesis.
- At projected returns (-3.0% appreciation + 1.1% rent growth), your $20k cash investment doubles in ~3 years — after that, you're playing with house money.
Negotiation context
- It's been on market 48 days — a 3% lower offer ($68k) is reasonable based on typical stale-listing flexibility.
Risks & watch-outs
- Watch-outs: built in 1928 — expect roof / HVAC / electrical / plumbing capex.
- Climate carrying-cost: severe wind risk, 80% chance of damaging wind over 30y; extreme-heat days projected 7→22/yr by 2055 (HVAC capex compounding) — expect insurance premiums to compound above CPI over the hold.
Questions for the listing agent
- It's been on market 48 days. Have you received any prior offers? Is the seller open to a 3% concession, seller financing, or rate buy-down credit?
- Built in 1928 — when were the roof, HVAC, electrical panel, plumbing, and water heater last replaced?
- Is there a deadline driving the sale (1031 exchange, divorce, estate, relocation)? That informs how much negotiation room exists.
- Crime grade is F in this area — have there been break-ins, vandalism, or insurance claims at this property in the last 3 years? What carrier currently insures it and at what premium?
- What's the average days-on-market for RENTAL listings here right now (not sales)? A rising rental-DOM trend means longer vacancies and softer asking-rent achievability than the comps imply.
- What's the recent tenant-quality profile in this submarket — average credit score on applications, eviction rate, late-payment / NSF rate, and stable-employment percentage? A property-management company in the area should have these aggregated.
- How much new for-sale + rental construction is in the pipeline within 1–3 miles? Heavy new supply typically softens prices + rents 12–24 months out; constrained supply supports both.
Investment metrics
- 1% rule
- 2.10% ✓
- Cap rate
- 17.92%
- Cash-on-cash
- 41.52%
- DSCR
- 2.85
- GRM
- 4.0
CMA / ARV
- ARV (median comp)
- $174,115
- List price
- $69,999
- Delta
- -59.80%
- Verdict
- UNDERPRICED
- Comps
- 20 within 1.0 mi
Show comp detail 12 sales within ~0.75 mi
| Address | Dist | Beds/Ba | Sqft | Sold | Price | $/sf | Match |
|---|---|---|---|---|---|---|---|
| 1434 Hicks Ave | 0.33mi | 3/1.0 (+1) | 1,340 (+4%) | 0mo | $150,000 | $112 | 73 |
| 738 Avant | 0.37mi | 3/2.0 (+1) | 1,306 (+1%) | 1mo | $224,999 | $172 | 71 |
| 543 Kayton | 0.22mi | 2/1.0 | 1,144 (-12%) | 2mo | $175,500 | $153 | 69 |
| 1411 Mckinley | 0.22mi | 3/1.0 (+1) | 1,420 (+10%) | 2mo | $229,900 | $162 | 66 |
| 810 Avant Ave | 0.44mi | 3/2.0 (+1) | 1,265 (-2%) | 3mo | $245,000 | $194 | 65 |
| 715 Avant | 0.31mi | 2/2.0 | 1,136 (-12%) | 2mo | $210,000 | $185 | 59 |
| 314 Haggin | 0.50mi | 3/1.0 (+1) | 1,227 (-5%) | 6mo | $172,900 | $141 | 58 |
| 902 Bailey | 0.56mi | 3/2.0 (+1) | 1,312 (+2%) | 6mo | $297,900 | $227 | 58 |
| 934 Schley | 0.40mi | 3/1.0 (+1) | 1,124 (-13%) | 3mo | $99,900 | $89 | 52 |
| 743 Avant | 0.38mi | 3/2.0 (+1) | 1,152 (-11%) | 5mo | $235,000 | $204 | 51 |
| 211 Bailey Ave | 0.32mi | 3/2.0 (+1) | 1,454 (+12%) | 6mo | $379,000 | $261 | 50 |
| 1411 E Highland Blvd | 0.72mi | 2/1.0 | 1,407 (+9%) | 4mo | $215,000 | $153 | 49 |
Match score weights: distance 35% · size 25% · config 20% · recency 20%. Top-matched comps best support the ARV.
Projected returns pro-forma
-3.0% appreciation · 1.07% rent growth · sell at horizon
- IRR
- 35.9%
- Equity multiple
- 2.48×
- Total profit
- $29,070
- Equity at exit
- $10,437
- IRR
- 41.6%
- Equity multiple
- 4.57×
- Total profit
- $69,960
- Equity at exit
- $6,052
Cash invested: $19,600 (down + closing). Projections, not guarantees.
Landlord ↔ Tenant lean methodology
- Overall (STATE)
- 87 Strongly Landlord-Friendly
- State Texas
- 87 Strongly Landlord-Friendly · R+5
- County
- — inherits STATE
- City
- — inherits STATE
ZIP-level market 78210
- Rents YoY
- 1.1%
- Active inventory
- 269
- Price-to-rent
- 4.0×
Monthly cashflow live
- Estimated rent
- $1,471 high interval (Pro) →
- Mortgage (P&I)
- −$367
- Tax est. 1.5%
- −$87 /mo · $1,050/yr
- Insurance
- −$29
- HOA
- −$0
- Vacancy / Maint / Mgmt
- −$309
- Net cashflow
- $678
Break-even live
UW: 25.0% down · 7.5% · 30yr · 1.5% tax · 5.0% vac · 8.0% maint · 8.0% mgmt
Financing live
Cash to close
- Down payment
- $17,500
- Closing costs
- $2,100
- Reserves months
- —
- Total cash needed
- —
Loan-product check · same deal, 3 products live
Conventional
25% down · 7.5% · 30yr
- Down + closing
- —
- Monthly P&I
- —
- Monthly cashflow
- —
- DSCR
- —
- Eligible?
- —
Personal DTI + credit; lowest rate.
DSCR
20% down · 8.5% · 30yr
- Down + closing
- —
- Monthly P&I
- —
- Monthly cashflow
- —
- DSCR
- —
- Eligible?
- —
No personal income docs; deal must DSCR.
Hard money
10% down · 12.0% · 12mo
- Down + closing
- —
- Monthly P&I
- —
- Monthly cashflow
- —
- DSCR
- —
- Eligible?
- —
Short-term bridge; refi at stabilization.
Rent comps 40 comps
| Address | Beds | Baths | Sqft | Rent | $/sqft | DOM | Units | Dist |
|---|---|---|---|---|---|---|---|---|
| 510 Avant Ave San Antonio, TX | 1.0 | 1.0 | 956 | $700 | $0.73 | 2d | 1 | 0.06mi |
| 454 Bailey Ave San Antonio, TX | 3.0 | 2.0 | 1674 | $1,495 | $0.89 | 43d | 1 | 0.08mi |
| 523 Bailey Ave San Antonio, TX | 2.0 | 2.0 | 960 | $1,500 | $1.56 | 23d | 1 | 0.10mi |
| 331 Avant Ave San Antonio, TX | 3.0 | 2.0 | 1200 | $1,825 | $1.52 | 23d | 1 | 0.14mi |
| 508 Kayton Ave San Antonio, TX | 2.0 | 1.0 | 1058 | $1,200 | $1.13 | 16d | 1 | 0.17mi |
| 1131 McKinley Ave San Antonio, TX | 2.0 | 1.0 | 1000 | $1,550 | $1.55 | 4d | 1 | 0.24mi |
| 1914 S Pine St San Antonio, TX | 2.0 | 1.0 | 1025 | $1,250 | $1.22 | 43d | 1 | 0.24mi |
| 534 Rigsby Ave San Antonio, TX | 3.0 | 2.0 | 1438 | $1,950 | $1.36 | 23d | 1 | 0.25mi |
| 2219 S New Braunfels Ave San Antonio, TX | 2.0 | 1.0 | 952 | $1,050 | $1.10 | 23d | 1 | 0.30mi |
| 1039 McKinley Ave San Antonio, TX | 3.0 | 3.0 | 1650 | $2,300 | $1.39 | 1d | 1 | 0.30mi |
| 1528 Steves Ave Unit 1 San Antonio, TX | 2.0 | 1.0 | 940 | $1,025 | $1.09 | 43d | 1 | 0.32mi |
| 1444 McKinley Ave San Antonio, TX | 3.0 | 2.0 | 1618 | $2,500 | $1.55 | 23d | 1 | 0.33mi |
| 636 Rigsby Ave San Antonio, TX | 3.0 | 1.0 | 1327 | $1,595 | $1.20 | 43d | 1 | 0.34mi |
| 1510 Steves Ave San Antonio, TX | 3.0 | 2.0 | 1330 | $1,800 | $1.35 | 23d | 1 | 0.34mi |
| 142 Avant Ave #1 San Antonio, TX | 3.0 | 1.0 | 1314 | $1,495 | $1.14 | 17d | 1 | 0.35mi |
| 510 Vanderbilt St San Antonio, TX | 2.0 | 1.0 | 1208 | $1,150 | $0.95 | 43d | 1 | 0.36mi |
| 1627 Schley Ave San Antonio, TX | 3.0 | 1.0 | 1408 | $1,650 | $1.17 | 23d | 1 | 0.50mi |
| 439 Dunning Ave San Antonio, TX | 2.0 | 2.0 | 1050 | $1,500 | $1.43 | 4d | 1 | 0.52mi |
| 838 Hammond Ave San Antonio, TX | 2.0 | 1.0 | 888 | $1,300 | $1.46 | 43d | 1 | 0.60mi |
| 627 Essex St San Antonio, TX | 3.0 | 2.5 | 1402 | $1,850 | $1.32 | 23d | 1 | 0.62mi |
| 518 Topeka Blvd San Antonio, TX | 3.0 | 2.0 | 1135 | $1,375 | $1.21 | 23d | 1 | 0.65mi |
| 531 Essex St Unit 202 San Antonio, TX | 3.0 | 2.5 | 1514 | $2,000 | $1.32 | 23d | 1 | 0.65mi |
| 534 Chicago Blvd Unit NA San Antonio, TX | 3.0 | 2.0 | 1250 | $1,550 | $1.24 | 17d | 1 | 0.69mi |
| 534 Chicago Blvd San Antonio, TX | 3.0 | 2.0 | 1250 | $1,550 | $1.24 | 19d | 1 | 0.69mi |
| 414 Stanfield Ave San Antonio, TX | 3.0 | 1.0 | 1250 | $1,300 | $1.04 | 43d | 1 | 0.69mi |
| 1007 Avant Ave San Antonio, TX | 3.0 | 2.0 | 1632 | $3,200 | $1.96 | 23d | 1 | 0.72mi |
| 1124 Vanderbilt St San Antonio, TX | 3.0 | 1.0 | 1095 | $1,350 | $1.23 | 43d | 1 | 0.73mi |
| 1811 McKinley Ave San Antonio, TX | 2.0 | 2.0 | 1248 | $975 | $0.78 | 2d | 1 | 0.74mi |
| 1811 McKinley Ave San Antonio, TX | 1.0 | 1.0 | 1248 | $975 | $0.78 | 1d | 1 | 0.74mi |
| 704 Fair Ave Unit 200 San Antonio, TX | 2.0 | 1.5 | 1600 | $1,200 | $0.75 | 23d | 1 | 0.76mi |
| 318 Denver Blvd Unit 2 San Antonio, TX | 1.0 | 1.0 | 1560 | $1,100 | $0.71 | 43d | 1 | 0.77mi |
| 343 Porter St #101 San Antonio, TX | 3.0 | 2.5 | 1600 | $2,100 | $1.31 | 4d | 1 | 0.79mi |
| 1146 S Olive St San Antonio, TX | 2.0 | 2.0 | 1276 | $1,800 | $1.41 | 4d | 1 | 0.81mi |
| 517 Hicks Ave San Antonio, TX | 3.0 | 2.0 | 1520 | $1,700 | $1.12 | 43d | 1 | 0.87mi |
| 618 Porter St San Antonio, TX | 1.0 | 1.0 | 1360 | $895 | $0.66 | 4d | 1 | 0.88mi |
| 1221 Delaware St San Antonio, TX | 1.0 | 1.0 | 1300 | $1,200 | $0.92 | 43d | 1 | 0.90mi |
| 730 E Carolina St San Antonio, TX | 1.0 | 1.0 | 1176 | $700 | $0.60 | 23d | 1 | 0.91mi |
| 1022 Delaware St Unit 3 San Antonio, TX | 3.0 | 2.5 | 1244 | $1,850 | $1.49 | 23d | 1 | 0.92mi |
| 134 Lilla Jean Dr San Antonio, TX | 3.0 | 2.0 | 1349 | $1,595 | $1.18 | 23d | 1 | 0.93mi |
| 210 Utah St #101 San Antonio, TX | 3.0 | 2.5 | 1208 | $1,695 | $1.40 | 43d | 1 | 0.93mi |
Listing history 1 events
-
2026-04-12$69,999 New 1036-char remark
Show marketing remark (1036 chars)
The most affordable home to hit the market in Highland Park in over two years. Nothing has been priced this low across active, sold, expired, or canceled listings in at least 24 months. Priced for a full renovation and ready for your vision. Two bedroom, one bath stone home on a generous 7,500 sqft lot in one of San Antonio's hottest revitalizing neighborhoods, minutes from downtown. 1,293 sqft of classic 1928 construction with stone exterior, central A/C, forced air heat, and pier & beam foundation. Incredible opportunity for investors, flippers, and builders looking to create serious equity in a neighborhood with strong appreciation. Fix and flip it, rent it, or make it your own. Sold strictly AS IS WHERE IS. No repairs. No inspections. No survey. Exempt from Seller's Disclosure. Buyer responsible for verifying all taxes, measurements, dimensions, and data. Room sizes not available. Proper footwear recommended when viewing. At this price in Highland Park, this will not last. Schedule your showing today.
ⓘ Source: listings_history table (triggers on properties + properties_extension) + one-shot
backfill from property_details.listing_events for pre-trigger history.
Climate risk First Street
- Flood 1/10 Low FEMA zone X (unshaded) · 0% chance over 30 yrs
- Wildfire 1/10 Low
- Heat 8/10 Severe 7 d/yr ≥108°F today · 22 d/yr by 30 yrs out
- Wind 8/10 Severe 80% chance of damaging wind over 30 yrs
- Air quality 2/10 Low 1 unhealthy d/yr today · 2 by 30 yrs out
Nearby sold comps map
Loading sold comps map…
Walkable amenities ~0.75 mi
Loading nearby amenities…
Taxation est. · year 1
- Rental income
- $17,649
- − Mortgage interest
- −$3,921
- − Property taxes
- −$1,050
- − Insurance
- −$350
- − Repairs & maintenance
- −$1,412
- − Management
- −$1,412
- − Depreciation
- −$2,036
- Taxable income
- $7,468
- Est. tax owed @ 24.0%
- −$1,792
- After-tax cash flow
- $6,346/yr
For passive investors: Depreciation is non-cash, so a rental often shows a tax loss while cash-flowing — sheltering income. Rental losses are passive: they offset passive income freely, and up to $25,000/yr can offset ordinary (W-2) income if you actively participate and your MAGI is under $100k (phasing out to $0 by $150k); unused losses carry forward. On sale, claimed depreciation is recaptured at up to 25%, and gains may owe capital-gains tax (a 1031 exchange can defer both). Figures are a year-1 estimate at your 24.0% rate — not tax advice; consult a CPA.
Schools (NCES district)
- District
- San Antonio ISD
- NCES district ID
- 4838730
- Math proficiency
- 12% ▼ -21.00%
- Reading proficiency
- 22% ▼ -7.00%
- Median HH income
- $30,952
- Composite
- 13.57/100
- National rank
- #9512
- State rank
- #805 of 826 in TX
Livability — San Antonio
- Score
- 80/100
- State rank
- #31
- US rank
- #1616
Category grades
Schools grade is shown separately in the Schools card above.
Census & demographics
- Census place
- San Antonio, TX
- County
- Bexar County · 1,990,555 people
- City population
- 1,806,925
- Metro
- San Antonio-New Braunfels, TX
- Population (ZIP)
- 34,940
- Household income
- $55,028
- Rent vs Own
- Severe rent burden
- 1708.0
Population outlook (Bexar County) Hauer SSP2
- Today (2025)
- 2,336,851 people
- By 2030
- 2,560,728 · +9.6%
- By 2040
- 3,020,569 · +29.3%
- By 2050
- 3,493,522 · +49.5%
- By 2075
- 4,668,459 · +99.8%
- By 2100
- 5,533,242 · +136.8%
Race, ethnicity, and origin ACS 2023
- Neighborhood character
- Predominantly Hispanic (83%)
- Race & ethnicity
- Hispanic / Latino 83% Two or more races 29% White 11% Black 4% Native American 2%
- Hispanic origin (detail)
- Mexican 72% Puerto Rican 2%
- Common ancestry
- Lithuanian 1%
- Foreign-born
- 12% · Canada
- Languages at home
- 55% English-only · Spanish 44%
Political lean MEDSL · Bexar
- 2024 margin
- Lean D (+9.8) · D 54.3% · R 44.6% · Other 1.1%
- 2008→2024 swing
- +4.2pp toward D · 2008: 5.6pp · 2024: 9.8pp
- All cycles
- 2024: D+9.8 2020: D+18.2 2016: D+13.5 2012: D+4.6 2008: D+5.6
Not yet ingested
- Civics
- —
Market trends
- HPI YoY
- ▼ -163.42%
- Current HPI
- 286.299
- Rent YoY
- ▲ 1.07%
- Metro
- San Antonio-New Braunfels, TX
- State GDP YoY
- ▲ 3.95%
- F500 in state
- 110
Industry mix (Fortune 500 HQ in TX)
| Industry | F500 HQs | Revenue |
|---|---|---|
| Energy | 16 | $1,198B |
|
||
| Technology | 5 | $198B |
|
||
| Engineering / Construction | 4 | $72B |
|
||
| Energy Services | 3 | $60B |
|
||
| Utilities | 3 | $41B |
|
||
| Healthcare | 2 | $330B |
|
||
Price history
1 event — show timeline
- 2026-04-12 Listed $69,999 LERA
Property tax history
+6.6%/yrLatest (2025): $3,524 · +28.7% YoY. Source: county tax records.
Cash-flow waterfall
monthlySold comps — $/sqft
last 12 mo · ≤1 miLoading sold comps…