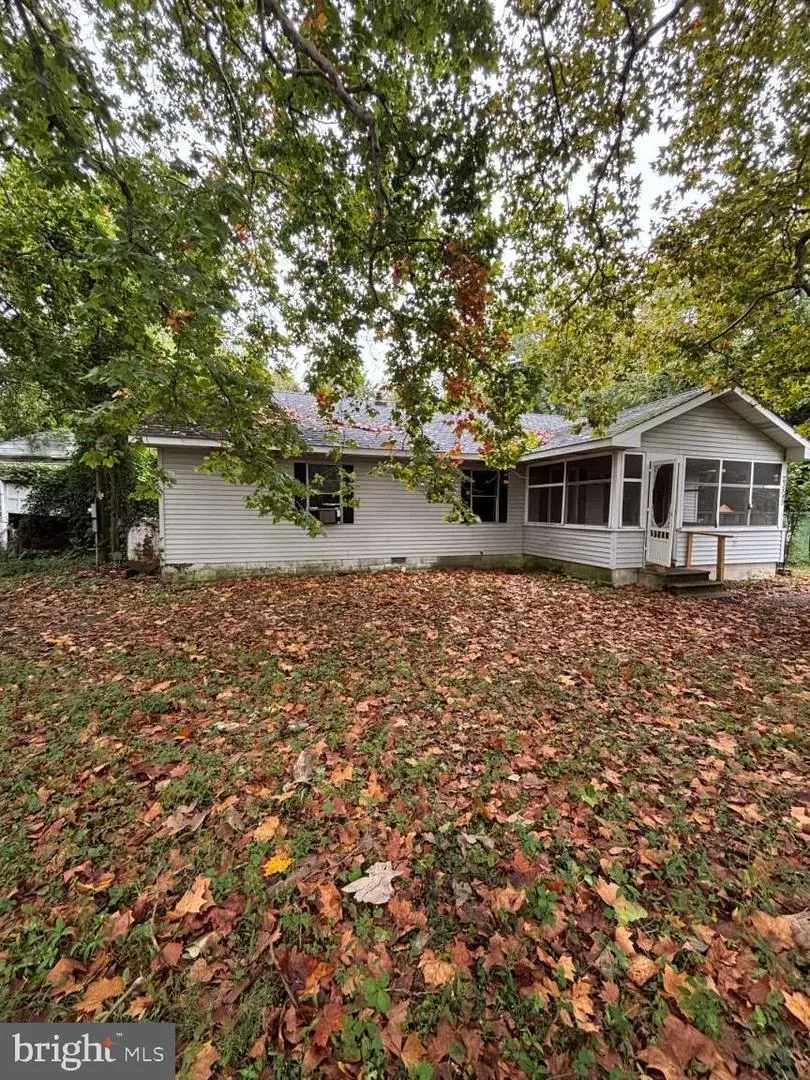
23849 Ross Station Rd · Seaford, DE
Flood risk 1/10 · Minimal
- FEMA flood zone
- X (unshaded)
- Chance of flooding over 30 yrs
- 0.0%
- Est. flood insurance / yr
- $473 – $860
Fire risk 1/10 · Minimal
- Est. fire insurance / yr
- $476 – $884
Heat risk 8/10 · Major
- Hot days now (above 105°F)
- 7 days/yr
- Hot days in 30 yrs
- 16 days/yr
Wind risk 6/10 · Moderate
- Chance of severe wind over 30 yrs
- 74.0%
Air-quality risk 2/10 · Minimal
- Unhealthy air days now
- 1 days/yr
- Unhealthy air days in 30 yrs
- 1 days/yr
Risk factors via First Street. Map © Google.
Why this score? — see what drove the C grade
The composite is a weighted blend of 9 inputs, each scored 0–100. Each bar is that input's sub-score; the figure is the points it added to the 100-point composite (weight × sub-score).
- Cash flow +22.1/30.0
- ARV discount +15.0/15.0
- DSCR +7.1/10.0
- 1% rule +4.7/10.0
- Livability +3.2/5.0
- Schools +2.8/10.0
- Rent growth +2.5/5.0
- Condition / age +2.5/5.0
- Appreciation +0.0/10.0
$200,000
🖨 Deal sheet 📄 Offer letter ✓ Due diligence
Listing remarks
BACK ON THE MARKET BY NO FAULT OF SELLER. Huge opportunity for the right investor or contractor! This 5 bed 2 bath home needs some TLC, but has huge upside potential. Huge detached building would be perfect for a contractor or hobbyist. Just passed electrical inspection. Home sold in as-is condition. CASH ONLY. Inspections for informational purposes only.
Key facts
- 0.44 acre lot
- Garage
- Built 1990
Neighborhood map
What this means for you Summary
Snapshot
- This is a 5-bed/2.0-bath single-family listed at $200k.
Deal economics
- At list price, monthly cash flow is $322 ($4k/yr) — positive.
- The deal already cash-flows at list — no discount required.
- To meet the 1% rule (rent ≥ 1% of price), the offer needs to be $194k (3.2% below list).
- Recommended offer: $194k (3.2% below list) — sets the bar for 1% rule.
- Cap rate 8.2% vs local median 4.4% in Seaford — top-decile yield for the area; either an underpriced asset or a hidden risk that comps aren't pricing in. Stress-test before assuming the spread holds.
Location & tenants
- Location reads 64/100 on livability (#54 in DE) — a middle-class / working-renter tenant base. Strengths: cost of living A+, housing A+, health & safety A+; Watch: schools C-, employment D, crime F.
- Seaford School District (suburban): math 25% / reading 40% proficiency, ranked #15 of 26 in DE (top 58%) — families likely to look elsewhere, expect single-tenant / working-renter base with shorter leases; 65% free/reduced lunch — lower-income household profile, screen leases tightly.
- Market conditions: 215 active listings in the ZIP; 4,354 units permitted in Sussex County in 2024 (344 in 5+ unit buildings).
Forward outlook
- Local home prices are declining (-3.0%/yr); year-one equity from $1k of loan paydown is wiped out by about $6k of value loss. Plan a longer hold.
- Sussex County population projected at +25% by 2050 — long-run rental-demand tailwind backs the buy-and-hold thesis.
Negotiation context
- It's been on market 22 days — a 2% lower offer ($197k) is reasonable based on typical stale-listing flexibility.
- 4 sale attempts; this cycle's ask is 11% above the opening price — seller raised mid-cycle; expect resistance to lowballs.
Risks & watch-outs
- Climate carrying-cost: major wind risk, 74% chance of damaging wind over 30y; extreme-heat days projected 7→16/yr by 2055 (HVAC capex compounding) — expect insurance premiums to compound above CPI over the hold.
Questions for the listing agent
- Is there a deadline driving the sale (1031 exchange, divorce, estate, relocation)? That informs how much negotiation room exists.
- Crime grade is F in this area — have there been break-ins, vandalism, or insurance claims at this property in the last 3 years? What carrier currently insures it and at what premium?
- What's the average days-on-market for RENTAL listings here right now (not sales)? A rising rental-DOM trend means longer vacancies and softer asking-rent achievability than the comps imply.
- What's the recent tenant-quality profile in this submarket — average credit score on applications, eviction rate, late-payment / NSF rate, and stable-employment percentage? A property-management company in the area should have these aggregated.
- How much new for-sale + rental construction is in the pipeline within 1–3 miles? Heavy new supply typically softens prices + rents 12–24 months out; constrained supply supports both.
Investment metrics
- 1% rule
- 0.97% ✗
- Cap rate
- 8.22%
- Cash-on-cash
- 6.90%
- DSCR
- 1.31
- GRM
- 8.6
CMA / ARV
- ARV (on-the-fly)
- $319,200
- Comps found
- 12
Show comp detail 12 sales within ~0.75 mi
| Address | Dist | Beds/Ba | Sqft | Sold | Price | $/sf | Match |
|---|---|---|---|---|---|---|---|
| 504 Chatham Dr | 0.48mi | 4/2.5 (-1) | 1,780 (-2%) | 10mo | $315,000 | $177 | 58 |
| 407 Terre St | 0.51mi | 4/2.5 (-1) | 1,780 (-2%) | 12mo | $324,990 | $183 | 56 |
| 501 Chatham Dr | 0.45mi | 4/2.5 (-1) | 1,998 (+10%) | 6mo | $339,090 | $170 | 51 |
| 513 Chatham Dr | 0.48mi | 4/2.5 (-1) | 1,700 (-7%) | 10mo | $319,990 | $188 | 51 |
| 405 Terre St Lot 75 | 0.50mi | 4/2.5 (-1) | 1,943 (+6%) | 10mo | $339,990 | $175 | 51 |
| 503 Chatham Dr | 0.46mi | 4/2.5 (-1) | 1,998 (+10%) | 7mo | $340,000 | $170 | 50 |
| 502 Chatham Dr | 0.48mi | 4/2.5 (-1) | 1,998 (+10%) | 7mo | $329,990 | $165 | 49 |
| 511 Chatham Dr | 0.48mi | 4/2.5 (-1) | 1,998 (+10%) | 10mo | $349,990 | $175 | 47 |
| 713 Bristol Dr Lot 35 | 0.53mi | 4/2.5 (-1) | 1,998 (+10%) | 12mo | $344,990 | $173 | 42 |
| 23279 Atlanta Rd | 0.71mi | 4/2.0 (-1) | 1,971 (+8%) | 10mo | $409,000 | $208 | 40 |
| 415 N Phillips St | 0.74mi | 4/2.0 (-1) | 1,950 (+7%) | 12mo | $325,000 | $167 | 39 |
| 304 Williams St | 0.72mi | 4/2.0 (-1) | 1,650 (-10%) | 10mo | $285,000 | $173 | 37 |
Match score weights: distance 35% · size 25% · config 20% · recency 20%. Top-matched comps best support the ARV.
Projected returns pro-forma
-3.0% appreciation · 3.0% rent growth · sell at horizon
- IRR
- -5.8%
- Equity multiple
- 0.79×
- Total profit
- $-11,992
- Equity at exit
- $29,821
- IRR
- 3.8%
- Equity multiple
- 1.28×
- Total profit
- $15,631
- Equity at exit
- $17,292
Cash invested: $56,000 (down + closing). Projections, not guarantees.
Landlord ↔ Tenant lean methodology
- Overall (STATE)
- 70 Landlord-Friendly
- State Delaware
- 70 Landlord-Friendly · D+7
- County
- — inherits STATE
- City
- — inherits STATE
ZIP-level market 19973
- Home prices YoY
- -17.8%
- Active inventory
- 215
- Price-to-rent
- 8.6×
Monthly cashflow live
- Estimated rent
- $1,936 medium interval (Pro) →
- Mortgage (P&I)
- −$1,049
- Tax from tax record
- −$76 /mo · $909/yr
- Insurance
- −$83
- HOA
- −$0
- Vacancy / Maint / Mgmt
- −$407
- Net cashflow
- $322
Break-even live
UW: 25.0% down · 7.5% · 30yr · 1.5% tax · 5.0% vac · 8.0% maint · 8.0% mgmt
Financing live
Cash to close
- Down payment
- $50,000
- Closing costs
- $6,000
- Reserves months
- —
- Total cash needed
- —
Loan-product check · same deal, 3 products live
Conventional
25% down · 7.5% · 30yr
- Down + closing
- —
- Monthly P&I
- —
- Monthly cashflow
- —
- DSCR
- —
- Eligible?
- —
Personal DTI + credit; lowest rate.
DSCR
20% down · 8.5% · 30yr
- Down + closing
- —
- Monthly P&I
- —
- Monthly cashflow
- —
- DSCR
- —
- Eligible?
- —
No personal income docs; deal must DSCR.
Hard money
10% down · 12.0% · 12mo
- Down + closing
- —
- Monthly P&I
- —
- Monthly cashflow
- —
- DSCR
- —
- Eligible?
- —
Short-term bridge; refi at stabilization.
Listing history 13 events
-
2026-04-24status Pending
-
2026-04-24price $200,000
-
2026-04-15price $169,000
-
2026-04-02$179,900 Active
-
2026-03-22historical
-
2026-03-04price $199,900
-
2026-02-11price $209,900
-
2026-02-10status Active
-
2026-01-05status Pending
-
2025-12-28status Active
-
2025-10-23status Pending
-
2025-10-16price $199,900
-
2025-09-22$219,900 Active
ⓘ Source: listings_history table (triggers on properties + properties_extension) + one-shot
backfill from property_details.listing_events for pre-trigger history.
Tax reassessment forecast DE · Partial reset (capped growth)
- Current annual tax
- $909 · $76/mo
- Projected year-2 tax
- $1,035 · $86/mo
- Expected delta
- +$125/yr (+$10/mo · 13.8%)
ⓘ Screening estimate from a state-policy table — verify with the county assessor before closing.
Climate risk First Street
- Flood 1/10 Low FEMA zone X (unshaded) · 0% chance over 30 yrs
- Wildfire 1/10 Low
- Heat 8/10 Severe 7 d/yr ≥105°F today · 16 d/yr by 30 yrs out
- Wind 6/10 Major 74% chance of damaging wind over 30 yrs
- Air quality 2/10 Low 1 unhealthy d/yr today · 1 by 30 yrs out
Nearby sold comps map
Loading sold comps map…
Walkable amenities ~0.75 mi
Loading nearby amenities…
Taxation est. · year 1
- Rental income
- $23,236
- − Mortgage interest
- −$11,203
- − Property taxes
- −$909
- − Insurance
- −$1,000
- − Repairs & maintenance
- −$1,859
- − Management
- −$1,859
- − Depreciation
- −$5,818
- Taxable income
- $588
- Est. tax owed @ 24.0%
- −$141
- After-tax cash flow
- $3,720/yr
For passive investors: Depreciation is non-cash, so a rental often shows a tax loss while cash-flowing — sheltering income. Rental losses are passive: they offset passive income freely, and up to $25,000/yr can offset ordinary (W-2) income if you actively participate and your MAGI is under $100k (phasing out to $0 by $150k); unused losses carry forward. On sale, claimed depreciation is recaptured at up to 25%, and gains may owe capital-gains tax (a 1031 exchange can defer both). Figures are a year-1 estimate at your 24.0% rate — not tax advice; consult a CPA.
Schools (NCES district)
- District
- Seaford School District
- NCES district ID
- 1001530
- Math proficiency
- 25% ▼ -18.00%
- Reading proficiency
- 40% ▼ -12.00%
- Median HH income
- $48,427
- Composite
- 28.07/100
- National rank
- #6835
- State rank
- #15 of 26 in DE
Livability — Seaford
- Score
- 64/100
- State rank
- #54
- US rank
- #14448
Category grades
Schools grade is shown separately in the Schools card above.
Census & demographics
- Census place
- Seaford, DE
- Population (ZIP)
- 25,786
Population outlook (Sussex County) Hauer SSP2
- Today (2025)
- 248,853 people
- By 2030
- 264,464 · +6.3%
- By 2040
- 290,980 · +16.9%
- By 2050
- 311,259 · +25.1%
- By 2075
- 352,488 · +41.6%
- By 2100
- 367,406 · +47.6%
Race, ethnicity, and origin ACS 2023
- Neighborhood character
- Diverse neighborhood (Simpson 0.61)
- Race & ethnicity
- White 58% Black 20% Two or more races 13% Hispanic / Latino 11%
- Hispanic origin (detail)
- Mexican 5% Puerto Rican 1% Dominican 2%
- Common ancestry
- Hispanic 4% Romanian 3% Italian 2%
- Foreign-born
- 9% · Canada, Vietnam
- Languages at home
- 85% English-only · Spanish 8% French/Haitian/Cajun 5% Vietnamese 1%
Political lean MEDSL · Sussex
- 2024 margin
- R (+11.0) · D 43.9% · R 54.9% · Other 1.2%
- 2008→2024 swing
- -2.4pp toward R · 2008: -8.6pp · 2024: -11.0pp
- All cycles
- 2024: R+11.0 2020: R+11.2 2016: R+22.0 2012: R+13.0 2008: R+8.6
Not yet ingested
- Civics
- —
Market trends
- HPI YoY
- ▼ -62.40%
- Current HPI
- 288.5652
- Rent YoY
- —
- Metro
- —
- State GDP YoY
- —
- F500 in state
- 0
Price history
-9.0% since first listed13 events — show timeline
- 2026-04-24 Pending — BRIGHT MLS
- 2026-04-24 Price Changed $200,000 BRIGHT MLS
- 2026-04-15 Price Changed $169,000 BRIGHT MLS
- 2026-04-02 Listed $179,900 BRIGHT MLS
- 2026-03-22 Listing Removed — BRIGHT MLS
- 2026-03-04 Price Changed $199,900 BRIGHT MLS
- 2026-02-11 Price Changed $209,900 BRIGHT MLS
- 2026-02-10 Relisted — BRIGHT MLS
- 2026-01-05 Pending — BRIGHT MLS
- 2025-12-28 Relisted — BRIGHT MLS
- 2025-10-23 Pending — BRIGHT MLS
- 2025-10-16 Price Changed $199,900 BRIGHT MLS
- 2025-09-22 Listed $219,900 BRIGHT MLS
Property tax history
+2.6%/yrLatest (2025): $909 · +3.6% YoY. Source: county tax records.
Cash-flow waterfall
monthlySold comps — $/sqft
last 12 mo · ≤1 miLoading sold comps…