 Multi-family
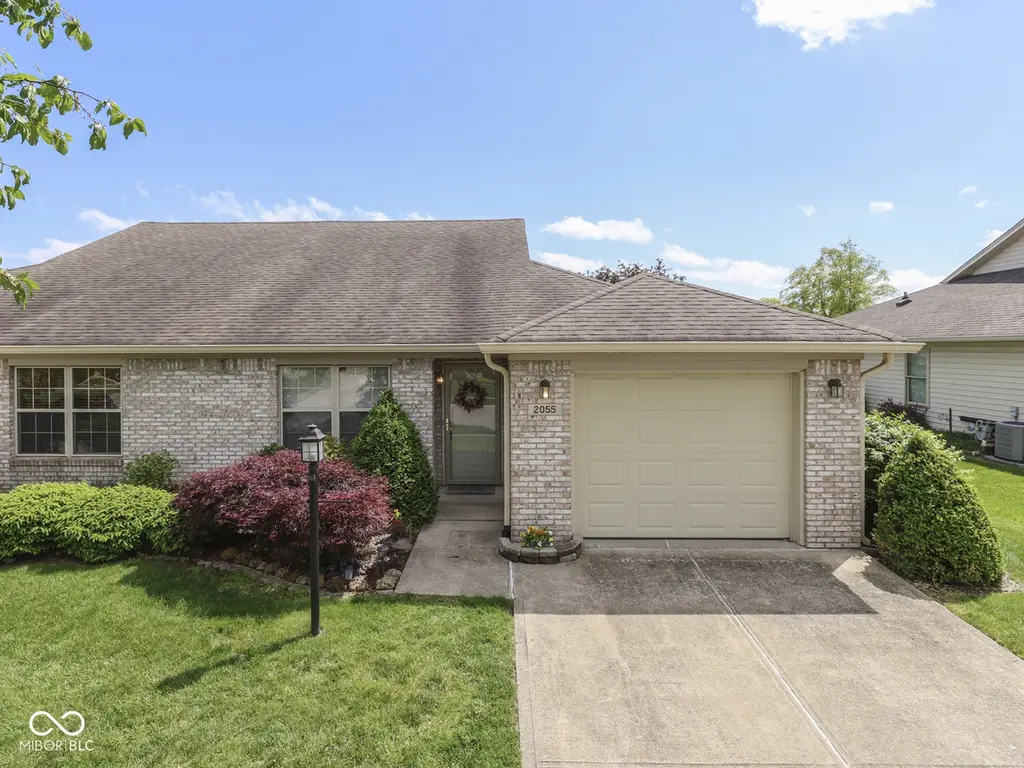
2055 Pelican Dr · Franklin, IN
Flood risk 1/10 · Minimal
- FEMA flood zone
- X (unshaded)
- Chance of flooding over 30 yrs
- 0.0%
- Est. flood insurance / yr
- $507 – $1,088
Fire risk 1/10 · Minimal
- Est. fire insurance / yr
- $717 – $1,331
Heat risk 4/10 · Minor
- Hot days now (above 101°F)
- 7 days/yr
- Hot days in 30 yrs
- 19 days/yr
Wind risk 2/10 · Minimal
- Chance of severe wind over 30 yrs
- 1.0%
Air-quality risk 2/10 · Minimal
- Unhealthy air days now
- 1 days/yr
- Unhealthy air days in 30 yrs
- 1 days/yr
Risk factors via First Street. Map © Google.
Why this score? — see what drove the D grade
The composite is a weighted blend of 9 inputs, each scored 0–100. Each bar is that input's sub-score; the figure is the points it added to the 100-point composite (weight × sub-score).
- ARV discount +15.0/15.0
- Cash flow +8.9/30.0
- Rent growth +3.7/5.0
- Schools +3.5/10.0
- Livability +3.2/5.0
- DSCR +2.5/10.0
- Condition / age +2.5/5.0
- 1% rule +2.0/10.0
- Appreciation +0.0/10.0
$219,900
🖨 Deal sheet (PDF) 📄 Offer letter ✓ Due diligence
Multi-family units
County records classify this as Multi-Family (2-4 Unit). Listing-text estimate: 1 unit. estimate disagrees with records
Listing remarks MLS
Ready to move in!!!! 2 bedroom 2 bath. New carpet, dishwasher, microwave, roof and gutters . 1 car garage with washer/dryer area. Beautifully landscaped around deck that overlooks pond.
Key facts
- Large deck
- Serene pond
- Open layout
Tags
Property features AI
Finance
- Other: Lot includes sidewalks; Lot under 1/4 acre
- HOA & community: HOA with monthly fee; HOA fee $75 per month; HOA includes clubhouse, lawn care/grounds maintenance and snow removal; Covenants & restrictions apply; Low-maintenance lifestyle community
Exterior
- Parking: Attached garage (1 car)
- Utilities: Public water; Municipal sewer connected; No solid waste service listed
- Home design: Single family residence (attached); One level
- Construction: Vinyl with brick exterior; Block foundation
- Exterior features: Covered deck; On a pond (waterfront)
Interior
- Kitchen: Electric cooktop; Electric oven; Microwave; Refrigerator; Dishwasher (if present listed under appliances)
- Bedrooms: 2 bedrooms on the main level; Primary bedroom with walk-in closet
- Bathrooms: 1 full bathroom with full shower stall; 1 half bathroom (main level)
- Heating & cooling: Forced air heating (natural gas); Central air conditioning
- Interior features: Attic access; Cathedral ceilings; Breakfast bar; Laundry located in garage; Water softener (rented); Disposal; Smoke alarm
- Laundry & utility: Dryer; Gas water heater
Neighborhood map
What this means for you Summary
Snapshot
- This is a 2-bed/1.5-bath multifamily listed at $220k.
Deal economics
- At list price, monthly cash flow is $-177 ($-2k/yr) — negative.
- To cash-flow at today's rent, offer at most $189k (14.2% below list).
- To meet the 1% rule (rent ≥ 1% of price), the offer needs to be $153k (30.5% below list).
- Recommended offer: $153k (30.5% below list) — sets the bar for 1% rule.
- Cap rate 5.3% vs local median 4.0% in Franklin — top-decile yield for the area; either an underpriced asset or a hidden risk that comps aren't pricing in. Stress-test before assuming the spread holds.
Location & tenants
- Location reads 65/100 on livability (#351 in IN) — a middle-class / working-renter tenant base. Strengths: crime A+, cost of living A+, housing A+; Watch: amenities F, commute F, health & safety F.
- Franklin Community School Corporation (suburban): math 36% / reading 44% proficiency, ranked #133 of 301 in IN (top 44%) — families likely to look elsewhere, expect single-tenant / working-renter base with shorter leases.
- Zoned schools: Northwood Elementary School (math 42% / reading 37%, grade F, #500 of 994 statewide, top 53%, 561 students, 56% FRL); Franklin Community Middle School (math 25% / reading 42%, grade F, #176 of 330 statewide, top 54%, 759 students, 48% FRL); Franklin Community High School (math 29% / reading 69%, grade D, #136 of 369 statewide, top 37%, 1,610 students, 41% FRL).
- Market conditions: Rents rising fast (+4.7%/yr); 282 active listings in the ZIP; 9 comparable units currently listed for rent nearby; rentals at typical pace (median 26d on market — plan ~3-4 weeks tenant-placement turnaround); 44% of comp listings sitting > 30 days — soft ceiling on asking rent; solid renter incomes; 1,133 units permitted in Johnson County in 2024 (0 in 5+ unit buildings).
Forward outlook
- Local home prices are declining (-3.0%/yr); year-one equity from $2k of loan paydown is wiped out by about $7k of value loss. Plan a longer hold.
- Johnson County population projected at +26% by 2050 — long-run rental-demand tailwind backs the buy-and-hold thesis.
Negotiation context
- Only 1 days on market — expect competitive offers; lowballing is unlikely to land.
- 2 sale attempts since 14y ago with the ask held roughly flat each time — persistent listings suggest the price (not the market) is what's stuck; bring a comps-based counter.
Questions for the listing agent
- What do current leases actually rent for vs. the listed asking? Can we see a recent rent roll and the last 12 months of T-12 income?
- What does the HOA fee cover, when was the last increase, and are there any pending special assessments or reserve-fund shortfalls?
- Is there a deadline driving the sale (1031 exchange, divorce, estate, relocation)? That informs how much negotiation room exists.
- Schools are D-rated, which usually means shorter tenancies and higher turnover. Who's the typical renter profile here, and what's been the actual vacancy rate?
- The area grade is low — what's the realistic commute time and amenity access for the typical tenant pool here? Any planned neighborhood developments (good or bad) we should know about?
- What's the average days-on-market for RENTAL listings here right now (not sales)? A rising rental-DOM trend means longer vacancies and softer asking-rent achievability than the comps imply.
- What's the recent tenant-quality profile in this submarket — average credit score on applications, eviction rate, late-payment / NSF rate, and stable-employment percentage? A property-management company in the area should have these aggregated.
- How much new apartment / multifamily construction is in the pipeline within 1–3 miles? Heavy new supply (>2% of stock underway) typically softens rents 12–24 months out; light construction supports rent growth.
Investment metrics
- 1% rule
- 0.70% ✗
- Cap rate
- 5.33%
- Cash-on-cash
- -3.45%
- DSCR
- 0.85
- GRM
- 12.0
CMA / ARV
- ARV (median comp)
- $330,090
- List price
- $219,900
- Delta
- -33.38%
- Verdict
- UNDERPRICED
- Comps
- 2 within 2.0 mi
Projected returns pro-forma
-3.0% appreciation · 4.68% rent growth · sell at horizon
- IRR
- -20.4%
- Equity multiple
- 0.28×
- Total profit
- $-44,346
- Equity at exit
- $32,788
- IRR
- -10.6%
- Equity multiple
- 0.31×
- Total profit
- $-42,229
- Equity at exit
- $19,013
Cash invested: $61,572 (down + closing). Projections, not guarantees.
Landlord ↔ Tenant lean methodology
- Overall (STATE)
- 90 Strongly Landlord-Friendly
- State Indiana
- 90 Strongly Landlord-Friendly · R+11
- County
- — inherits STATE
- City
- — inherits STATE
ZIP-level market 46131
- Home prices YoY
- -27.8%
- Rents YoY
- 4.7%
- Active inventory
- 282
- Price-to-rent
- 12.0×
Monthly cashflow live
- Estimated rent
- $1,528 high interval (Pro) →
- Mortgage (P&I)
- −$1,153
- Tax from tax record
- −$65 /mo · $778/yr
- Insurance
- −$92
- HOA
- −$75
- Vacancy / Maint / Mgmt
- −$321
- Net cashflow
- $-177
Break-even live
Sensitivity live
| Price | -10% $-53 | -5% $-115 | +0% $-177 | +5% $-239 | +10% $-302 |
|---|---|---|---|---|---|
| Rent | -10% $-298 | -5% $-237 | +0% $-177 | +5% $-117 | +10% $-56 |
| Rate | -1.0pp $-66 | -0.5pp $-121 | base $-177 | +0.5pp $-234 | +1.0pp $-292 |
UW: 25.0% down · 7.5% · 30yr · 1.5% tax · 5.0% vac · 8.0% maint · 8.0% mgmt
Financing live
Cash to close
- Down payment
- $54,975
- Closing costs
- $6,597
- Reserves months
- —
- Total cash needed
- —
Loan-product check · same deal, 3 products live
Conventional
25% down · 7.5% · 30yr
- Down + closing
- —
- Monthly P&I
- —
- Monthly cashflow
- —
- DSCR
- —
- Eligible?
- —
Personal DTI + credit; lowest rate.
DSCR
20% down · 8.5% · 30yr
- Down + closing
- —
- Monthly P&I
- —
- Monthly cashflow
- —
- DSCR
- —
- Eligible?
- —
No personal income docs; deal must DSCR.
Hard money
10% down · 12.0% · 12mo
- Down + closing
- —
- Monthly P&I
- —
- Monthly cashflow
- —
- DSCR
- —
- Eligible?
- —
Short-term bridge; refi at stabilization.
Rent comps 9 comps
| Address | Beds | Baths | Sqft | Rent | $/sqft | DOM | Units | Dist |
|---|---|---|---|---|---|---|---|---|
| 1994 Falcon Ct Franklin, IN | 3.0 | 1.0 | 1008 | $1,590 | $1.58 | 45d | 1 | 0.66mi |
| 1037 W Jefferson St Franklin, IN | 2.0–3.0 | 2.0 | 1131 | $1,385 | $1.22 | 0d | 6 | 0.88mi |
| 278 Walnut St Unit 7 Franklin, IN | 2.0 | 1.0 | 800 | $1,300 | $1.62 | 0d | 1 | 1.12mi |
| 278 Walnut St Unit 6 Franklin, IN | 2.0 | 1.0 | 800 | $1,300 | $1.62 | 45d | 1 | 1.12mi |
| 399 N Main St Unit 2 Franklin, IN | 2.0 | 2.0 | 1177 | $1,150 | $0.98 | 25d | 1 | 1.31mi |
| 399 N Main St Unit 1 Franklin, IN | 2.0 | 2.0 | 1177 | $1,150 | $0.98 | 45d | 1 | 1.31mi |
| 401 N Main St Unit 6A Franklin, IN | 2.0 | 1.0 | 900 | $650 | $0.72 | 25d | 1 | 1.31mi |
| 401 N Main St Unit 4B Franklin, IN | 2.0 | 1.0 | 900 | $1,350 | $1.50 | 9d | 1 | 1.31mi |
| 150 S Main St Franklin, IN | 3.0 | 2.0 | 1500 | $2,400 | $1.60 | 45d | 1 | 1.46mi |
HOA detail
- Monthly dues
- $75 · $900/yr
Listing history 5 events
-
2026-05-02status Pending 909-char remark
-
2026-04-03$219,900 Active 909-char remark
-
2013-04-17historical 186-char remark
Show marketing remark (186 chars)
Ready to move in!!!! 2 bedroom 2 bath. New carpet, dishwasher, microwave, roof and gutters . 1 car garage with washer/dryer area. Beautifully landscaped around deck that overlooks pond.
-
2013-04-15soldstatus $93,500 186-char remark
Show marketing remark (186 chars)
Ready to move in!!!! 2 bedroom 2 bath. New carpet, dishwasher, microwave, roof and gutters . 1 car garage with washer/dryer area. Beautifully landscaped around deck that overlooks pond.
-
2012-11-13$99,600 186-char remark
Show marketing remark (186 chars)
Ready to move in!!!! 2 bedroom 2 bath. New carpet, dishwasher, microwave, roof and gutters . 1 car garage with washer/dryer area. Beautifully landscaped around deck that overlooks pond.
ⓘ Source: listings_history table (triggers on properties + properties_extension) + one-shot
backfill from property_details.listing_events for pre-trigger history.
Tax reassessment forecast IN · Partial reset (capped growth)
- Current annual tax
- $778 · $65/mo
- Projected year-2 tax
- $1,323 · $110/mo
- Expected delta
- +$546/yr (+$45/mo · 70.2%)
ⓘ Screening estimate from a state-policy table — verify with the county assessor before closing.
Climate risk First Street
- Flood 1/10 Low FEMA zone X (unshaded) · 0% chance over 30 yrs
- Wildfire 1/10 Low
- Heat 4/10 Moderate 7 d/yr ≥101°F today · 19 d/yr by 30 yrs out
- Wind 2/10 Low 100% chance of damaging wind over 30 yrs
- Air quality 2/10 Low 1 unhealthy d/yr today · 1 by 30 yrs out
Nearby sold comps map
Loading sold comps map…
Walkable amenities ~0.75 mi
Loading nearby amenities…
Taxation est. · year 1
- Rental income
- $18,342
- − Mortgage interest
- −$12,318
- − Property taxes
- −$778
- − Insurance
- −$1,100
- − Repairs & maintenance
- −$1,467
- − Management
- −$1,467
- − HOA
- −$900
- − Depreciation
- −$6,397
- Taxable loss
- −$6,085
- Est. tax savings @ 24.0%
- +$1,460
- After-tax cash flow
- $-665/yr
For passive investors: Depreciation is non-cash, so a rental often shows a tax loss while cash-flowing — sheltering income. Rental losses are passive: they offset passive income freely, and up to $25,000/yr can offset ordinary (W-2) income if you actively participate and your MAGI is under $100k (phasing out to $0 by $150k); unused losses carry forward. On sale, claimed depreciation is recaptured at up to 25%, and gains may owe capital-gains tax (a 1031 exchange can defer both). Figures are a year-1 estimate at your 24.0% rate — not tax advice; consult a CPA.
Schools (NCES district)
- District
- Franklin Community School Corporation
- NCES district ID
- 1803690
- Math proficiency
- 36% ▼ -11.00%
- Reading proficiency
- 44% ▼ -8.00%
- Median HH income
- $54,855
- Composite
- 34.93/100
- National rank
- #5066
- State rank
- #133 of 301 in IN
Livability — Franklin
- Score
- 65/100
- State rank
- #351
- US rank
- #13428
Category grades
Schools grade is shown separately in the Schools card above.
Census & demographics
- Census place
- Franklin, IN
- County
- Johnson County · 154,261 people
- City population
- 34,647
- Metro
- Indianapolis-Carmel-Anderson, IN
- Population (ZIP)
- 34,647
- Household income
- $85,076
- Rent vs Own
- Severe rent burden
- 984.0
Population outlook (Johnson County) Hauer SSP2
- Today (2025)
- 170,080 people
- By 2030
- 179,983 · +5.8%
- By 2040
- 198,580 · +16.8%
- By 2050
- 214,661 · +26.2%
- By 2075
- 247,990 · +45.8%
- By 2100
- 257,821 · +51.6%
Race, ethnicity, and origin ACS 2023
- Neighborhood character
- Predominantly White (92%)
- Race & ethnicity
- White 92% Two or more races 4% Hispanic / Latino 2% Black 2%
- Common ancestry
- Slovak 2% Italian 1% Serbian 1%
- Foreign-born
- 2% · Canada
- Languages at home
- 97% English-only · Spanish 2% Russian/Polish/Slavic 1% Other Asian/Pacific 1%
Political lean MEDSL · Johnson
- 2024 margin
- Solid R (+34.3) · D 32.0% · R 66.3% · Other 1.7%
- 2008→2024 swing
- -8.9pp toward R · 2008: -25.5pp · 2024: -34.3pp
- All cycles
- 2024: R+34.3 2020: R+34.1 2016: R+42.5 2012: R+38.5 2008: R+25.5
Not yet ingested
- Civics
- —
Market trends
- HPI YoY
- ▼ -90.53%
- Current HPI
- 235.0009
- Rent YoY
- ▲ 4.68%
- Metro
- Indianapolis-Carmel-Anderson, IN
- State GDP YoY
- ▲ 2.90%
- F500 in state
- 18
Industry mix (Fortune 500 HQ in IN)
| Industry | F500 HQs | Revenue |
|---|---|---|
| Industrial Machinery | 2 | $37B |
|
||
| Healthcare | 1 | $177B |
|
||
| Pharmaceuticals | 1 | $45B |
|
||
| Metals / Steel | 1 | $18B |
|
||
| Agriculture | 1 | $17B |
|
||
| Packaging | 1 | $12B |
|
||
Price history
+120.8% since first listed6 events — show timeline
- 2026-06-01 Sold (MLS) $219,900 MIBOR as Distributed by MLS Grid
- 2026-05-02 Pending — MIBOR as Distributed by MLS Grid
- 2026-04-03 Listed $219,900 MIBOR as Distributed by MLS Grid
- 2013-04-17 Listing Removed — MIBOR as Distributed by MLS Grid
- 2013-04-15 Sold (MLS) $93,500 MIBOR as Distributed by MLS Grid
- 2012-11-13 Listed $99,600 MIBOR as Distributed by MLS Grid
Property tax history
-1.4%/yrLatest (2024): $778 · +2.0% YoY. Source: county tax records.
Cash-flow waterfall
monthlySold comps — $/sqft
last 12 mo · ≤1 miLoading sold comps…