 🌊 Lakefront
661 Sun Ray Ct · Boynton Beach, FL
Flood risk 4/10 · Minor
- FEMA flood zone
- X (unshaded)
- Chance of flooding over 30 yrs
- 0.22%
- Est. flood insurance / yr
- $507 – $1,088
Fire risk 1/10 · Minimal
- Est. fire insurance / yr
- $947 – $1,759
Heat risk 9/10 · Severe
- Hot days now (above 106°F)
- 7 days/yr
- Hot days in 30 yrs
- 25 days/yr
Wind risk 10/10 · Severe
- Chance of severe wind over 30 yrs
- 99.0%
Air-quality risk 2/10 · Minimal
- Unhealthy air days now
- 0 days/yr
- Unhealthy air days in 30 yrs
- 2 days/yr
Risk factors via First Street. Map © Google.
Why this score? — see what drove the C+ grade
The composite is a weighted blend of 9 inputs, each scored 0–100. Each bar is that input's sub-score; the figure is the points it added to the 100-point composite (weight × sub-score).
- Cash flow +24.8/30.0
- 1% rule +10.0/10.0
- DSCR +8.0/10.0
- ARV discount +7.5/15.0
- Schools +4.3/10.0
- Livability +3.6/5.0
- Condition / age +2.5/5.0
- Rent growth +2.4/5.0
- Appreciation +0.0/10.0
$115,000
🖨 Deal sheet (PDF) 📄 Offer letter ✓ Due diligence
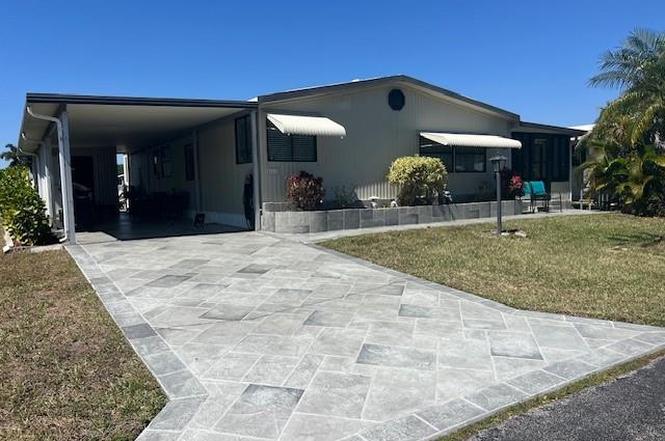
Listing remarks
Just Listed !!! Beautiful 2 bedroom 2 bath lakefront home sold fully furnished tunkey. Relax on your back patio and enjoy the views. This home is immaculate . Gorgeous designer driveway , attached carport and storage . Large bedrooms . Open floor plan. New AC compressor and motor 2025. Located in a gated community with Clubhouse, Pool, , Fitness Center, Tennis Courts, Whirlpool Spa, Bocce Court.
Key facts
- Gated community
- Attached carport
- Clubhouse
Tags
Property features AI
Finance
- Other: Pets allowed (subject to number and size limits)
- Financial info: Association fee applies
- HOA & community: Homeowners association with monthly fee (includes common areas, grounds maintenance, pool(s), recreation facilities, and taxes); Gated community; Clubhouse; Senior community
Exterior
- Parking: 1 total parking space; 1 covered parking space
- Utilities: Electricity connected; 110V and 220V service
- Home design: Manufactured home; Single-story
- Construction: Manufactured construction
- Exterior features: Waterfront on a lake; Lot approximately 0.2 acres
Interior
- Bathrooms: 2 full bathrooms
- Heating & cooling: Central heating; Central air conditioning
- Interior features: Furnished
Neighborhood map
What this means for you Summary
Snapshot
- This is a 2-bed/2.0-bath manufactured listed at $115k.
Deal economics
- At list price, monthly cash flow is $243 ($3k/yr) — positive.
- The deal already cash-flows at list — no discount required.
- Meets the 1% rule at list price ($3k rent vs $115k).
- Recommended offer: $101k (12.0% below list) — sets the bar for market timing.
- Cap rate 8.8% vs local median 4.3% in Boynton Beach — top-decile yield for the area; either an underpriced asset or a hidden risk that comps aren't pricing in. Stress-test before assuming the spread holds.
Location & tenants
- Location reads 72/100 on livability (#351 in FL) — a middle-class / working-renter tenant base. Strengths: housing A+, health & safety B+, cost of living B; Watch: amenities D+, crime D-, commute F.
- Palm Beach (suburban): math 46% / reading 53% proficiency, ranked #34 of 73 in FL (top 47%) — families likely to look elsewhere, expect single-tenant / working-renter base with shorter leases.
- Market conditions: Rents soft (-0.6%/yr); 457 active listings in the ZIP; 40 comparable units currently listed for rent nearby; rentals at typical pace (median 23d on market — plan ~3-4 weeks tenant-placement turnaround); solid renter incomes; 3,974 units permitted in Palm Beach County in 2024 (1,012 in 5+ unit buildings).
- This rent runs 41% of the median local income ($76k/yr) — at the standard rent-burdened threshold; future hikes will face affordability resistance.
Forward outlook
- Local home prices are declining (-3.0%/yr); year-one equity from $795 of loan paydown is wiped out by about $3k of value loss. Plan a longer hold.
- Palm Beach County population projected at +30% by 2050 — long-run rental-demand tailwind backs the buy-and-hold thesis.
Negotiation context
- It's been on market 218 days — a 12% lower offer ($101k) is reasonable based on typical stale-listing flexibility.
- 2 sale attempts; this cycle's ask has dropped $14k (11%) from the opening price — seller is motivated, your offer sets the floor, not the list.
Risks & watch-outs
- Watch-outs: HOA is 39% of rent.
- Climate carrying-cost: severe wind risk, 99% chance of damaging wind over 30y; extreme-heat days projected 7→25/yr by 2055 (HVAC capex compounding) — expect insurance premiums to compound above CPI over the hold.
Questions for the listing agent
- It's been on market 218 days. Have you received any prior offers? Is the seller open to a 12% concession, seller financing, or rate buy-down credit?
- What does the HOA fee cover, when was the last increase, and are there any pending special assessments or reserve-fund shortfalls?
- Why hasn't it sold? Are there any deal-killer items the seller is aware of (foundation, flood, title, zoning, code violations)?
- Is there a deadline driving the sale (1031 exchange, divorce, estate, relocation)? That informs how much negotiation room exists.
- Crime grade is D in this area — have there been break-ins, vandalism, or insurance claims at this property in the last 3 years? What carrier currently insures it and at what premium?
- This sits on a lake — are riparian / water-frontage rights deeded with the parcel? Any dock permits, shoreline easements, or HOA water-use restrictions?
- What's the documented flood / surge / shoreline-erosion history here (FEMA AND non-FEMA — e.g., storm surge, creek backup, septic-field saturation)?
- Any water-quality or seasonal algae-bloom issues that affect tenant satisfaction or short-term-rental demand?
- What's the average days-on-market for RENTAL listings here right now (not sales)? A rising rental-DOM trend means longer vacancies and softer asking-rent achievability than the comps imply.
- What's the recent tenant-quality profile in this submarket — average credit score on applications, eviction rate, late-payment / NSF rate, and stable-employment percentage? A property-management company in the area should have these aggregated.
- How much new for-sale + rental construction is in the pipeline within 1–3 miles? Heavy new supply typically softens prices + rents 12–24 months out; constrained supply supports both.
Investment metrics
- 1% rule
- 2.25% ✓
- Cap rate
- 8.83%
- Cash-on-cash
- 9.05%
- DSCR
- 1.40
- GRM
- 3.7
CMA / ARV
No comps found within radius.
Projected returns pro-forma
-3.0% appreciation · 0.0% rent growth · sell at horizon
- IRR
- -9.1%
- Equity multiple
- 0.69×
- Total profit
- $-10,078
- Equity at exit
- $17,147
- IRR
- -11.1%
- Equity multiple
- 0.52×
- Total profit
- $-15,455
- Equity at exit
- $9,943
Cash invested: $32,200 (down + closing). Projections, not guarantees.
Landlord ↔ Tenant lean methodology
- Overall (STATE)
- 87 Strongly Landlord-Friendly
- State Florida
- 87 Strongly Landlord-Friendly · R+3
- County
- — inherits STATE
- City
- — inherits STATE
ZIP-level market 33436
- Home prices YoY
- -26.0%
- Rents YoY
- -0.6%
- Active inventory
- 457
- Price-to-rent
- 3.7×
Monthly cashflow live
- Estimated rent
- $2,584 high interval (Pro) →
- Mortgage (P&I)
- −$603
- Tax est. 1.5%
- −$144 /mo · $1,725/yr
- Insurance
- −$48
- HOA
- −$1,004
- Vacancy / Maint / Mgmt
- −$543
- Net cashflow
- $243
Break-even live
Sensitivity live
| Price | -10% $322 | -5% $283 | +0% $243 | +5% $203 | +10% $163 |
|---|---|---|---|---|---|
| Rent | -10% $39 | -5% $141 | +0% $243 | +5% $345 | +10% $447 |
| Rate | -1.0pp $301 | -0.5pp $272 | base $243 | +0.5pp $213 | +1.0pp $183 |
UW: 25.0% down · 7.5% · 30yr · 1.5% tax · 5.0% vac · 8.0% maint · 8.0% mgmt
Financing live
Cash to close
- Down payment
- $28,750
- Closing costs
- $3,450
- Reserves months
- —
- Total cash needed
- —
Loan-product check · same deal, 3 products live
Conventional
25% down · 7.5% · 30yr
- Down + closing
- —
- Monthly P&I
- —
- Monthly cashflow
- —
- DSCR
- —
- Eligible?
- —
Personal DTI + credit; lowest rate.
DSCR
20% down · 8.5% · 30yr
- Down + closing
- —
- Monthly P&I
- —
- Monthly cashflow
- —
- DSCR
- —
- Eligible?
- —
No personal income docs; deal must DSCR.
Hard money
10% down · 12.0% · 12mo
- Down + closing
- —
- Monthly P&I
- —
- Monthly cashflow
- —
- DSCR
- —
- Eligible?
- —
Short-term bridge; refi at stabilization.
Rent comps 40 comps
| Address | Beds | Baths | Sqft | Rent | $/sqft | DOM | Units | Dist |
|---|---|---|---|---|---|---|---|---|
| 190 Temple Ave Boynton Beach, FL | 3.0 | 2.0 | 1781 | $4,200 | $2.36 | 25d | 1 | 0.24mi |
| 1515 Arezzo Cir Boynton Beach, FL | 2.0 | 2.5 | 1286 | $2,750 | $2.14 | 25d | 1 | 0.28mi |
| 920 Sun Acres Ln Boynton Beach, FL | 2.0 | 2.0 | 1352 | $2,200 | $1.63 | 25d | 1 | 0.33mi |
| 107 Buttonwood Ln Unit 107 Boynton Beach, FL | 2.0 | 2.5 | 1264 | $2,600 | $2.06 | 25d | 1 | 0.34mi |
| 3930 Max Pl Boynton Beach, FL | 2.0 | 2.0 | 1250 | $2,370 | $1.90 | 0d | 1 | 0.38mi |
| 3930 Max Pl Boynton Beach, FL | 3.0 | 2.0 | 1550 | $2,825 | $1.82 | 25d | 1 | 0.38mi |
| 3930 Max Pl Boynton Beach, FL | 1.0 | 1.0 | 925 | $2,550 | $2.76 | 23d | 1 | 0.38mi |
| 3500 Sandpiper Dr Boynton Beach, FL | 1.0–2.0 | 1.0–2.0 | 1147 | $2,579 | $2.25 | 23d | 22 | 0.44mi |
| 2305 N Congress Ave #18 Boynton Beach, FL | 3.0 | 2.0 | 1217 | $2,600 | $2.14 | 16d | 1 | 0.48mi |
| 2317 N Congress Ave #24 Boynton Beach, FL | 2.0 | 1.0 | 902 | $2,300 | $2.55 | 6d | 1 | 0.49mi |
| 2303 N Congress Ave #15 Boynton Beach, FL | 2.0 | 1.0 | 925 | $1,950 | $2.11 | 25d | 1 | 0.50mi |
| 2319 N Congress Ave #28 Boynton Beach, FL | 2.0 | 2.0 | 1172 | $1,945 | $1.66 | 8d | 1 | 0.51mi |
| 2307 N Congress Ave #24 Boynton Beach, FL | 2.0 | 1.0 | 902 | $1,700 | $1.88 | 4d | 1 | 0.51mi |
| 4101 Mahogany Dr Boynton Beach, FL | 1.0–2.0 | 1.0–2.0 | 950 | $2,159 | $2.27 | 0d | 12 | 0.52mi |
| 80 Baytree Cir Boynton Beach, FL | 3.0 | 2.0 | 1584 | $3,230 | $2.04 | 16d | 1 | 0.55mi |
| 6 Via de Casas Sur #104 Boynton Beach, FL | 2.0 | 2.0 | 996 | $2,195 | $2.20 | 25d | 1 | 0.57mi |
| 8202 White Rock Cir Boynton Beach, FL | 3.0 | 2.0 | 1738 | $3,300 | $1.90 | 8d | 1 | 0.61mi |
| 18 Via de Casas Sur #205 Boynton Beach, FL | 3.0 | 2.0 | 1096 | $2,750 | $2.51 | 25d | 1 | 0.61mi |
| 15 Via de Casas Sur #204 Boynton Beach, FL | 2.0 | 2.0 | 996 | $2,400 | $2.41 | 25d | 1 | 0.66mi |
| 1071 Fosters Mill Rd Boynton Beach, FL | 3.0 | 2.0 | 1615 | $2,900 | $1.80 | 6d | 1 | 0.66mi |
| 220 Savannah Lakes Dr Boynton Beach, FL | 2.0 | 2.0 | 1098 | $2,365 | $2.15 | 4d | 1 | 0.69mi |
| 51 Meadows Dr Boynton Beach, FL | 2.0 | 2.0 | 1263 | $2,400 | $1.90 | 25d | 1 | 0.70mi |
| 1239 Sussex St Boynton Beach, FL | 3.0 | 2.0 | 1436 | $3,100 | $2.16 | 25d | 1 | 0.73mi |
| 1239 Sussex St Boynton Beach, FL | 3.0 | 2.0 | 1436 | $3,100 | $2.16 | 20d | 1 | 0.73mi |
| 54 Egret Way Boynton Beach, FL | 3.0 | 2.0 | 1608 | $3,500 | $2.18 | 3d | 1 | 0.76mi |
| 3736 Coelebs Ave Boynton Beach, FL | 3.0 | 2.0 | 1232 | $3,000 | $2.44 | 25d | 1 | 0.79mi |
| 1831 Renaissance Commons Blvd Boynton Beach, FL | 2.0 | 2.0 | 975 | $2,210 | $2.27 | 25d | 1 | 0.81mi |
| 1831 Renaissance Commons Blvd Boynton Beach, FL | 2.0 | 2.0 | 975 | $2,230 | $2.29 | 6d | 1 | 0.81mi |
| 2791 S Evergreen Cir Boynton Beach, FL | 3.0 | 2.5 | 1727 | $3,200 | $1.85 | 25d | 1 | 0.85mi |
| 2789 S Evergreen Cir Boynton Beach, FL | 3.0 | 2.5 | 1626 | $3,000 | $1.85 | 18d | 1 | 0.85mi |
| 3901 Medford Ct Boynton Beach, FL | 2.0 | 2.5 | 1374 | $2,650 | $1.93 | 6d | 1 | 0.86mi |
| 3901 Medford Ct Boynton Beach, FL | 2.0 | 2.5 | 1374 | $2,650 | $1.93 | 25d | 1 | 0.86mi |
| 3 Afton Pl Boynton Beach, FL | 2.0 | 2.0 | 1196 | $2,645 | $2.21 | 20d | 1 | 0.87mi |
| 1605 Renaissance Commons Blvd Boynton Beach, FL | 1.0–3.0 | 1.0–2.0 | 1148 | $2,538 | $2.21 | 0d | 13 | 0.89mi |
| 8949 Oak St Boynton Beach, FL | 2.0 | 2.0 | 1040 | $1,300 | $1.25 | 25d | 1 | 0.89mi |
| 4220 Grove Park Ln Unit 1 Boynton Beach, FL | 3.0 | 2.0 | 1406 | $3,600 | $2.56 | 25d | 1 | 0.90mi |
| 4220 Grove Park Ln Unit 1 Boynton Beach, FL | 3.0 | 2.0 | 1406 | $3,400 | $2.42 | 5d | 1 | 0.90mi |
| 1859 Via Granada Boynton Beach, FL | 3.0 | 3.0 | 1805 | $2,995 | $1.66 | 25d | 1 | 0.90mi |
| 2866 S Oasis Dr Boynton Beach, FL | 3.0 | 2.5 | 1739 | $3,100 | $1.78 | 15d | 1 | 0.91mi |
| 4408 Renaissance Way Unit 408 Boynton Beach, FL | 2.0 | 2.0 | 1048 | $2,350 | $2.24 | 18d | 1 | 0.92mi |
HOA detail
- Monthly dues
- $1,004 · $12,048/yr
- Likely covers
- poolgymsecurity
Listing history 16 events
-
2026-06-21days on market $115,000 Active 218 DOM
-
2026-06-18days on market $115,000 Active 215 DOM
-
2026-06-17days on market $115,000 Active 214 DOM
-
2026-06-16days on market $115,000 Active 213 DOM
-
2026-06-15days on market $115,000 Active 212 DOM
-
2026-06-13days on market $115,000 Active 210 DOM
-
2026-06-09days on market $115,000 Active 206 DOM
-
2026-06-07days on market $115,000 Active 204 DOM
-
2026-06-04days on market $115,000 Active 201 DOM
-
2026-06-03days on market $115,000 Active 200 DOM
-
2026-06-01days on market $115,000 Active 198 DOM
-
2026-05-31days on market $115,000 Active 197 DOM
-
2026-02-25price $115,000
-
2025-11-15$129,000 Active
-
2025-08-14historical
-
2025-03-14$139,000 Active
ⓘ Source: listings_history table (triggers on properties + properties_extension) + one-shot
backfill from property_details.listing_events for pre-trigger history.
Climate risk First Street
- Flood 4/10 Moderate FEMA zone X (unshaded) · 22% chance over 30 yrs
- Wildfire 1/10 Low
- Heat 9/10 Extreme 7 d/yr ≥106°F today · 25 d/yr by 30 yrs out
- Wind 10/10 Extreme 99% chance of damaging wind over 30 yrs
- Air quality 2/10 Low 0 unhealthy d/yr today · 2 by 30 yrs out
Nearby sold comps map
Loading sold comps map…
Walkable amenities ~0.75 mi
Loading nearby amenities…
Taxation est. · year 1
- Rental income
- $31,013
- − Mortgage interest
- −$6,442
- − Property taxes
- −$1,725
- − Insurance
- −$575
- − Repairs & maintenance
- −$2,481
- − Management
- −$2,481
- − HOA
- −$12,048
- − Depreciation
- −$3,345
- Taxable income
- $1,916
- Est. tax owed @ 24.0%
- −$460
- After-tax cash flow
- $2,456/yr
For passive investors: Depreciation is non-cash, so a rental often shows a tax loss while cash-flowing — sheltering income. Rental losses are passive: they offset passive income freely, and up to $25,000/yr can offset ordinary (W-2) income if you actively participate and your MAGI is under $100k (phasing out to $0 by $150k); unused losses carry forward. On sale, claimed depreciation is recaptured at up to 25%, and gains may owe capital-gains tax (a 1031 exchange can defer both). Figures are a year-1 estimate at your 24.0% rate — not tax advice; consult a CPA.
Schools (NCES district)
- District
- Palm Beach
- NCES district ID
- 1201500
- Math proficiency
- 46% ▼ -16.00%
- Reading proficiency
- 53% ▼ -4.00%
- Median HH income
- $53,943
- Composite
- 42.72/100
- National rank
- #3160
- State rank
- #34 of 73 in FL
Livability — Boynton Beach
- Score
- 72/100
- State rank
- #351
- US rank
- #6098
Category grades
Schools grade is shown separately in the Schools card above.
Census & demographics
- County
- Palm Beach County · 1,438,312 people
- City population
- 148,060
- Metro
- Miami-Fort Lauderdale-Pompano Beach, FL
- Population (ZIP)
- 48,743
- Household income
- $75,789
- Rent vs Own
- Severe rent burden
- 1813.0
Population outlook (Palm Beach County) Hauer SSP2
- Today (2025)
- 1,637,487 people
- By 2030
- 1,743,255 · +6.5%
- By 2040
- 1,948,712 · +19.0%
- By 2050
- 2,132,979 · +30.3%
- By 2075
- 2,530,027 · +54.5%
- By 2100
- 2,706,979 · +65.3%
Race, ethnicity, and origin ACS 2023
- Neighborhood character
- Diverse neighborhood (Simpson 0.64)
- Race & ethnicity
- White 52% Black 24% Hispanic / Latino 19% Two or more races 10% Asian 2%
- Hispanic origin (detail)
- Mexican 2% Puerto Rican 4% Cuban 3% Dominican 1%
- Common ancestry
- Hispanic 12% Romanian 3% Scotch-Irish 2%
- Foreign-born
- 27% · Canada, Jamaica, Vietnam
- Languages at home
- 64% English-only · Spanish 14% French/Haitian/Cajun 13% Other Indo-European 2%
Political lean MEDSL · Palm Beach
- 2024 margin
- Toss-up / Even · D 50.0% · R 49.2%
- 2008→2024 swing
- -22.1pp toward R · 2008: 22.9pp · 2024: 0.8pp
- All cycles
- 2024: D+0.8 2020: D+12.8 2016: D+15.3 2012: D+17.0 2008: D+22.9
Not yet ingested
- Civics
- —
Market trends
- HPI YoY
- ▼ -109.59%
- Current HPI
- 311.7742
- Rent YoY
- ▼ -0.57%
- Metro
- Miami-Fort Lauderdale-Pompano Beach, FL
- State GDP YoY
- ▲ 3.28%
- F500 in state
- 36
Industry mix (Fortune 500 HQ in FL)
| Industry | F500 HQs | Revenue |
|---|---|---|
| Industrial Technology | 2 | $29B |
|
||
| Insurance | 2 | $17B |
|
||
| Retail | 1 | $60B |
|
||
| Technology Distribution | 1 | $58B |
|
||
| Homebuilding | 1 | $35B |
|
||
| Technology Manufacturing | 1 | $35B |
|
||
Price history
-17.3% since first listed4 events — show timeline
- 2026-02-25 Price Changed $115,000 MCRTC
- 2025-11-15 Listed $129,000 MCRTC
- 2025-08-14 Listing Removed — MCRTC
- 2025-03-14 Listed $139,000 MCRTC
Cash-flow waterfall
monthlySold comps — $/sqft
last 12 mo · ≤1 miLoading sold comps…