 Multi-family
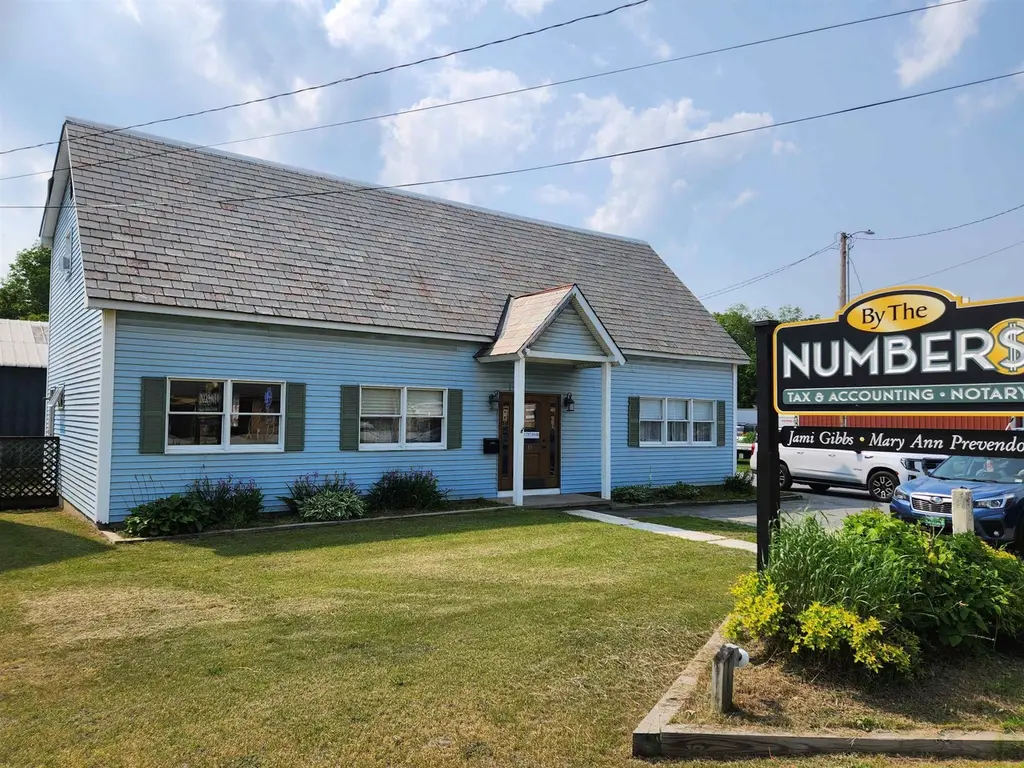
53-55 VT Route 30 N · Castleton, VT
Flood risk 1/10 · Minimal
- FEMA flood zone
- X (unshaded)
- Chance of flooding over 30 yrs
- 0.0%
- Est. flood insurance / yr
- $507 – $1,088
Fire risk 2/10 · Minimal
- Est. fire insurance / yr
- $480 – $892
Heat risk 3/10 · Minor
- Hot days now (above 92°F)
- 7 days/yr
- Hot days in 30 yrs
- 17 days/yr
Wind risk 2/10 · Minimal
- Chance of severe wind over 30 yrs
- 2.0%
Air-quality risk 1/10 · Minimal
- Unhealthy air days now
- 0 days/yr
- Unhealthy air days in 30 yrs
- 0 days/yr
Risk factors via First Street. Map © Google.
Why this score? — see what drove the C- grade
The composite is a weighted blend of 9 inputs, each scored 0–100. Each bar is that input's sub-score; the figure is the points it added to the 100-point composite (weight × sub-score).
- Cash flow +14.1/30.0
- ARV discount +7.5/15.0
- Appreciation +7.3/10.0
- Schools +5.0/10.0
- DSCR +4.3/10.0
- 1% rule +3.9/10.0
- Livability +3.2/5.0
- Condition / age +2.8/5.0
- Rent growth +2.5/5.0
$539,000
🖨 Deal sheet (PDF) 📄 Offer letter ✓ Due diligence
Multi-family units
County records classify this as Multi-Family (2-4 Unit). Listing-text estimate: 1 unit. estimate disagrees with records
Listing remarks MLS
Prime Location at Castleton Four Corners !! Three buildings offering multiple uses including 3 residential rental units, 1 commercial space and 1 large 320 x 80 storage barn. All units upgraded as rentals changed. Only 1 unit left to renovate with long term tenant. This property offers an excellent investment opportunity with a great return on investment!! Financial statement's available upon request to qualified buyers. Don't let this opportunity pass you buy!!
Key facts
- 0.44 acre lot
- Built 1939
- Listed 81 days
Neighborhood map
What this means for you Summary
Snapshot
- This is a 4-bed/2.0-bath multifamily listed at $539k. Condition is rated average.
Deal economics
- At list price, monthly cash flow is $80 ($957/yr) — positive.
- The deal already cash-flows at list — no discount required.
- To meet the 1% rule (rent ≥ 1% of price), the offer needs to be $482k (10.6% below list).
- Recommended offer: $482k (10.6% below list) — sets the bar for 1% rule.
Location & tenants
- Location reads 64/100 on livability (#66 in VT) — a middle-class / working-renter tenant base. Strengths: crime A+, health & safety A; Watch: amenities F, commute F, employment F.
- Zoned schools: Fair Haven Union Middle And High School (math 12% / reading 32%, grade F, #45 of 48 statewide, top 94%, 536 students, 26% FRL).
- Market conditions: 43 active listings in the ZIP; 90 units permitted in Rutland County in 2024 (0 in 5+ unit buildings).
Forward outlook
- In year one you build about $28k of equity ($4k loan paydown + $25k appreciation (4.6% local appreciation)).
- Rutland County population projected at -28% by 2050 — secular population decline; favor cash flow + early exit over multi-decade hold.
- At projected returns (4.6% appreciation + 3.0% rent growth), your $151k cash investment doubles in ~5 years — after that, you're playing with house money.
- By year 2, paydown + projected appreciation supports a ~$46k cash-out refi (75% LTV) — recoverable capital for the next deal without selling this one.
Negotiation context
- It's been on market 81 days — a 6% lower offer ($507k) is reasonable based on typical stale-listing flexibility.
Risks & watch-outs
- Watch-outs: built in 1939 — expect roof / HVAC / electrical / plumbing capex.
Questions for the listing agent
- It's been on market 81 days. Have you received any prior offers? Is the seller open to a 11% concession, seller financing, or rate buy-down credit?
- Built in 1939 — when were the roof, HVAC, electrical panel, plumbing, and water heater last replaced?
- Why hasn't it sold? Are there any deal-killer items the seller is aware of (foundation, flood, title, zoning, code violations)?
- Is there a deadline driving the sale (1031 exchange, divorce, estate, relocation)? That informs how much negotiation room exists.
- Schools are F-rated, which usually means shorter tenancies and higher turnover. Who's the typical renter profile here, and what's been the actual vacancy rate?
- What's the average days-on-market for RENTAL listings here right now (not sales)? A rising rental-DOM trend means longer vacancies and softer asking-rent achievability than the comps imply.
- What's the recent tenant-quality profile in this submarket — average credit score on applications, eviction rate, late-payment / NSF rate, and stable-employment percentage? A property-management company in the area should have these aggregated.
- How much new apartment / multifamily construction is in the pipeline within 1–3 miles? Heavy new supply (>2% of stock underway) typically softens rents 12–24 months out; light construction supports rent growth.
Investment metrics
- 1% rule
- 0.89% ✗
- Cap rate
- 6.47%
- Cash-on-cash
- 0.63%
- DSCR
- 1.03
- GRM
- 9.3
CMA / ARV
- ARV (median comp)
- $239,342
- List price
- $539,000
- Delta
- 125.20%
- Verdict
- OVERPRICED
- Comps
- 1 within 2.0 mi
Projected returns pro-forma
4.57% appreciation · 3.0% rent growth · sell at horizon
- IRR
- 12.3%
- Equity multiple
- 1.77×
- Total profit
- $116,256
- Equity at exit
- $291,480
- IRR
- 13.5%
- Equity multiple
- 3.34×
- Total profit
- $353,816
- Equity at exit
- $491,870
Cash invested: $150,920 (down + closing). Projections, not guarantees.
Landlord ↔ Tenant lean methodology
- Overall (STATE)
- 41 Moderately Tenant-Leaning
- State Vermont
- 41 Moderately Tenant-Leaning · D+15
- County
- — inherits STATE
- City
- — inherits STATE
ZIP-level market 05735
- Home prices YoY
- 1.3%
- Active inventory
- 43
- Price-to-rent
- 28.0×
Monthly cashflow live
- Estimated rent
- $4,816 medium interval (Pro) →
- Mortgage (P&I)
- −$2,827
- Tax est. 1.5%
- −$674 /mo · $8,085/yr
- Insurance
- −$225
- HOA
- −$0
- Vacancy / Maint / Mgmt
- −$1,011
- Net cashflow
- $80
Break-even live
Sensitivity live
| Price | -10% $452 | -5% $266 | +0% $80 | +5% $-107 | +10% $-293 |
|---|---|---|---|---|---|
| Rent | -10% $-301 | -5% $-110 | +0% $80 | +5% $270 | +10% $460 |
| Rate | -1.0pp $351 | -0.5pp $217 | base $80 | +0.5pp $-60 | +1.0pp $-202 |
3-unit breakdown (identical units grouped — click to expand)
| Units | Beds | Baths | Est. rent |
|---|---|---|---|
| 3× units | 3 | 1 | $4,815 |
| #1 | 3 | 1 | $1,605 |
| #2 | 3 | 1 | $1,605 |
| #3 | 3 | 1 | $1,605 |
| Total (3 units) | $4,816 | ||
UW: 25.0% down · 7.5% · 30yr · 1.5% tax · 5.0% vac · 8.0% maint · 8.0% mgmt
Financing live
Cash to close
- Down payment
- $134,750
- Closing costs
- $16,170
- Reserves months
- —
- Total cash needed
- —
Loan-product check · same deal, 3 products live
Conventional
25% down · 7.5% · 30yr
- Down + closing
- —
- Monthly P&I
- —
- Monthly cashflow
- —
- DSCR
- —
- Eligible?
- —
Personal DTI + credit; lowest rate.
DSCR
20% down · 8.5% · 30yr
- Down + closing
- —
- Monthly P&I
- —
- Monthly cashflow
- —
- DSCR
- —
- Eligible?
- —
No personal income docs; deal must DSCR.
Hard money
10% down · 12.0% · 12mo
- Down + closing
- —
- Monthly P&I
- —
- Monthly cashflow
- —
- DSCR
- —
- Eligible?
- —
Short-term bridge; refi at stabilization.
Listing history 18 events
-
2026-06-21days on market $539,000 Active 81 DOM
-
2026-06-21days on market $539,000 Active 80 DOM
-
2026-06-18days on market $539,000 Active 78 DOM
-
2026-06-17days on market $539,000 Active 77 DOM
-
2026-06-16days on market $539,000 Active 76 DOM
-
2026-06-15days on market $539,000 Active 75 DOM
-
2026-06-15days on market $539,000 Active 74 DOM
-
2026-06-13days on market $539,000 Active 73 DOM
-
2026-06-12days on market $539,000 Active 72 DOM
-
2026-06-09days on market $539,000 Active 69 DOM
-
2026-06-08days on market $539,000 Active 68 DOM
-
2026-06-08days on market $539,000 Active 67 DOM
-
2026-06-07days on market $539,000 Active 66 DOM
-
2026-06-03days on market $539,000 Active 63 DOM
-
2026-06-02days on market $539,000 Active 62 DOM
-
2026-06-01days on market $539,000 Active 61 DOM
-
2026-05-31days on market $539,000 Active 60 DOM
-
2026-04-01$539,000 Active 466-char remark
Show marketing remark (466 chars)
Prime Location at Castleton Four Corners !! Three buildings offering multiple uses including 3 residential rental units, 1 commercial space and 1 large 320 x 80 storage barn. All units upgraded as rentals changed. Only 1 unit left to renovate with long term tenant. This property offers an excellent investment opportunity with a great return on investment!! Financial statement's available upon request to qualified buyers. Don't let this opportunity pass you buy!!
ⓘ Source: listings_history table (triggers on properties + properties_extension) + one-shot
backfill from property_details.listing_events for pre-trigger history.
Climate risk First Street
- Flood 1/10 Low FEMA zone X (unshaded) · 0% chance over 30 yrs
- Wildfire 2/10 Low
- Heat 3/10 Moderate 7 d/yr ≥92°F today · 17 d/yr by 30 yrs out
- Wind 2/10 Low 2% chance of damaging wind over 30 yrs
- Air quality 1/10 Low 0 unhealthy d/yr today · 0 by 30 yrs out
Nearby sold comps map
Loading sold comps map…
Walkable amenities ~0.75 mi
Loading nearby amenities…
Taxation est. · year 1
- Rental income
- $57,792
- − Mortgage interest
- −$30,192
- − Property taxes
- −$8,085
- − Insurance
- −$2,695
- − Repairs & maintenance
- −$4,623
- − Management
- −$4,623
- − Depreciation
- −$15,680
- Taxable loss
- −$8,107
- Est. tax savings @ 24.0%
- +$1,946
- After-tax cash flow
- $2,902/yr
For passive investors: Depreciation is non-cash, so a rental often shows a tax loss while cash-flowing — sheltering income. Rental losses are passive: they offset passive income freely, and up to $25,000/yr can offset ordinary (W-2) income if you actively participate and your MAGI is under $100k (phasing out to $0 by $150k); unused losses carry forward. On sale, claimed depreciation is recaptured at up to 25%, and gains may owe capital-gains tax (a 1031 exchange can defer both). Figures are a year-1 estimate at your 24.0% rate — not tax advice; consult a CPA.
Condition & rehab AI · 14 photos
This multi-family property offers a good investment opportunity with a prime location. It requires moderate renovations to improve its condition and increase its value, with a focus on the roof, exterior, and interior updates.
Repairs flagged
- Major Roof inspection — Shingles may need replacement or repair
- Moderate Siding touch-up or repainting — Siding appears intact but may need touch-up or repainting
- Minor Hardwood flooring cleaning or refinishing — Flooring appears in good condition but may need cleaning or refinishing
- Moderate Paint touch-up or repainting — Paint appears faded in some areas, may need touch-up or repainting
- Moderate Bathroom updates — Bathrooms appear functional but may need updates in fixtures or finishes
- Moderate Kitchen updates — Kitchen appears functional but may need updates in appliances or finishes
Value-add opportunities
- Resale Roof replacement — A new roof would significantly increase the home's value and appeal to potential buyers
- Resale Siding and paint updates — Fresh siding and paint would enhance the home's curb appeal and increase its resale value
- Resale Flooring refinishing — Refinished hardwood flooring would improve the home's aesthetic and increase its resale value
- Resale Bathroom updates — Modernized bathrooms would improve the home's appeal and increase its resale value
- Resale Kitchen updates — Upgraded kitchen appliances and finishes would enhance the home's appeal and increase its resale value
- Rental HVAC system inspection and maintenance — A well-maintained HVAC system would improve tenant comfort and satisfaction, increasing rental value
- Both Landscaping enhancements — Enhanced landscaping would improve the home's curb appeal and increase both its resale and rental value
Renovation cost estimate screening
| Repair item | Severity | Est. cost |
|---|---|---|
| Roof inspection · Shingles may need replacement or repair | Major | $15,000–50,000 |
| Siding touch-up or repainting · Siding appears intact but may need touch-up or repainting | Moderate | $3,000–15,000 |
| Hardwood flooring cleaning or refinishing · Flooring appears in good condition but may need cleaning or refinishing | Minor | $500–3,000 |
| Paint touch-up or repainting · Paint appears faded in some areas, may need touch-up or repainting | Moderate | $3,000–15,000 |
| Bathroom updates · Bathrooms appear functional but may need updates in fixtures or finishes | Moderate | $3,000–15,000 |
| Kitchen updates · Kitchen appears functional but may need updates in appliances or finishes | Moderate | $3,000–15,000 |
| Total estimated repair cost · 6 items | $27,500–113,000 |
Value-add ROI direction
- Resale Roof replacement — A new roof would significantly increase the home's value and appeal to potential buyers ↑
- Resale Siding and paint updates — Fresh siding and paint would enhance the home's curb appeal and increase its resale value ↑
- Resale Flooring refinishing — Refinished hardwood flooring would improve the home's aesthetic and increase its resale value ↑
- Resale Bathroom updates — Modernized bathrooms would improve the home's appeal and increase its resale value ↑
- Resale Kitchen updates — Upgraded kitchen appliances and finishes would enhance the home's appeal and increase its resale value ↑
- Rental HVAC system inspection and maintenance — A well-maintained HVAC system would improve tenant comfort and satisfaction, increasing rental value ↑
- Both Landscaping enhancements — Enhanced landscaping would improve the home's curb appeal and increase both its resale and rental value ↑
ⓘ Cost ranges are severity-bucket heuristics (US national rule-of-thumb). Get contractor quotes + a written scope before underwriting a rehab budget.
Schools (NCES district)
No district data.
Livability — Castleton
- Score
- 64/100
- State rank
- #66
- US rank
- #14870
Category grades
Schools grade is shown separately in the Schools card above.
Census & demographics
- Census place
- Castleton Four Corners, VT
- Population (ZIP)
- 3,632
Population outlook (Rutland County) Hauer SSP2
- Today (2025)
- 55,307 people
- By 2030
- 52,364 · -5.3%
- By 2040
- 45,751 · -17.3%
- By 2050
- 39,627 · -28.4%
- By 2075
- 29,080 · -47.4%
- By 2100
- 20,673 · -62.6%
Race, ethnicity, and origin ACS 2023
- Neighborhood character
- Predominantly White (92%)
- Race & ethnicity
- White 92% Two or more races 5% Hispanic / Latino 4%
- Common ancestry
- Lithuanian 5% Romanian 3% Serbian 3%
- Foreign-born
- 1%
- Languages at home
- 95% English-only · Spanish 3% French/Haitian/Cajun 1%
Political lean MEDSL · Rutland
- 2024 margin
- Lean D (+5.3) · D 51.3% · R 46.0% · Other 2.7%
- 2008→2024 swing
- -19.3pp toward R · 2008: 24.6pp · 2024: 5.3pp
- All cycles
- 2024: D+5.3 2020: D+10.5 2016: D+4.2 2012: D+22.0 2008: D+24.6
Not yet ingested
- Civics
- —
Market trends
- HPI YoY
- ▲ 4.57%
- Current HPI
- 345.6534
- Rent YoY
- —
- Metro
- —
- State GDP YoY
- —
- F500 in state
- 0
Price history
1 event — show timeline
- 2026-04-01 Listed $539,000 PrimeMLS
Cash-flow waterfall
monthlySold comps — $/sqft
last 12 mo · ≤1 miLoading sold comps…