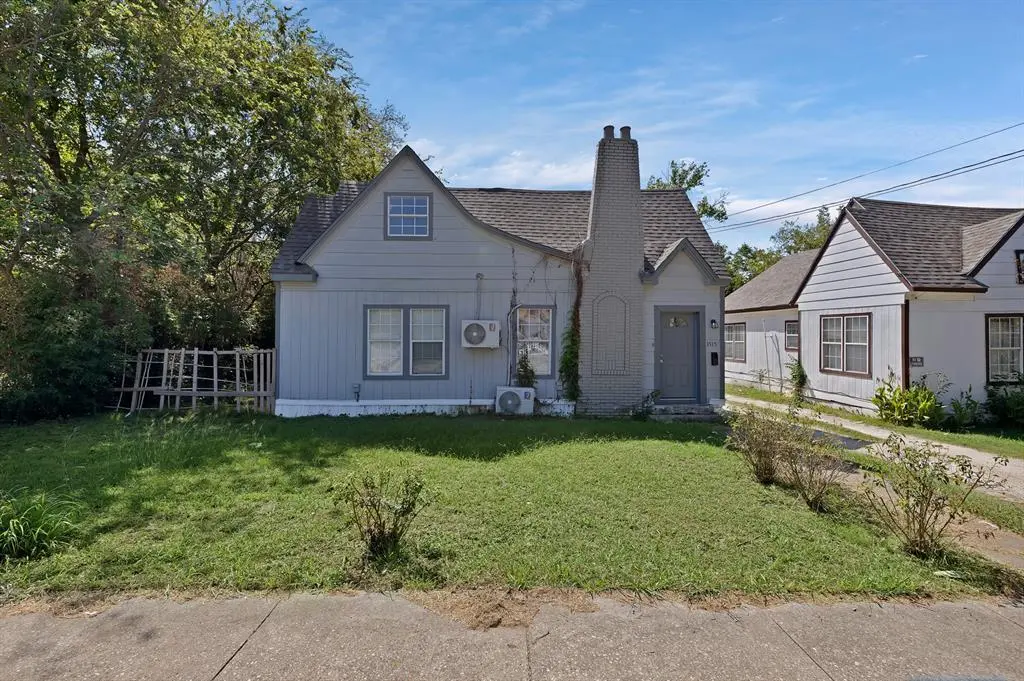
3515 Lee St · Greenville, TX
Flood risk 1/10 · Minimal
- FEMA flood zone
- X (unshaded)
- Chance of flooding over 30 yrs
- 0.0%
- Est. flood insurance / yr
- $507 – $1,088
Fire risk 5/10 · Moderate
- Est. fire insurance / yr
- $1,222 – $2,270
Heat risk 7/10 · Major
- Hot days now (above 110°F)
- 7 days/yr
- Hot days in 30 yrs
- 23 days/yr
Wind risk 6/10 · Moderate
- Chance of severe wind over 30 yrs
- 27.0%
Air-quality risk 2/10 · Minimal
- Unhealthy air days now
- 1 days/yr
- Unhealthy air days in 30 yrs
- 1 days/yr
Risk factors via First Street. Map © Google.
Why this score? — see what drove the D+ grade
The composite is a weighted blend of 9 inputs, each scored 0–100. Each bar is that input's sub-score; the figure is the points it added to the 100-point composite (weight × sub-score).
- ARV discount +15.0/15.0
- Cash flow +13.3/30.0
- 1% rule +4.5/10.0
- DSCR +4.0/10.0
- Livability +3.9/5.0
- Rent growth +2.7/5.0
- Condition / age +2.5/5.0
- Schools +2.0/10.0
- Appreciation +0.0/10.0
$185,000
🖨 Deal sheet (PDF) 📄 Offer letter ✓ Due diligence
Listing remarks
Spacious 2-Story Home with Workshop & Fireplace in Greenville! Welcome to 3515 Lee Street — this well-maintained 4-bedroom, 2-bath home features multiple living areas, a cozy fireplace, and a flexible layout perfect for families or multi-use living. The large kitchen connects to a formal dining room and additional sitting areas, offering plenty of space to entertain. Upstairs includes two additional bedrooms and a bonus living area. Outside, enjoy the oversized carport, back deck, and a detached workshop ideal for hobbies or storage. Conveniently located near shopping, dining, and schools. OWNER FINANCE AVAILABLE!!! Contact Listing agent for terms!
Key facts
- Bonus living area
- Oversized carport
- Flexible layout
Tags
Property features AI
Finance
- Other: Transaction type: For Sale; Possession at closing/funding; Listing agreement: Exclusive right to sell
- Financial info: Listing terms include Cash, Conventional, and Owner will carry; No second mortgage
- HOA & community: No homeowners association
Exterior
- Parking: Attached carport; Covered parking for 2 vehicles; 2 carport spaces
- Security: No specific security features provided
- Utilities: City water; City sewer; Not in a municipal utility district
- Home design: Single-family residence; Residential property; Property attached: Yes; Built in 1965
- Construction: Year built 1965; No construction material, roof, or foundation details provided
- Exterior features: Lot under 0.5 acre (approximately 0.124 acre); Subdivision: Orig Town Of Greenville
Interior
- Kitchen: Electric range
- Bedrooms: 4 bedrooms; Primary bedroom on main level (15 x 11)
- Flooring: No flooring details provided
- Bathrooms: 2 full bathrooms
- Heating & cooling: No heating or cooling details provided
- Interior features: Two-level layout; One living area; One dining area; Decorative fireplace in the living room; Other interior features
- Laundry & utility: No specific laundry details provided
Neighborhood map
What this means for you Summary
Snapshot
- This is a 4-bed/2.0-bath single-family listed at $185k.
Deal economics
- At list price, monthly cash flow is $-1 ($-17/yr) — negative.
- To cash-flow at today's rent, offer at most $185k (0.1% below list).
- To meet the 1% rule (rent ≥ 1% of price), the offer needs to be $175k (5.3% below list).
- Recommended offer: $175k (5.3% below list) — sets the bar for 1% rule.
- Cap rate 6.3% vs local median 4.1% in Greenville — top-decile yield for the area; either an underpriced asset or a hidden risk that comps aren't pricing in. Stress-test before assuming the spread holds.
Location & tenants
- Location reads 77/100 on livability (#78 in TX, #2,719 nationally) — a middle-class / working-renter tenant base. Strengths: cost of living A+, housing A+, health & safety A; Watch: employment D, commute F.
- Greenville ISD (town): math 20% / reading 26% proficiency, ranked #743 of 826 in TX (top 90%) — low school quality limits family demand, transient renter base, plan for 1-2y turnover.
- Zoned schools: Carver El (math 18% / reading 15%, grade F, #3,946 of 4,322 statewide, top 92%, 524 students, 93% FRL) — zoned schools average 93% FRL vs 55% district-wide (38 pts higher); higher-poverty schools than district average — tighter screening recommended.
- Market conditions: Rents flat; 395 active listings in the ZIP; 40 comparable units currently listed for rent nearby; rentals at typical pace (median 26d on market — plan ~3-4 weeks tenant-placement turnaround); 42% of comp listings sitting > 30 days — soft ceiling on asking rent; 1,289 units permitted in Hunt County in 2024 (527 in 5+ unit buildings).
- This rent runs 35% of the median local income ($60k/yr) — at the standard rent-burdened threshold; future hikes will face affordability resistance.
Forward outlook
- Local home prices are declining (-3.0%/yr); year-one equity from $1k of loan paydown is wiped out by about $6k of value loss. Plan a longer hold.
- Hunt County population projected at +15% by 2050 — modest demand growth; plan on rents tracking national, not racing it.
Negotiation context
- Only 13 days on market — expect competitive offers; lowballing is unlikely to land.
- 2 sale attempts with the ask held roughly flat each time — persistent listings suggest the price (not the market) is what's stuck; bring a comps-based counter.
Risks & watch-outs
- Climate carrying-cost: major wind risk, 27% chance of damaging wind over 30y; moderate wildfire risk; extreme-heat days projected 7→23/yr by 2055 (HVAC capex compounding) — expect insurance premiums to compound above CPI over the hold.
Questions for the listing agent
- What do current leases actually rent for vs. the listed asking? Can we see a recent rent roll and the last 12 months of T-12 income?
- Built in 1965 — when were the roof, HVAC, electrical panel, plumbing, and water heater last replaced?
- Is there a deadline driving the sale (1031 exchange, divorce, estate, relocation)? That informs how much negotiation room exists.
- Schools are D-rated, which usually means shorter tenancies and higher turnover. Who's the typical renter profile here, and what's been the actual vacancy rate?
- The area grade is low — what's the realistic commute time and amenity access for the typical tenant pool here? Any planned neighborhood developments (good or bad) we should know about?
- What's the average days-on-market for RENTAL listings here right now (not sales)? A rising rental-DOM trend means longer vacancies and softer asking-rent achievability than the comps imply.
- What's the recent tenant-quality profile in this submarket — average credit score on applications, eviction rate, late-payment / NSF rate, and stable-employment percentage? A property-management company in the area should have these aggregated.
- How much new for-sale + rental construction is in the pipeline within 1–3 miles? Heavy new supply typically softens prices + rents 12–24 months out; constrained supply supports both.
Investment metrics
- 1% rule
- 0.95% ✗
- Cap rate
- 6.28%
- Cash-on-cash
- -0.03%
- DSCR
- 1.00
- GRM
- 8.8
CMA / ARV
- ARV (on-the-fly)
- $243,860
- Comps found
- 12
Show comp detail 12 sales within ~0.75 mi
| Address | Dist | Beds/Ba | Sqft | Sold | Price | $/sf | Match |
|---|---|---|---|---|---|---|---|
| 3525 Lee St | 0.02mi | 3/2.0 (-1) | 1,750 (-2%) | 1mo | $234,999 | $134 | 91 |
| 3717 Lee St | 0.15mi | 4/2.0 | 1,553 (-13%) | 2mo | $231,500 | $149 | 70 |
| 4501 Washington St | 0.62mi | 4/2.5 | 1,771 (-0%) | 1mo | $268,888 | $152 | 67 |
| 3915 Caddo St | 0.56mi | 4/3.0 | 1,737 (-2%) | 6mo | $297,700 | $171 | 61 |
| 1708 Wright St | 0.45mi | 3/2.0 (-1) | 1,640 (-8%) | 1mo | $224,990 | $137 | 60 |
| 3817 Spencer St | 0.29mi | 3/2.0 (-1) | 1,521 (-15%) | 0mo | $199,900 | $131 | 57 |
| 3901 Oneal St | 0.60mi | 4/2.0 | 1,607 (-10%) | 1mo | $168,000 | $105 | 55 |
| 1411 Wesley St | 0.70mi | 4/2.0 | 1,895 (+6%) | 6mo | $250,000 | $132 | 52 |
| 4020 Spencer St | 0.39mi | 3/2.0 (-1) | 1,605 (-10%) | 10mo | $95,000 | $59 | 52 |
| 3420 Caddo St | 0.46mi | 3/2.0 (-1) | 1,574 (-12%) | 4mo | $165,000 | $105 | 51 |
| 4613 Lee St | 0.73mi | 4/2.0 | 1,911 (+7%) | 4mo | $285,000 | $149 | 50 |
| 3012 Silver St | 0.65mi | 3/2.0 (-1) | 1,619 (-9%) | 0mo | $260,000 | $161 | 50 |
Match score weights: distance 35% · size 25% · config 20% · recency 20%. Top-matched comps best support the ARV.
Projected returns pro-forma
-3.0% appreciation · 0.62% rent growth · sell at horizon
- IRR
- -19.2%
- Equity multiple
- 0.34×
- Total profit
- $-34,078
- Equity at exit
- $27,584
- IRR
- -18.3%
- Equity multiple
- 0.12×
- Total profit
- $-45,456
- Equity at exit
- $15,995
Cash invested: $51,800 (down + closing). Projections, not guarantees.
Landlord ↔ Tenant lean methodology
- Overall (STATE)
- 87 Strongly Landlord-Friendly
- State Texas
- 87 Strongly Landlord-Friendly · R+5
- County
- — inherits STATE
- City
- — inherits STATE
ZIP-level market 75401
- Home prices YoY
- -20.7%
- Rents YoY
- 0.6%
- Active inventory
- 395
- Price-to-rent
- 8.8×
Monthly cashflow live
- Estimated rent
- $1,752 high interval (Pro) →
- Mortgage (P&I)
- −$970
- Tax from tax record
- −$339 /mo · $4,064/yr
- Insurance
- −$77
- HOA
- −$0
- Vacancy / Maint / Mgmt
- −$368
- Net cashflow
- $-1
Break-even live
Sensitivity live
| Price | -10% $103 | -5% $51 | +0% $-1 | +5% $-54 | +10% $-106 |
|---|---|---|---|---|---|
| Rent | -10% $-140 | -5% $-71 | +0% $-1 | +5% $68 | +10% $137 |
| Rate | -1.0pp $92 | -0.5pp $46 | base $-1 | +0.5pp $-49 | +1.0pp $-98 |
UW: 25.0% down · 7.5% · 30yr · 1.5% tax · 5.0% vac · 8.0% maint · 8.0% mgmt
Financing live
Cash to close
- Down payment
- $46,250
- Closing costs
- $5,550
- Reserves months
- —
- Total cash needed
- —
Loan-product check · same deal, 3 products live
Conventional
25% down · 7.5% · 30yr
- Down + closing
- —
- Monthly P&I
- —
- Monthly cashflow
- —
- DSCR
- —
- Eligible?
- —
Personal DTI + credit; lowest rate.
DSCR
20% down · 8.5% · 30yr
- Down + closing
- —
- Monthly P&I
- —
- Monthly cashflow
- —
- DSCR
- —
- Eligible?
- —
No personal income docs; deal must DSCR.
Hard money
10% down · 12.0% · 12mo
- Down + closing
- —
- Monthly P&I
- —
- Monthly cashflow
- —
- DSCR
- —
- Eligible?
- —
Short-term bridge; refi at stabilization.
Rent comps 40 comps
| Address | Beds | Baths | Sqft | Rent | $/sqft | DOM | Units | Dist |
|---|---|---|---|---|---|---|---|---|
| 3819 Henry St Greenville, TX | 3.0 | 2.0 | 1590 | $1,295 | $0.81 | 14d | 1 | 0.24mi |
| 3614 Short St Greenville, TX | 3.0 | 2.0 | 1323 | $1,575 | $1.19 | 0d | 1 | 0.26mi |
| 3614 Short St Greenville, TX | 3.0 | 2.0 | 1323 | $1,600 | $1.21 | 45d | 1 | 0.26mi |
| 2113 Wright St Unit A Greenville, TX | 3.0 | 2.5 | 1436 | $1,800 | $1.25 | 45d | 1 | 0.29mi |
| 2811 Walnut St Greenville, TX | 3.0 | 2.0 | 1368 | $1,595 | $1.17 | 45d | 1 | 0.30mi |
| 3307 Polk St Unit A Greenville, TX | 3.0 | 2.0 | 1288 | $1,550 | $1.20 | 19d | 1 | 0.33mi |
| 2902 Walnut St Greenville, TX | 4.0 | 3.0 | 2189 | $2,050 | $0.94 | 25d | 1 | 0.34mi |
| 3310 Polk St Greenville, TX | 3.0 | 2.0 | 1513 | $1,800 | $1.19 | 25d | 1 | 0.34mi |
| 2406 Beecha St Greenville, TX | 3.0 | 2.0 | 1263 | $1,575 | $1.25 | 45d | 1 | 0.36mi |
| 1901 Wright St Greenville, TX | 3.0 | 2.0 | 1260 | $1,550 | $1.23 | 0d | 1 | 0.37mi |
| 3603 McDougal St Greenville, TX | 5.0 | 2.0 | 1472 | $1,850 | $1.26 | 45d | 1 | 0.40mi |
| 2209 Wellington St Greenville, TX | 3.0 | 2.0 | 1372 | $1,499 | $1.09 | 0d | 1 | 0.40mi |
| 1707 Wright St Greenville, TX | 3.0 | 2.0 | 1400 | $1,725 | $1.23 | 6d | 1 | 0.45mi |
| 3840 McDougal St Greenville, TX | 3.0 | 2.0 | 1458 | $2,000 | $1.37 | 8d | 1 | 0.46mi |
| 3303 Texas St Greenville, TX | 3.0 | 1.0 | 1260 | $1,450 | $1.15 | 4d | 1 | 0.48mi |
| 4203 Pickett St Greenville, TX | 4.0 | 2.5 | 2413 | $2,200 | $0.91 | 45d | 1 | 0.48mi |
| 2210 Langford St Greenville, TX | 4.0 | 2.0 | 1510 | $1,595 | $1.06 | 45d | 1 | 0.48mi |
| 2225 College St Greenville, TX | 4.0 | 2.5 | 1832 | $2,000 | $1.09 | 45d | 1 | 0.51mi |
| 2225 College St Greenville, TX | 3.0 | 2.0 | 1439 | $1,800 | $1.25 | 25d | 1 | 0.51mi |
| 1711 Langford St Greenville, TX | 3.0 | 1.5 | 1274 | $1,495 | $1.17 | 23d | 1 | 0.54mi |
| 1711 Langford St Greenville, TX | 3.0 | 1.5 | 1274 | $1,495 | $1.17 | 25d | 1 | 0.54mi |
| 3110 Saint John St Greenville, TX | 3.0 | 2.0 | 1273 | $1,500 | $1.18 | 45d | 1 | 0.56mi |
| 3110 Saint John St Unit B Greenville, TX | 3.0 | 2.0 | 1273 | $1,400 | $1.10 | 25d | 1 | 0.56mi |
| 3110 Saint John St Unit A Greenville, TX | 3.0 | 2.0 | 1273 | $1,500 | $1.18 | 45d | 1 | 0.56mi |
| 3110 Saint John St Unit B Greenville, TX | 3.0 | 2.0 | 1273 | $1,450 | $1.14 | 45d | 1 | 0.56mi |
| 3110 Saint John St Unit A Greenville, TX | 3.0 | 2.0 | 1273 | $1,425 | $1.12 | 45d | 1 | 0.56mi |
| 3912 Oneal St Greenville, TX | 3.0 | 2.5 | 1592 | $1,750 | $1.10 | 45d | 1 | 0.61mi |
| 1311 Wright St Greenville, TX | 3.0 | 2.5 | 1582 | $1,750 | $1.11 | 45d | 1 | 0.62mi |
| 2704 Jones St Greenville, TX | 3.0 | 2.0 | 1273 | $1,550 | $1.22 | 4d | 1 | 0.66mi |
| 2305 Bourland St Greenville, TX | 3.0 | 2.0 | 1320 | $1,900 | $1.44 | 45d | 1 | 0.68mi |
| 1519 Stonewall St Greenville, TX | 3.0 | 2.0 | 1578 | $1,750 | $1.11 | 23d | 1 | 0.70mi |
| 2212 Church St Unit A Greenville, TX | 3.0 | 2.0 | 1254 | $1,595 | $1.27 | 7d | 1 | 0.73mi |
| 3333 Dalton St Greenville, TX | 3.0 | 2.0 | 1493 | $1,635 | $1.10 | 25d | 1 | 0.73mi |
| 3333 Dalton St Greenville, TX | 3.0 | 2.0 | 1493 | $1,635 | $1.10 | 8d | 1 | 0.73mi |
| 3333 Dalton St Greenville, TX | 3.0 | 2.0 | 1493 | $1,635 | $1.10 | 6d | 1 | 0.73mi |
| 4709 Henry St Greenville, TX | 3.0 | 2.0 | 1299 | $1,550 | $1.19 | 8d | 1 | 0.77mi |
| 2006 Church St Greenville, TX | 3.0 | 2.0 | 1463 | $1,600 | $1.09 | 45d | 1 | 0.81mi |
| 2018 Morse St Greenville, TX | 4.0 | 2.0 | 1894 | $2,200 | $1.16 | 45d | 1 | 0.84mi |
| 2010 Morse St Greenville, TX | 3.0 | 2.0 | 1248 | $1,400 | $1.12 | 23d | 1 | 0.86mi |
| 4811 Henry St Greenville, TX | 3.0 | 2.0 | 1565 | $1,800 | $1.15 | 20d | 1 | 0.88mi |
Listing history 8 events
-
2026-06-21days on market $185,000 Active 13 DOM
-
2026-06-18days on market $185,000 Active 10 DOM
-
2026-06-17days on market $185,000 Active 9 DOM
-
2026-06-16days on market $185,000 Active 8 DOM
-
2026-06-15days on market $185,000 Active 7 DOM
-
2026-06-13days on market $185,000 Active 5 DOM
-
2026-06-08remarks 659-char remark
-
2026-06-08$185,000 Active 1 DOM
ⓘ Source: listings_history table (triggers on properties + properties_extension) + one-shot
backfill from property_details.listing_events for pre-trigger history.
Tax reassessment forecast TX · Resets to sale price
- Current annual tax
- $4,064 · $339/mo
- Projected year-2 tax
- $4,064 · $339/mo
- Expected delta
- $0/yr ($0/mo · 0.0%)
ⓘ Screening estimate from a state-policy table — verify with the county assessor before closing.
Climate risk First Street
- Flood 1/10 Low FEMA zone X (unshaded) · 0% chance over 30 yrs
- Wildfire 5/10 Major
- Heat 7/10 Severe 7 d/yr ≥110°F today · 23 d/yr by 30 yrs out
- Wind 6/10 Major 27% chance of damaging wind over 30 yrs
- Air quality 2/10 Low 1 unhealthy d/yr today · 1 by 30 yrs out
Nearby sold comps map
Loading sold comps map…
Walkable amenities ~0.75 mi
Loading nearby amenities…
Taxation est. · year 1
- Rental income
- $21,029
- − Mortgage interest
- −$10,363
- − Property taxes
- −$4,064
- − Insurance
- −$925
- − Repairs & maintenance
- −$1,682
- − Management
- −$1,682
- − Depreciation
- −$5,382
- Taxable loss
- −$3,069
- Est. tax savings @ 24.0%
- +$737
- After-tax cash flow
- $719/yr
For passive investors: Depreciation is non-cash, so a rental often shows a tax loss while cash-flowing — sheltering income. Rental losses are passive: they offset passive income freely, and up to $25,000/yr can offset ordinary (W-2) income if you actively participate and your MAGI is under $100k (phasing out to $0 by $150k); unused losses carry forward. On sale, claimed depreciation is recaptured at up to 25%, and gains may owe capital-gains tax (a 1031 exchange can defer both). Figures are a year-1 estimate at your 24.0% rate — not tax advice; consult a CPA.
Schools (NCES district)
- District
- Greenville ISD
- NCES district ID
- 4821720
- Math proficiency
- 20% ▼ -12.00%
- Reading proficiency
- 26% ▼ -7.00%
- Median HH income
- $41,374
- Composite
- 19.56/100
- National rank
- #8759
- State rank
- #743 of 826 in TX
Livability — Greenville
- Score
- 77/100
- State rank
- #78
- US rank
- #2719
Category grades
Schools grade is shown separately in the Schools card above.
Census & demographics
- Census place
- Greenville, TX
- County
- Hunt County · 71,969 people
- City population
- 42,767
- Metro
- Dallas-Fort Worth-Arlington, TX
- Population (ZIP)
- 22,669
- Household income
- $59,908
- Rent vs Own
- Severe rent burden
- 638.0
Population outlook (Hunt County) Hauer SSP2
- Today (2025)
- 97,090 people
- By 2030
- 100,452 · +3.5%
- By 2040
- 106,544 · +9.7%
- By 2050
- 111,218 · +14.6%
- By 2075
- 121,695 · +25.3%
- By 2100
- 123,683 · +27.4%
Race, ethnicity, and origin ACS 2023
- Neighborhood character
- Diverse neighborhood (Simpson 0.62)
- Race & ethnicity
- White 51% Hispanic / Latino 32% Black 13% Two or more races 11%
- Hispanic origin (detail)
- Mexican 30%
- Common ancestry
- Slovak 2% Lithuanian 1% Iranian 1%
- Foreign-born
- 13% · Canada
- Languages at home
- 75% English-only · Spanish 24%
Political lean MEDSL · Hunt
- 2024 margin
- Solid R (+55.5) · D 21.9% · R 77.4%
- 2008→2024 swing
- -14.9pp toward R · 2008: -40.6pp · 2024: -55.5pp
- All cycles
- 2024: R+55.5 2020: R+52.5 2016: R+56.3 2012: R+51.2 2008: R+40.6
Not yet ingested
- Civics
- —
Market trends
- HPI YoY
- ▼ -88.45%
- Current HPI
- 339.0287
- Rent YoY
- ▲ 0.62%
- Metro
- Dallas-Fort Worth-Arlington, TX
- State GDP YoY
- ▲ 3.95%
- F500 in state
- 110
Industry mix (Fortune 500 HQ in TX)
| Industry | F500 HQs | Revenue |
|---|---|---|
| Energy | 16 | $1,198B |
|
||
| Technology | 5 | $198B |
|
||
| Engineering / Construction | 4 | $72B |
|
||
| Energy Services | 3 | $60B |
|
||
| Utilities | 3 | $41B |
|
||
| Healthcare | 2 | $330B |
|
||
Price history
-9.8% since first listed6 events — show timeline
- 2026-06-08 Listed $185,000 NTREIS
- 2026-03-02 Listing Removed — NTREIS
- 2025-12-13 Price Changed $199,999 NTREIS
- 2025-11-26 Price Changed $204,900 NTREIS
- 2025-09-30 Listed $205,000 NTREIS
- 2006-12-18 Sold (Public Records) — Public Records
Property tax history
+9.1%/yrLatest (2025): $4,064 · +4.0% YoY. Source: county tax records.
Cash-flow waterfall
monthlySold comps — $/sqft
last 12 mo · ≤1 miLoading sold comps…