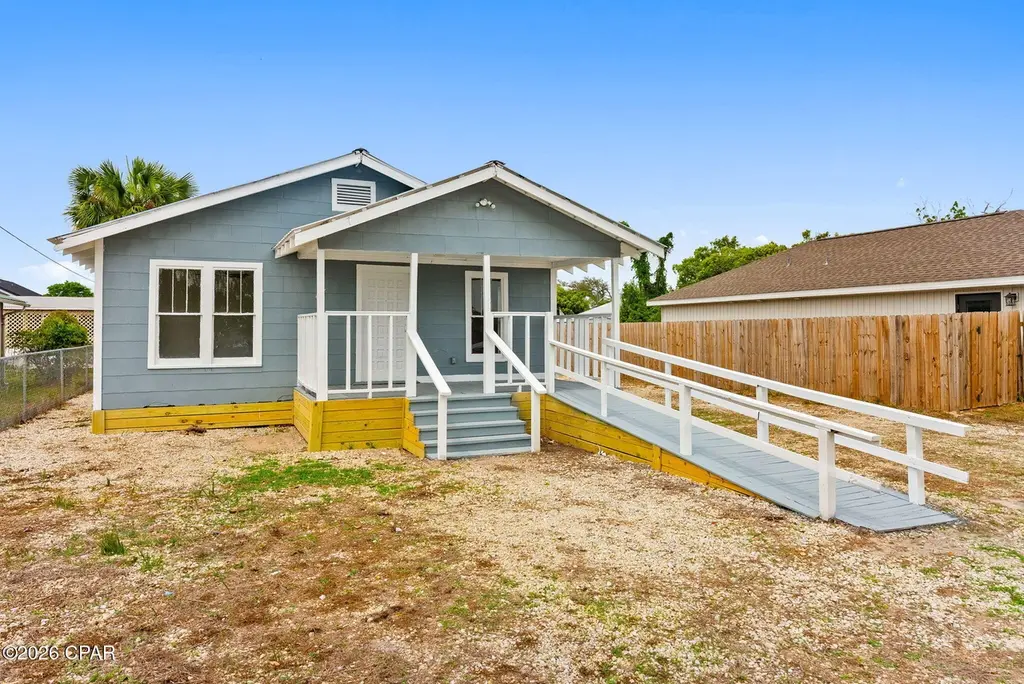
235 Central Ave · Springfield, FL
Flood risk 1/10 · Minimal
- FEMA flood zone
- X (unshaded)
- Chance of flooding over 30 yrs
- 0.0%
- Est. flood insurance / yr
- $507 – $1,088
Fire risk 1/10 · Minimal
- Est. fire insurance / yr
- $947 – $1,759
Heat risk 10/10 · Severe
- Hot days now (above 105°F)
- 7 days/yr
- Hot days in 30 yrs
- 21 days/yr
Wind risk 9/10 · Severe
- Chance of severe wind over 30 yrs
- 99.0%
Air-quality risk 1/10 · Minimal
- Unhealthy air days now
- 0 days/yr
- Unhealthy air days in 30 yrs
- 0 days/yr
Risk factors via First Street. Map © Google.
Why this score? — see what drove the C grade
The composite is a weighted blend of 9 inputs, each scored 0–100. Each bar is that input's sub-score; the figure is the points it added to the 100-point composite (weight × sub-score).
- Cash flow +18.0/30.0
- ARV discount +15.0/15.0
- DSCR +5.6/10.0
- 1% rule +4.3/10.0
- Schools +4.3/10.0
- Livability +3.0/5.0
- Rent growth +2.6/5.0
- Condition / age +2.5/5.0
- Appreciation +0.0/10.0
$149,999
🖨 Deal sheet (PDF) 📄 Offer letter ✓ Due diligence
Listing remarks MLS
Ideally located in the Springfield community of Bay County, this 1,040-square-foot residence offers essential updates and a spacious lot. The home features 3 bedrooms and 1 bathroom, with recent functional improvements including new PEX plumbing and new electrical lines. The interior is finished with fresh paint and new flooring throughout, complemented by a renovated bathroom. The living area is notably spacious at approximately 25' x 13', providing a versatile layout for residents. The exterior includes a covered front porch and sits on a deep 43' x 140' lot, offering plenty of outdoor space. Strategically situated for an easy commute, the home is just minutes from Tyndall Air Force Base, regional healthcare facilities, and the diverse shopping and dining options of Panama City. Additionally, the world-famous white sand beaches of Panama City Beach are only a short drive away. This turn-key property represents a practical opportunity for those seeking a refreshed home in a high-demand, centrally located market. For those interested in investment opportunities, this property is located in an area that allows for short-term rentals, providing added flexibility for use.
Key facts
- Covered front porch
- New pex plumbing
- Renovated bathroom
Tags
Neighborhood map
What this means for you Summary
Snapshot
- This is a 2-bed/1.0-bath single-family listed at $150k.
Deal economics
- At list price, monthly cash flow is $129 ($2k/yr) — positive.
- The deal already cash-flows at list — no discount required.
- To meet the 1% rule (rent ≥ 1% of price), the offer needs to be $140k (6.8% below list).
- Recommended offer: $140k (6.8% below list) — sets the bar for 1% rule.
- Cap rate 7.3% vs local median 4.8% in Springfield — top-decile yield for the area; either an underpriced asset or a hidden risk that comps aren't pricing in. Stress-test before assuming the spread holds.
Location & tenants
- Location reads 59/100 on livability (#826 in FL) — a working-class tenant base; expect higher turnover. Strengths: cost of living A+, housing A+, health & safety A+; Watch: employment D, crime F, amenities F.
- Bay (suburban): math 51% / reading 51% proficiency, ranked #29 of 73 in FL (top 40%) — acceptable for families but not a draw, mixed tenant base, ~2y average lease.
- Zoned schools: Rutherford High School (math 24% / reading 29%, grade F, #489 of 667 statewide, top 74%, 1,337 students, 63% FRL).
- Zoned-school proficiency averages 26% at this address vs 51% district-wide (-24 pts) — the specific schools serving this property underperform the Bay average; the district grade overstates school quality for this exact location.
- Market conditions: Rents flat; 262 active listings in the ZIP; 13 comparable units currently listed for rent nearby; rentals at typical pace (median 23d on market — plan ~3-4 weeks tenant-placement turnaround); 2,473 units permitted in Bay County in 2024 (559 in 5+ unit buildings).
Forward outlook
- Local home prices are declining (-3.0%/yr); year-one equity from $1k of loan paydown is wiped out by about $4k of value loss. Plan a longer hold.
- Bay County population projected at +24% by 2050 — long-run rental-demand tailwind backs the buy-and-hold thesis.
Negotiation context
- It's been on market 73 days — a 6% lower offer ($141k) is reasonable based on typical stale-listing flexibility.
- 3 sale attempts since 2y ago; this cycle's ask has dropped $19k (11%) from the opening price — seller is motivated, your offer sets the floor, not the list.
- Current owner paid $100k; 50% above their basis — modest negotiation headroom, anchor on the comps not their cost.
Risks & watch-outs
- Watch-outs: built in 1950 — expect roof / HVAC / electrical / plumbing capex.
- Climate carrying-cost: severe wind risk, 99% chance of damaging wind over 30y; extreme-heat days projected 7→21/yr by 2055 (HVAC capex compounding) — expect insurance premiums to compound above CPI over the hold.
Questions for the listing agent
- It's been on market 73 days. Have you received any prior offers? Is the seller open to a 7% concession, seller financing, or rate buy-down credit?
- Built in 1950 — when were the roof, HVAC, electrical panel, plumbing, and water heater last replaced?
- Why hasn't it sold? Are there any deal-killer items the seller is aware of (foundation, flood, title, zoning, code violations)?
- Is there a deadline driving the sale (1031 exchange, divorce, estate, relocation)? That informs how much negotiation room exists.
- Schools are D-rated, which usually means shorter tenancies and higher turnover. Who's the typical renter profile here, and what's been the actual vacancy rate?
- Crime grade is F in this area — have there been break-ins, vandalism, or insurance claims at this property in the last 3 years? What carrier currently insures it and at what premium?
- What's the average days-on-market for RENTAL listings here right now (not sales)? A rising rental-DOM trend means longer vacancies and softer asking-rent achievability than the comps imply.
- What's the recent tenant-quality profile in this submarket — average credit score on applications, eviction rate, late-payment / NSF rate, and stable-employment percentage? A property-management company in the area should have these aggregated.
- How much new for-sale + rental construction is in the pipeline within 1–3 miles? Heavy new supply typically softens prices + rents 12–24 months out; constrained supply supports both.
Investment metrics
- 1% rule
- 0.93% ✗
- Cap rate
- 7.32%
- Cash-on-cash
- 3.68%
- DSCR
- 1.16
- GRM
- 8.9
CMA / ARV
- ARV (median comp)
- $215,109
- List price
- $149,999
- Delta
- -30.27%
- Verdict
- UNDERPRICED
- Comps
- 20 within 1.0 mi
Show comp detail 12 sales within ~0.75 mi
| Address | Dist | Beds/Ba | Sqft | Sold | Price | $/sf | Match |
|---|---|---|---|---|---|---|---|
| 2810 E 2 Nd Ct | 0.37mi | 2/1.0 | 946 (-9%) | 3mo | $38,000 | $40 | 65 |
| 111 Bayou Ave | 0.68mi | 3/1.0 (+1) | 1,008 (-3%) | 0mo | $220,000 | $218 | 58 |
| 3108 E 2nd St | 0.21mi | 3/2.0 (+1) | 1,176 (+13%) | 6mo | $225,900 | $192 | 54 |
| 2717 E 6th Ct | 0.62mi | 3/2.0 (+1) | 984 (-5%) | 0mo | $95,000 | $97 | 53 |
| 138 Springfield Ave | 0.24mi | 3/2.0 (+1) | 908 (-13%) | 8mo | $103,000 | $113 | 52 |
| 2704 E 1st Ct | 0.52mi | 3/2.0 (+1) | 1,000 (-4%) | 11mo | $225,000 | $225 | 52 |
| 508 N James Ave | 0.52mi | 3/1.0 (+1) | 1,146 (+10%) | 8mo | $187,000 | $163 | 47 |
| 2603 E 6th St | 0.68mi | 3/2.0 (+1) | 1,125 (+8%) | 2mo | $239,900 | $213 | 44 |
| 2601 E 6th St | 0.68mi | 3/2.0 (+1) | 1,125 (+8%) | 2mo | $229,900 | $204 | 44 |
| 325 N Gray Ave | 0.52mi | 3/1.5 (+1) | 1,140 (+10%) | 12mo | $170,000 | $149 | 43 |
| 513 N Church Ave | 0.69mi | 3/2.0 (+1) | 1,142 (+10%) | 6mo | $230,000 | $201 | 37 |
| 525 Kraft Ave | 0.52mi | 3/2.0 (+1) | 1,183 (+14%) | 12mo | $250,000 | $211 | 34 |
Match score weights: distance 35% · size 25% · config 20% · recency 20%. Top-matched comps best support the ARV.
Projected returns pro-forma
-3.0% appreciation · 0.45% rent growth · sell at horizon
- IRR
- -13.3%
- Equity multiple
- 0.53×
- Total profit
- $-19,618
- Equity at exit
- $22,365
- IRR
- -8.7%
- Equity multiple
- 0.52×
- Total profit
- $-20,227
- Equity at exit
- $12,969
Cash invested: $42,000 (down + closing). Projections, not guarantees.
Landlord ↔ Tenant lean methodology
- Overall (STATE)
- 87 Strongly Landlord-Friendly
- State Florida
- 87 Strongly Landlord-Friendly · R+3
- County
- — inherits STATE
- City
- — inherits STATE
ZIP-level market 32401
- Home prices YoY
- -32.9%
- Rents YoY
- 0.5%
- Active inventory
- 262
- Price-to-rent
- 8.9×
Monthly cashflow live
- Estimated rent
- $1,398 high interval (Pro) →
- Mortgage (P&I)
- −$787
- Tax from tax record
- −$127 /mo · $1,520/yr
- Insurance
- −$62
- HOA
- −$0
- Vacancy / Maint / Mgmt
- −$294
- Net cashflow
- $129
Break-even live
Sensitivity live
| Price | -10% $214 | -5% $171 | +0% $129 | +5% $86 | +10% $44 |
|---|---|---|---|---|---|
| Rent | -10% $18 | -5% $74 | +0% $129 | +5% $184 | +10% $239 |
| Rate | -1.0pp $204 | -0.5pp $167 | base $129 | +0.5pp $90 | +1.0pp $50 |
UW: 25.0% down · 7.5% · 30yr · 1.5% tax · 5.0% vac · 8.0% maint · 8.0% mgmt
Financing live
Cash to close
- Down payment
- $37,500
- Closing costs
- $4,500
- Reserves months
- —
- Total cash needed
- —
Loan-product check · same deal, 3 products live
Conventional
25% down · 7.5% · 30yr
- Down + closing
- —
- Monthly P&I
- —
- Monthly cashflow
- —
- DSCR
- —
- Eligible?
- —
Personal DTI + credit; lowest rate.
DSCR
20% down · 8.5% · 30yr
- Down + closing
- —
- Monthly P&I
- —
- Monthly cashflow
- —
- DSCR
- —
- Eligible?
- —
No personal income docs; deal must DSCR.
Hard money
10% down · 12.0% · 12mo
- Down + closing
- —
- Monthly P&I
- —
- Monthly cashflow
- —
- DSCR
- —
- Eligible?
- —
Short-term bridge; refi at stabilization.
Rent comps 13 comps
| Address | Beds | Baths | Sqft | Rent | $/sqft | DOM | Units | Dist |
|---|---|---|---|---|---|---|---|---|
| 237 Helen Ave Panama City, FL | 2.0 | 2.0 | 1000 | $1,395 | $1.40 | 22d | 1 | 0.26mi |
| 3719 E 8th Ct Panama City, FL | 1.0–4.0 | 1.0–1.5 | 950 | $1,100 | $1.16 | 22d | 1 | 1.00mi |
| 4905 Alameda St Unit 1 Panama City, FL | 3.0 | 2.0 | 942 | $1,295 | $1.37 | 22d | 1 | 1.06mi |
| 149 North Highway 22 A Unit 5 Panama City, FL | 2.0 | 1.0 | 900 | $1,140 | $1.27 | 15d | 1 | 1.11mi |
| 208 North Highway 22 A Unit 33 Panama City, FL | 3.0 | 2.0 | 1080 | $1,350 | $1.25 | 22d | 1 | 1.19mi |
| 725 Sherman Ave Unit B Panama City, FL | 3.0 | 1.0 | 878 | $1,250 | $1.42 | 22d | 1 | 1.19mi |
| 5101 Willow St Panama City, FL | 3.0 | 2.0 | 1099 | $1,500 | $1.36 | 15d | 1 | 1.20mi |
| 4837 S Lakewood Dr Panama City, FL | 2.0 | 1.5 | 1116 | $1,500 | $1.34 | 22d | 1 | 1.28mi |
| 3914 E 11th St #301 Panama City, FL | 2.0 | 2.0 | 864 | $1,000 | $1.16 | 22d | 1 | 1.30mi |
| 129 Seneca Ave Panama City, FL | 3.0 | 2.0 | 1449 | $1,495 | $1.03 | 15d | 1 | 1.39mi |
| 4828 Grimes St #3 Panama City, FL | 2.0 | 1.0 | 850 | $1,150 | $1.35 | 22d | 1 | 1.42mi |
| 543 N 9th St Unit 543 Panama City, FL | 2.0 | 1.0 | 850 | $1,195 | $1.41 | 15d | 1 | 1.43mi |
| 906 Kevin Ct Panama City, FL | 3.0 | 2.0 | 1266 | $1,795 | $1.42 | 22d | 1 | 1.44mi |
Listing history 30 events
-
2026-06-21days on market $149,999 Active 73 DOM
-
2026-06-19days on market $149,999 Active 71 DOM
-
2026-06-18days on market $149,999 Active 70 DOM
-
2026-06-17days on market $149,999 Active 69 DOM
-
2026-06-16days on market $149,999 Active 68 DOM
-
2026-06-15days on market $149,999 Active 67 DOM
-
2026-06-14days on market $149,999 Active 65 DOM
-
2026-06-13days on market $149,999 Active 64 DOM
-
2026-06-10days on market $149,999 Active 62 DOM
-
2026-06-09days on market $149,999 Active 61 DOM
-
2026-06-09price $149,999 Active 60 DOM
-
2026-06-08days on market $169,000 Active 60 DOM
-
2026-06-07days on market $169,000 Active 59 DOM
-
2026-06-05days on market $169,000 Active 56 DOM
-
2026-06-03days on market $169,000 Active 55 DOM
-
2026-06-02days on market $169,000 Active 54 DOM
-
2026-06-01days on market $169,000 Active 53 DOM
-
2026-05-31days on market $169,000 Active 52 DOM
-
2026-05-30days on market $169,000 Active 51 DOM
-
2026-04-08$169,000 Active 1187-char remark
Show marketing remark (1187 chars)
Ideally located in the Springfield community of Bay County, this 1,040-square-foot residence offers essential updates and a spacious lot. The home features 3 bedrooms and 1 bathroom, with recent functional improvements including new PEX plumbing and new electrical lines. The interior is finished with fresh paint and new flooring throughout, complemented by a renovated bathroom. The living area is notably spacious at approximately 25' x 13', providing a versatile layout for residents. The exterior includes a covered front porch and sits on a deep 43' x 140' lot, offering plenty of outdoor space. Strategically situated for an easy commute, the home is just minutes from Tyndall Air Force Base, regional healthcare facilities, and the diverse shopping and dining options of Panama City. Additionally, the world-famous white sand beaches of Panama City Beach are only a short drive away. This turn-key property represents a practical opportunity for those seeking a refreshed home in a high-demand, centrally located market. For those interested in investment opportunities, this property is located in an area that allows for short-term rentals, providing added flexibility for use.
-
2025-09-11price $164,900
-
2025-06-25price $168,900
-
2025-06-25price $169
-
2025-06-25price $169,000
-
2025-06-19$169 Active
-
2024-03-11soldstatus $100,000
-
2024-03-08soldstatus $100,000 Closed
-
2024-02-27status Pending
-
2024-02-23$110,000 Active
-
2010-10-21soldstatus $27,500
ⓘ Source: listings_history table (triggers on properties + properties_extension) + one-shot
backfill from property_details.listing_events for pre-trigger history.
Tax reassessment forecast FL · Resets to sale price
- Current annual tax
- $1,520 · $127/mo
- Projected year-2 tax
- $1,520 · $127/mo
- Expected delta
- $0/yr ($0/mo · 0.0%)
ⓘ Screening estimate from a state-policy table — verify with the county assessor before closing.
Climate risk First Street
- Flood 1/10 Low FEMA zone X (unshaded) · 0% chance over 30 yrs
- Wildfire 1/10 Low
- Heat 10/10 Extreme 7 d/yr ≥105°F today · 21 d/yr by 30 yrs out
- Wind 9/10 Extreme 99% chance of damaging wind over 30 yrs
- Air quality 1/10 Low 0 unhealthy d/yr today · 0 by 30 yrs out
Nearby sold comps map
Loading sold comps map…
Walkable amenities ~0.75 mi
Loading nearby amenities…
Taxation est. · year 1
- Rental income
- $16,778
- − Mortgage interest
- −$8,402
- − Property taxes
- −$1,520
- − Insurance
- −$750
- − Repairs & maintenance
- −$1,342
- − Management
- −$1,342
- − Depreciation
- −$4,364
- Taxable loss
- −$942
- Est. tax savings @ 24.0%
- +$226
- After-tax cash flow
- $1,772/yr
For passive investors: Depreciation is non-cash, so a rental often shows a tax loss while cash-flowing — sheltering income. Rental losses are passive: they offset passive income freely, and up to $25,000/yr can offset ordinary (W-2) income if you actively participate and your MAGI is under $100k (phasing out to $0 by $150k); unused losses carry forward. On sale, claimed depreciation is recaptured at up to 25%, and gains may owe capital-gains tax (a 1031 exchange can defer both). Figures are a year-1 estimate at your 24.0% rate — not tax advice; consult a CPA.
Schools (NCES district)
- District
- Bay
- NCES district ID
- 1200090
- Math proficiency
- 51% ▼ -8.00%
- Reading proficiency
- 51% ▼ -7.00%
- Median HH income
- $47,740
- Composite
- 43.41/100
- National rank
- #3014
- State rank
- #29 of 73 in FL
Livability — Springfield
- Score
- 59/100
- State rank
- #826
- US rank
- #20265
Category grades
Schools grade is shown separately in the Schools card above.
Census & demographics
- Census place
- Springfield, FL
- County
- Bay County · 163,593 people
- Metro
- Panama City, FL
- Population (ZIP)
- 18,947
- Household income
- $52,523
- Rent vs Own
- Severe rent burden
- 935.0
Population outlook (Bay County) Hauer SSP2
- Today (2025)
- 206,264 people
- By 2030
- 217,740 · +5.6%
- By 2040
- 238,738 · +15.7%
- By 2050
- 255,545 · +23.9%
- By 2075
- 288,295 · +39.8%
- By 2100
- 288,638 · +39.9%
Race, ethnicity, and origin ACS 2023
- Neighborhood character
- Diverse neighborhood (Simpson 0.57)
- Race & ethnicity
- White 60% Black 23% Hispanic / Latino 11% Two or more races 8% Asian 2%
- Hispanic origin (detail)
- Mexican 5% Puerto Rican 2%
- Common ancestry
- Italian 2% Lithuanian 2% Slovak 2%
- Foreign-born
- 9% · Canada, Vietnam
- Languages at home
- 89% English-only · Spanish 8% Other Indo-European 1% German/W. Germanic 1%
Political lean MEDSL · Bay
- 2024 margin
- Solid R (+47.4) · D 25.8% · R 73.1% · Other 1.1%
- 2008→2024 swing
- -6.6pp toward R · 2008: -40.7pp · 2024: -47.4pp
- All cycles
- 2024: R+47.4 2020: R+43.5 2016: R+46.3 2012: R+43.6 2008: R+40.7
Not yet ingested
- Civics
- —
Market trends
- HPI YoY
- ▼ -142.12%
- Current HPI
- 290.3312
- Rent YoY
- ▲ 0.45%
- Metro
- Panama City, FL
- State GDP YoY
- ▲ 3.28%
- F500 in state
- 36
Industry mix (Fortune 500 HQ in FL)
| Industry | F500 HQs | Revenue |
|---|---|---|
| Industrial Technology | 2 | $29B |
|
||
| Insurance | 2 | $17B |
|
||
| Retail | 1 | $60B |
|
||
| Technology Distribution | 1 | $58B |
|
||
| Homebuilding | 1 | $35B |
|
||
| Technology Manufacturing | 1 | $35B |
|
||
Price history
+514.5% since first listed11 events — show timeline
- 2026-04-08 Listed $169,000 CPARMLS
- 2025-09-11 Price Changed $164,900 CPARMLS
- 2025-06-25 Price Changed $168,900 CPARMLS
- 2025-06-25 Price Changed $169 CPARMLS
- 2025-06-25 Price Changed $169,000 CPARMLS
- 2025-06-19 Listed $169 CPARMLS
- 2024-03-11 Sold (Public Records) $100,000 Public Records
- 2024-03-08 Sold (MLS) $100,000 CPARMLS
- 2024-02-27 Pending — CPARMLS
- 2024-02-23 Listed $110,000 CPARMLS
- 2010-10-21 Sold (Public Records) $27,500 Public Records
Property tax history
+9.6%/yrLatest (2025): $1,520 · +197.9% YoY. Source: county tax records.
Cash-flow waterfall
monthlySold comps — $/sqft
last 12 mo · ≤1 miLoading sold comps…