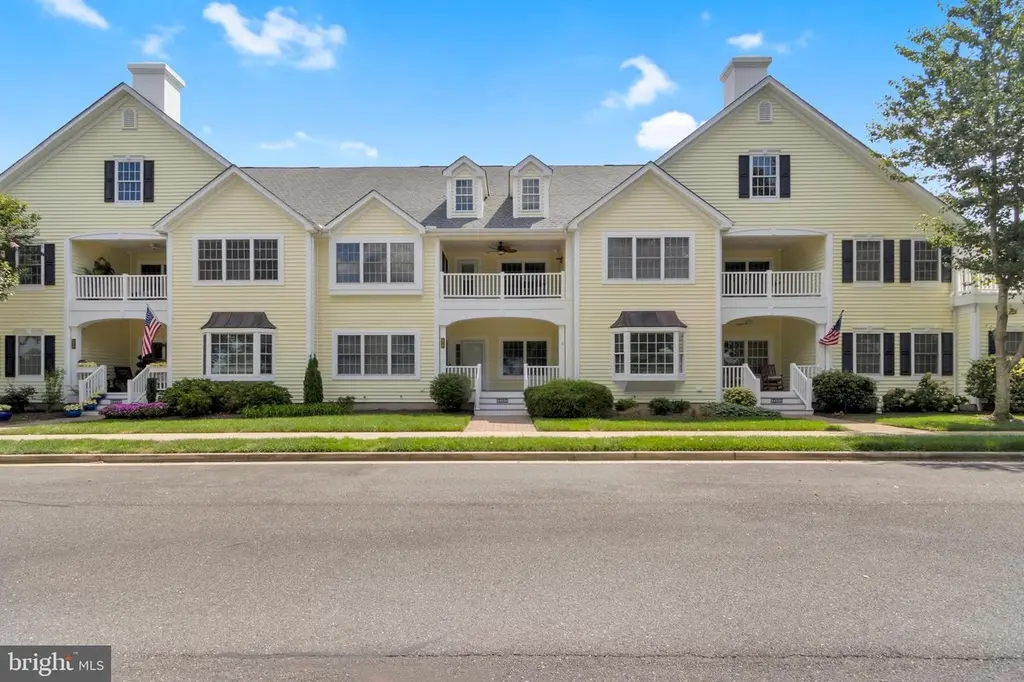
24934 Pot Bunker #3716 · Long Neck, DE
Flood risk 1/10 · Minimal
- FEMA flood zone
- X (unshaded)
- Chance of flooding over 30 yrs
- 0.0%
- Est. flood insurance / yr
- $473 – $860
Fire risk 1/10 · Minimal
- Est. fire insurance / yr
- $476 – $884
Heat risk 8/10 · Major
- Hot days now (above 101°F)
- 7 days/yr
- Hot days in 30 yrs
- 18 days/yr
Wind risk 8/10 · Major
- Chance of severe wind over 30 yrs
- 80.0%
Air-quality risk 2/10 · Minimal
- Unhealthy air days now
- 1 days/yr
- Unhealthy air days in 30 yrs
- 1 days/yr
Risk factors via First Street. Map © Google.
Why this score? — see what drove the C- grade
The composite is a weighted blend of 9 inputs, each scored 0–100. Each bar is that input's sub-score; the figure is the points it added to the 100-point composite (weight × sub-score).
- Cash flow +15.2/30.0
- ARV discount +15.0/15.0
- 1% rule +5.7/10.0
- DSCR +4.6/10.0
- Condition / age +3.8/5.0
- Livability +3.5/5.0
- Schools +2.9/10.0
- Rent growth +2.5/5.0
- Appreciation +0.0/10.0
$265,000
🖨 Deal sheet 📄 Offer letter ✓ Due diligence
Listing remarks
🏡 Looking for an elegant and inviting home in the sought-after community of Baywood? This 3BR, 2.5BA, beauty offers the perfect mix of comfort, style, and resort-inspired living—ideal for year-round residents or weekend retreat seekers! ✨ The main level features tile flooring, a flexible den/office with half bath, and a double-sided fireplace that warms both the living and dining rooms—perfect for cozy nights in or entertaining guests. 🍳 The beautiful eat-in kitchen offers plenty of counter space and cabinetry, while the formal dining room provides a lovely setting for special occasions (or can double as a quiet reading nook). You’ll love the ample storage throughout, incl
Key facts
- $321 HOA
- 2 garage spots
- Community pool
Neighborhood map
What this means for you Summary
Snapshot
- This is a 3-bed/2.5-bath townhouse listed at $265k. Condition is rated good.
Deal economics
- At list price, monthly cash flow is $90 ($1k/yr) — positive.
- The deal already cash-flows at list — no discount required.
- Meets the 1% rule at list price ($3k rent vs $265k).
- Recommended offer: $233k (12.0% below list) — sets the bar for market timing.
- Cap rate 6.7% vs local median 3.2% in Long Neck — top-decile yield for the area; either an underpriced asset or a hidden risk that comps aren't pricing in. Stress-test before assuming the spread holds.
Location & tenants
- Location reads 69/100 on livability (#30 in DE) — a middle-class / working-renter tenant base. Strengths: cost of living A+, housing A+, crime A-; Watch: employment D+, schools F, amenities F.
- Indian River School District (rural): math 25% / reading 41% proficiency, ranked #14 of 26 in DE (top 54%) — families likely to look elsewhere, expect single-tenant / working-renter base with shorter leases.
- Market conditions: 865 active listings in the ZIP; 4 comparable units currently listed for rent nearby; rentals lingering (median 44d on market — plan ~5-8 weeks vacancy on turnover, expect pricing pressure); 75% of comp listings sitting > 30 days — soft ceiling on asking rent; solid renter incomes; 4,354 units permitted in Sussex County in 2024 (344 in 5+ unit buildings).
- This rent runs 44% of the median local income ($78k/yr) — at the standard rent-burdened threshold; future hikes will face affordability resistance.
Forward outlook
- Local home prices are declining (-3.0%/yr); year-one equity from $2k of loan paydown is wiped out by about $8k of value loss. Plan a longer hold.
- Sussex County population projected at +25% by 2050 — long-run rental-demand tailwind backs the buy-and-hold thesis.
Negotiation context
- It's been on market 296 days — a 12% lower offer ($233k) is reasonable based on typical stale-listing flexibility.
- 3 sale attempts since 5y ago; this cycle's ask has dropped $29k (10%) from the opening price — seller is motivated, your offer sets the floor, not the list.
Risks & watch-outs
- Climate carrying-cost: severe wind risk, 80% chance of damaging wind over 30y; extreme-heat days projected 7→18/yr by 2055 (HVAC capex compounding) — expect insurance premiums to compound above CPI over the hold.
Questions for the listing agent
- It's been on market 296 days. Have you received any prior offers? Is the seller open to a 12% concession, seller financing, or rate buy-down credit?
- What does the HOA fee cover, when was the last increase, and are there any pending special assessments or reserve-fund shortfalls?
- Why hasn't it sold? Are there any deal-killer items the seller is aware of (foundation, flood, title, zoning, code violations)?
- Is there a deadline driving the sale (1031 exchange, divorce, estate, relocation)? That informs how much negotiation room exists.
- Schools are F-rated, which usually means shorter tenancies and higher turnover. Who's the typical renter profile here, and what's been the actual vacancy rate?
- What's the average days-on-market for RENTAL listings here right now (not sales)? A rising rental-DOM trend means longer vacancies and softer asking-rent achievability than the comps imply.
- What's the recent tenant-quality profile in this submarket — average credit score on applications, eviction rate, late-payment / NSF rate, and stable-employment percentage? A property-management company in the area should have these aggregated.
- How much new for-sale + rental construction is in the pipeline within 1–3 miles? Heavy new supply typically softens prices + rents 12–24 months out; constrained supply supports both.
Investment metrics
- 1% rule
- 1.07% ✓
- Cap rate
- 6.70%
- Cash-on-cash
- 1.46%
- DSCR
- 1.06
- GRM
- 7.8
CMA / ARV
- ARV (median comp)
- $367,409
- List price
- $265,000
- Delta
- -27.87%
- Verdict
- UNDERPRICED
- Comps
- 20 within 1.0 mi
Show comp detail 7 sales within ~0.75 mi
| Address | Dist | Beds/Ba | Sqft | Sold | Price | $/sf | Match |
|---|---|---|---|---|---|---|---|
| 32447 Back Nine Way #3765 | 0.11mi | 4/2.5 (+1) | 2,468 (+4%) | 5mo | $260,000 | $105 | 78 |
| 24954 Pot Bunker Way #3711 | 0.04mi | 3/2.5 | 2,465 (+4%) | 24mo | $340,000 | $138 | 72 |
| 24960 Pot Bunker | 0.05mi | 4/— (+1) | 2,700 (+14%) | 0mo | $335,000 | $124 | 69 |
| 32427 Back Nine Way #3759 | 0.09mi | 3/3.5 | 2,700 (+14%) | 16mo | $430,000 | $159 | 55 |
| 32346 Apron Way #3719 | 0.03mi | 3/3.5 | 2,700 (+14%) | 22mo | $385,000 | $143 | 52 |
| 24950 Pot Bunker #3712 | 0.03mi | 4/3.5 (+1) | 2,700 (+14%) | 19mo | $420,000 | $156 | 50 |
| 25006 Pot Bunker Way #3702 | 0.14mi | 4/3.5 (+1) | 2,700 (+14%) | 14mo | $480,000 | $178 | 49 |
Match score weights: distance 35% · size 25% · config 20% · recency 20%. Top-matched comps best support the ARV.
Projected returns pro-forma
-3.0% appreciation · 3.0% rent growth · sell at horizon
- IRR
- -13.9%
- Equity multiple
- 0.50×
- Total profit
- $-36,961
- Equity at exit
- $39,512
- IRR
- -4.9%
- Equity multiple
- 0.68×
- Total profit
- $-23,819
- Equity at exit
- $22,912
Cash invested: $74,200 (down + closing). Projections, not guarantees.
Landlord ↔ Tenant lean methodology
- Overall (STATE)
- 70 Landlord-Friendly
- State Delaware
- 70 Landlord-Friendly · D+7
- County
- — inherits STATE
- City
- — inherits STATE
ZIP-level market 19966
- Home prices YoY
- -6.4%
- Active inventory
- 865
- Price-to-rent
- 7.8×
Monthly cashflow live
- Estimated rent
- $2,839 medium interval (Pro) →
- Mortgage (P&I)
- −$1,390
- Tax est. 1.5%
- −$331 /mo · $3,975/yr
- Insurance
- −$110
- HOA
- −$321
- Vacancy / Maint / Mgmt
- −$596
- Net cashflow
- $90
Break-even live
UW: 25.0% down · 7.5% · 30yr · 1.5% tax · 5.0% vac · 8.0% maint · 8.0% mgmt
Financing live
Cash to close
- Down payment
- $66,250
- Closing costs
- $7,950
- Reserves months
- —
- Total cash needed
- —
Loan-product check · same deal, 3 products live
Conventional
25% down · 7.5% · 30yr
- Down + closing
- —
- Monthly P&I
- —
- Monthly cashflow
- —
- DSCR
- —
- Eligible?
- —
Personal DTI + credit; lowest rate.
DSCR
20% down · 8.5% · 30yr
- Down + closing
- —
- Monthly P&I
- —
- Monthly cashflow
- —
- DSCR
- —
- Eligible?
- —
No personal income docs; deal must DSCR.
Hard money
10% down · 12.0% · 12mo
- Down + closing
- —
- Monthly P&I
- —
- Monthly cashflow
- —
- DSCR
- —
- Eligible?
- —
Short-term bridge; refi at stabilization.
Rent comps 4 comps
| Address | Beds | Baths | Sqft | Rent | $/sqft | DOM | Units | Dist |
|---|---|---|---|---|---|---|---|---|
| 32814 Greens Way #3160 Millsboro, DE | 4.0 | 3.5 | 3300 | $3,200 | $0.97 | 43d | 1 | 0.36mi |
| 24850 Rivers Edge Rd Millsboro, DE | 3.0 | 2.5 | 2069 | $2,300 | $1.11 | 43d | 1 | 1.08mi |
| 24201 Hammerhead Dr Millsboro, DE | 3.0 | 3.0 | 1751 | $3,200 | $1.83 | 13d | 1 | 1.36mi |
| 24209 Hammerhead Dr Millsboro, DE | 2.0 | 2.0 | 1751 | $2,350 | $1.34 | 43d | 1 | 1.37mi |
HOA detail
- Monthly dues
- $321 · $3,852/yr
Listing history 25 events
-
2026-06-18days on market $265,000 Active 296 DOM
-
2026-06-17days on market $265,000 Active 295 DOM
-
2026-06-16days on market $265,000 Active 294 DOM
-
2026-06-15days on market $265,000 Active 293 DOM
-
2026-06-14days on market $265,000 Active 291 DOM
-
2026-06-13days on market $265,000 Active 290 DOM
-
2026-06-10days on market $265,000 Active 288 DOM
-
2026-06-09days on market $265,000 Active 287 DOM
-
2026-06-08days on market $265,000 Active 286 DOM
-
2026-06-07days on market $265,000 Active 285 DOM
-
2026-06-02days on market $265,000 Active 280 DOM
-
2026-06-01days on market $265,000 Active 279 DOM
-
2026-05-31days on market $265,000 Active 278 DOM
-
2026-05-30days on market $265,000 Active 277 DOM
-
2026-03-23price $265,000
-
2025-10-14price $280,000
-
2025-08-27$294,000 Active
-
2025-08-04historical $294,000
-
2025-07-31historical
-
2025-06-12price $310,000
-
2025-05-16price $315,000
-
2025-02-25$320,000 Active
-
2022-03-18soldstatus $295,000 Closed
-
2022-01-04status Pending
-
2021-07-01$310,000 Active
ⓘ Source: listings_history table (triggers on properties + properties_extension) + one-shot
backfill from property_details.listing_events for pre-trigger history.
Climate risk First Street
- Flood 1/10 Low FEMA zone X (unshaded) · 0% chance over 30 yrs
- Wildfire 1/10 Low
- Heat 8/10 Severe 7 d/yr ≥101°F today · 18 d/yr by 30 yrs out
- Wind 8/10 Severe 80% chance of damaging wind over 30 yrs
- Air quality 2/10 Low 1 unhealthy d/yr today · 1 by 30 yrs out
Nearby sold comps map
Loading sold comps map…
Walkable amenities ~0.75 mi
Loading nearby amenities…
Taxation est. · year 1
- Rental income
- $34,063
- − Mortgage interest
- −$14,844
- − Property taxes
- −$3,975
- − Insurance
- −$1,325
- − Repairs & maintenance
- −$2,725
- − Management
- −$2,725
- − HOA
- −$3,852
- − Depreciation
- −$7,709
- Taxable loss
- −$3,092
- Est. tax savings @ 24.0%
- +$742
- After-tax cash flow
- $1,824/yr
For passive investors: Depreciation is non-cash, so a rental often shows a tax loss while cash-flowing — sheltering income. Rental losses are passive: they offset passive income freely, and up to $25,000/yr can offset ordinary (W-2) income if you actively participate and your MAGI is under $100k (phasing out to $0 by $150k); unused losses carry forward. On sale, claimed depreciation is recaptured at up to 25%, and gains may owe capital-gains tax (a 1031 exchange can defer both). Figures are a year-1 estimate at your 24.0% rate — not tax advice; consult a CPA.
Condition & rehab AI · 13 photos
This townhouse is in good condition with a good exterior and interior. It has a good curb appeal and is ready for minor cosmetic updates to enhance its resale and rental value.
Value-add opportunities
- Resale Paint the exterior siding — Painting the exterior siding can enhance the home's curb appeal and make it more attractive to potential buyers.
- Rental Replace the flooring — Replacing the flooring can improve the home's rental value by providing a more comfortable and attractive living space for tenants.
Renovation cost estimate screening
Value-add ROI direction
- Resale Paint the exterior siding — Painting the exterior siding can enhance the home's curb appeal and make it more attractive to potential buyers. ↑
- Rental Replace the flooring — Replacing the flooring can improve the home's rental value by providing a more comfortable and attractive living space for tenants. ↑
ⓘ Cost ranges are severity-bucket heuristics (US national rule-of-thumb). Get contractor quotes + a written scope before underwriting a rehab budget.
Schools (NCES district)
- District
- Indian River School District
- NCES district ID
- 1000680
- Math proficiency
- 25% ▼ -27.00%
- Reading proficiency
- 41% ▼ -17.00%
- Median HH income
- $53,838
- Composite
- 28.99/100
- National rank
- #6620
- State rank
- #14 of 26 in DE
Livability — Long Neck
- Score
- 69/100
- State rank
- #30
- US rank
- #8720
Category grades
Schools grade is shown separately in the Schools card above.
Census & demographics
- County
- Sussex County · 82,708 people
- Metro
- Salisbury, MD-DE
- Population (ZIP)
- 35,884
- Household income
- $78,305
- Rent vs Own
- Severe rent burden
- 464.0
Population outlook (Sussex County) Hauer SSP2
- Today (2025)
- 248,853 people
- By 2030
- 264,464 · +6.3%
- By 2040
- 290,980 · +16.9%
- By 2050
- 311,259 · +25.1%
- By 2075
- 352,488 · +41.6%
- By 2100
- 367,406 · +47.6%
Race, ethnicity, and origin ACS 2023
- Neighborhood character
- Predominantly White (74%)
- Race & ethnicity
- White 74% Hispanic / Latino 11% Black 8% Two or more races 7% Native American 3% Asian 1%
- Hispanic origin (detail)
- Mexican 3%
- Common ancestry
- Romanian 4% Slovak 2% Serbian 1%
- Foreign-born
- 8% · Canada, China
- Languages at home
- 88% English-only · Spanish 9% Other Indo-European 1%
Political lean MEDSL · Sussex
- 2024 margin
- R (+11.0) · D 43.9% · R 54.9% · Other 1.2%
- 2008→2024 swing
- -2.4pp toward R · 2008: -8.6pp · 2024: -11.0pp
- All cycles
- 2024: R+11.0 2020: R+11.2 2016: R+22.0 2012: R+13.0 2008: R+8.6
Not yet ingested
- Civics
- —
Market trends
- HPI YoY
- ▼ -18.26%
- Current HPI
- 268.5609
- Rent YoY
- —
- Metro
- Salisbury, MD-DE
- State GDP YoY
- —
- F500 in state
- 0
Price history
-14.5% since first listed11 events — show timeline
- 2026-03-23 Price Changed $265,000 BRIGHT MLS
- 2025-10-14 Price Changed $280,000 BRIGHT MLS
- 2025-08-27 Listed $294,000 BRIGHT MLS
- 2025-08-04 Coming Soon $294,000 BRIGHT MLS
- 2025-07-31 Listing Removed — BRIGHT MLS
- 2025-06-12 Price Changed $310,000 BRIGHT MLS
- 2025-05-16 Price Changed $315,000 BRIGHT MLS
- 2025-02-25 Listed $320,000 BRIGHT MLS
- 2022-03-18 Sold (MLS) $295,000 BRIGHT MLS
- 2022-01-04 Pending — BRIGHT MLS
- 2021-07-01 Listed $310,000 BRIGHT MLS
Cash-flow waterfall
monthlySold comps — $/sqft
last 12 mo · ≤1 miLoading sold comps…