 Duplex
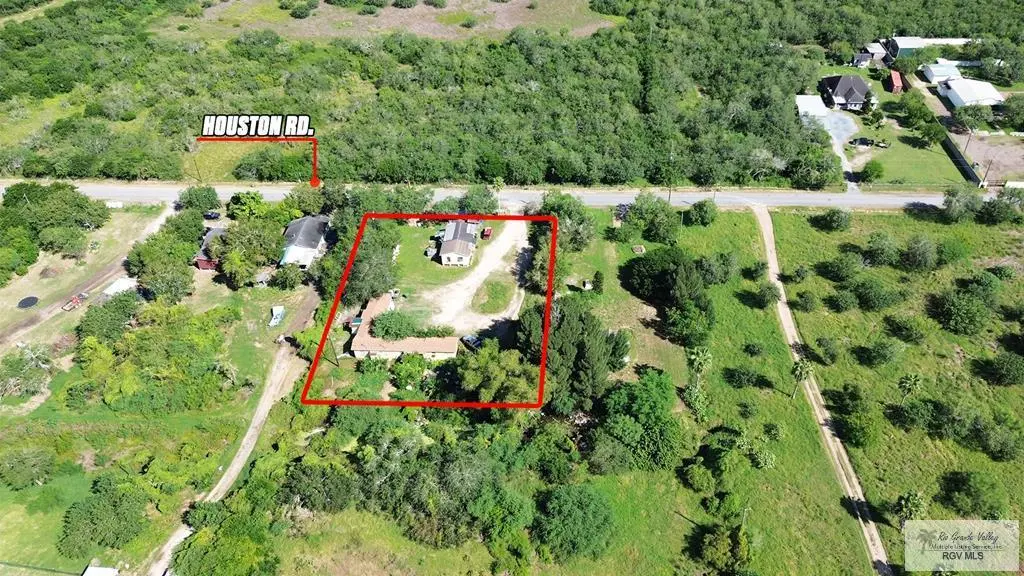
8812 Houston Rd Unit A,B,C · Brownsville, TX
Flood risk 6/10 · Moderate
- FEMA flood zone
- A
- Chance of flooding over 30 yrs
- 0.74%
- Est. flood insurance / yr
- $1,009 – $1,996
Fire risk 4/10 · Minor
- Est. fire insurance / yr
- $1,222 – $2,270
Heat risk 9/10 · Severe
- Hot days now (above 110°F)
- 4 days/yr
- Hot days in 30 yrs
- 15 days/yr
Wind risk 9/10 · Severe
- Chance of severe wind over 30 yrs
- 99.0%
Air-quality risk 2/10 · Minimal
- Unhealthy air days now
- 1 days/yr
- Unhealthy air days in 30 yrs
- 1 days/yr
Risk factors via First Street. Map © Google.
Why this score? — see what drove the B- grade
The composite is a weighted blend of 9 inputs, each scored 0–100. Each bar is that input's sub-score; the figure is the points it added to the 100-point composite (weight × sub-score).
- Cash flow +30.0/30.0
- 1% rule +10.0/10.0
- DSCR +10.0/10.0
- ARV discount +7.5/15.0
- Rent growth +4.5/5.0
- Livability +4.0/5.0
- Schools +2.2/10.0
- Condition / age +1.0/5.0
- Appreciation +0.0/10.0
$155,000
🖨 Deal sheet 📄 Offer letter ✓ Due diligence
Multi-family units
County records classify this as Multi-Family (2-4 Unit). Listing-text estimate: 2 units. confirmed
Listing remarks MLS
Investor Alert! Located in Brownsville, TX, this multifamily property offers amazing potential and a prime location just minutes from the Airport, SpaceX, Boca Chica Beach, gas stations, and restaurants. This unique opportunity features a duplex and a frame house sitting on a spacious 0.90-acre lot — almost an acre! Perfect for investors or flippers looking for their next project. SOLD AS IS — don't miss out on this incredible investment opportunity!
Key facts
- Multifamily property
- Spacious lot
- Prime location
Tags
Neighborhood map
What this means for you Summary
Snapshot
- This is a 2 × 2-bed/1-bath units multifamily listed at $155k. Condition is rated poor.
Deal economics
- At list price, monthly cash flow is $1k ($12k/yr) — positive. Per door: $519/mo.
- The deal already cash-flows at list — no discount required.
- Meets the 1% rule at list price ($3k rent vs $155k).
- Recommended offer: $146k (6.0% below list) — sets the bar for market timing.
- Cap rate 15.3% vs local median 5.0% in Brownsville — top-decile yield for the area; either an underpriced asset or a hidden risk that comps aren't pricing in. Stress-test before assuming the spread holds.
Location & tenants
- Location reads 79/100 on livability (#62 in TX, #2,311 nationally) — a middle-class / working-renter tenant base. Strengths: commute A+, cost of living A+, housing A+; Watch: schools C-, amenities D, crime D-.
- Brownsville ISD (urban): math 20% / reading 34% proficiency, ranked #710 of 826 in TX (top 86%) — low school quality limits family demand, transient renter base, plan for 1-2y turnover; 83% free/reduced lunch — lower-income household profile, screen leases tightly.
- Market conditions: Rents rising fast (+8.2%/yr); 365 active listings in the ZIP; 1 comparable units currently listed for rent nearby; lower-income renter base — watch delinquency; 2,326 units permitted in Cameron County in 2024 (503 in 5+ unit buildings).
- At $2,828/mo this rent would consume 76% of the median local household income ($45k/yr) (locally 2682% of renters already pay >50% of income on rent) — very limited rent-growth headroom before tenants either downsize or default.
Forward outlook
- Local home prices are declining (-3.0%/yr); year-one equity from $1k of loan paydown is wiped out by about $5k of value loss. Plan a longer hold.
- Cameron County population projected at +3% by 2050 — modest demand growth; plan on rents tracking national, not racing it.
- At projected returns (-3.0% appreciation + 8.0% rent growth), your $43k cash investment doubles in ~4 years — after that, you're playing with house money.
Negotiation context
- It's been on market 74 days — a 6% lower offer ($146k) is reasonable based on typical stale-listing flexibility.
- 3 sale attempts with the ask held roughly flat each time — persistent listings suggest the price (not the market) is what's stuck; bring a comps-based counter.
Risks & watch-outs
- Watch-outs: flood insurance adds $125/mo.
- Climate carrying-cost: in FEMA flood zone A (mandatory federal flood insurance); severe wind risk, 99% chance of damaging wind over 30y; extreme-heat days projected 4→15/yr by 2055 (HVAC capex compounding) — expect insurance premiums to compound above CPI over the hold.
Questions for the listing agent
- It's been on market 74 days. Have you received any prior offers? Is the seller open to a 6% concession, seller financing, or rate buy-down credit?
- Can we see the unit-by-unit rent roll, current vacancy, and any below-market leases? What's the average tenancy length?
- What capital expenditures (roof, boiler, parking lot, exteriors) have been made in the last 5 years, and what's planned in the next 2?
- Have any recent inspections been done? Can we get a copy of the seller's disclosures and any deferred-maintenance estimates?
- Built in 1974 — when were the roof, HVAC, electrical panel, plumbing, and water heater last replaced?
- What's the actual annual flood-insurance premium (NFIP or private), and is the property in a SFHA with mandatory coverage?
- Why hasn't it sold? Are there any deal-killer items the seller is aware of (foundation, flood, title, zoning, code violations)?
- Is there a deadline driving the sale (1031 exchange, divorce, estate, relocation)? That informs how much negotiation room exists.
- Crime grade is D in this area — have there been break-ins, vandalism, or insurance claims at this property in the last 3 years? What carrier currently insures it and at what premium?
- What's the average days-on-market for RENTAL listings here right now (not sales)? A rising rental-DOM trend means longer vacancies and softer asking-rent achievability than the comps imply.
- What's the recent tenant-quality profile in this submarket — average credit score on applications, eviction rate, late-payment / NSF rate, and stable-employment percentage? A property-management company in the area should have these aggregated.
- How much new apartment / multifamily construction is in the pipeline within 1–3 miles? Heavy new supply (>2% of stock underway) typically softens rents 12–24 months out; light construction supports rent growth.
Investment metrics
- 1% rule
- 1.82% ✓
- Cap rate
- 15.30%
- Cash-on-cash
- 32.16%
- DSCR
- 2.43
- GRM
- 4.6
CMA / ARV
- ARV (median comp)
- $340,851
- List price
- $155,000
- Delta
- -54.53%
- Verdict
- UNDERPRICED
- Comps
- 1 within 2.0 mi
Projected returns pro-forma
-3.0% appreciation · 8.0% rent growth · sell at horizon
- IRR
- 28.9%
- Equity multiple
- 2.29×
- Total profit
- $56,043
- Equity at exit
- $23,111
- IRR
- 39.2%
- Equity multiple
- 5.66×
- Total profit
- $202,416
- Equity at exit
- $13,402
Cash invested: $43,400 (down + closing). Projections, not guarantees.
Landlord ↔ Tenant lean methodology
- Overall (STATE)
- 87 Strongly Landlord-Friendly
- State Texas
- 87 Strongly Landlord-Friendly · R+5
- County
- — inherits STATE
- City
- — inherits STATE
ZIP-level market 78521
- Home prices YoY
- -26.0%
- Rents YoY
- 8.2%
- Active inventory
- 365
- Price-to-rent
- 9.1×
Monthly cashflow live
- Estimated rent
- $2,828 medium interval (Pro) →
- Mortgage (P&I)
- −$813
- Tax est. 1.5%
- −$194 /mo · $2,325/yr
- Insurance
- −$65
- Flood insurance flood zone
- −$125 /mo · $1,502/yr
- HOA
- −$0
- Vacancy / Maint / Mgmt
- −$594
- Net cashflow
- $1,038
Break-even live
2-unit breakdown (identical units grouped — click to expand)
| Units | Beds | Baths | Est. rent |
|---|---|---|---|
| 2× units | 2 | 1 | $2,828 |
| #1 | 2 | 1 | $1,414 |
| #2 | 2 | 1 | $1,414 |
| Total (2 units) | $2,828 | ||
UW: 25.0% down · 7.5% · 30yr · 1.5% tax · 5.0% vac · 8.0% maint · 8.0% mgmt
Financing live
Cash to close
- Down payment
- $38,750
- Closing costs
- $4,650
- Reserves months
- —
- Total cash needed
- —
Loan-product check · same deal, 3 products live
Conventional
25% down · 7.5% · 30yr
- Down + closing
- —
- Monthly P&I
- —
- Monthly cashflow
- —
- DSCR
- —
- Eligible?
- —
Personal DTI + credit; lowest rate.
DSCR
20% down · 8.5% · 30yr
- Down + closing
- —
- Monthly P&I
- —
- Monthly cashflow
- —
- DSCR
- —
- Eligible?
- —
No personal income docs; deal must DSCR.
Hard money
10% down · 12.0% · 12mo
- Down + closing
- —
- Monthly P&I
- —
- Monthly cashflow
- —
- DSCR
- —
- Eligible?
- —
Short-term bridge; refi at stabilization.
Rent comps 1 comps
| Address | Beds | Baths | Sqft | Rent | $/sqft | DOM | Units | Dist |
|---|---|---|---|---|---|---|---|---|
| 35 Little Grove St Brownsville, TX | 3.0 | 3.0 | 1800 | $2,500 | $1.39 | 44d | 1 | 0.59mi |
Listing history 20 events
-
2026-06-18days on market $155,000 Active 74 DOM
-
2026-06-17days on market $155,000 Active 73 DOM
-
2026-06-16days on market $155,000 Active 72 DOM
-
2026-06-15days on market $155,000 Active 71 DOM
-
2026-06-14days on market $155,000 Active 69 DOM
-
2026-06-13days on market $155,000 Active 68 DOM
-
2026-06-10days on market $155,000 Active 66 DOM
-
2026-06-09days on market $155,000 Active 65 DOM
-
2026-06-08days on market $155,000 Active 64 DOM
-
2026-06-07days on market $155,000 Active 63 DOM
-
2026-06-05days on market $155,000 Active 60 DOM
-
2026-06-03days on market $155,000 Active 59 DOM
-
2026-06-02days on market $155,000 Active 58 DOM
-
2026-06-01days on market $155,000 Active 57 DOM
-
2026-05-31days on market $155,000 Active 56 DOM
-
2026-05-30days on market $155,000 Active 55 DOM
-
2026-05-11status Active 466-char remark
Show marketing remark (466 chars)
Investor Alert! Located in Brownsville, TX, this multifamily property offers amazing potential and a prime location just minutes from the Airport, SpaceX, Boca Chica Beach, gas stations, and restaurants. This unique opportunity features a duplex and a frame house sitting on a spacious 0.90-acre lot — almost an acre! Perfect for investors or flippers looking for their next project. SOLD AS IS — don't miss out on this incredible investment opportunity!
-
2026-04-14status Active 466-char remark
Show marketing remark (466 chars)
Investor Alert! Located in Brownsville, TX, this multifamily property offers amazing potential and a prime location just minutes from the Airport, SpaceX, Boca Chica Beach, gas stations, and restaurants. This unique opportunity features a duplex and a frame house sitting on a spacious 0.90-acre lot — almost an acre! Perfect for investors or flippers looking for their next project. SOLD AS IS — don't miss out on this incredible investment opportunity!
-
2026-03-05$155,000 Active 466-char remark
Show marketing remark (466 chars)
Investor Alert! Located in Brownsville, TX, this multifamily property offers amazing potential and a prime location just minutes from the Airport, SpaceX, Boca Chica Beach, gas stations, and restaurants. This unique opportunity features a duplex and a frame house sitting on a spacious 0.90-acre lot — almost an acre! Perfect for investors or flippers looking for their next project. SOLD AS IS — don't miss out on this incredible investment opportunity!
-
2026-02-03price $155,000
ⓘ Source: listings_history table (triggers on properties + properties_extension) + one-shot
backfill from property_details.listing_events for pre-trigger history.
Climate risk First Street
- Flood 6/10 Major FEMA zone A · 74% chance over 30 yrs
- Wildfire 4/10 Moderate
- Heat 9/10 Extreme 4 d/yr ≥110°F today · 15 d/yr by 30 yrs out
- Wind 9/10 Extreme 99% chance of damaging wind over 30 yrs
- Air quality 2/10 Low 1 unhealthy d/yr today · 1 by 30 yrs out
Nearby sold comps map
Loading sold comps map…
Walkable amenities ~0.75 mi
Loading nearby amenities…
Taxation est. · year 1
- Rental income
- $33,936
- − Mortgage interest
- −$8,682
- − Property taxes
- −$2,325
- − Insurance
- −$2,278
- − Repairs & maintenance
- −$2,715
- − Management
- −$2,715
- − Depreciation
- −$4,509
- Taxable income
- $10,712
- Est. tax owed @ 24.0%
- −$2,571
- After-tax cash flow
- $9,882/yr
For passive investors: Depreciation is non-cash, so a rental often shows a tax loss while cash-flowing — sheltering income. Rental losses are passive: they offset passive income freely, and up to $25,000/yr can offset ordinary (W-2) income if you actively participate and your MAGI is under $100k (phasing out to $0 by $150k); unused losses carry forward. On sale, claimed depreciation is recaptured at up to 25%, and gains may owe capital-gains tax (a 1031 exchange can defer both). Figures are a year-1 estimate at your 24.0% rate — not tax advice; consult a CPA.
Condition & rehab AI · 12 photos
This multifamily property is in poor condition with overgrown vegetation and landscaping. Significant repairs and maintenance are needed to improve its condition and increase its resale or rental value.
Repairs flagged
- Major overgrown vegetation — Vegetation is dense and overgrown, obscuring the property's layout and condition
- Major landscaping — Landscaping is overgrown and unkempt
Value-add opportunities
- Both landscaping and overgrown vegetation removal — Removing overgrown vegetation and landscaping will improve the property's curb appeal and make it more attractive for potential buyers or renters
- Both exterior painting — Painting the exterior will improve the property's appearance and make it more attractive for potential buyers or renters
- Both roof inspection — Inspecting the roof will ensure it is in good condition and address any potential issues before they become major repairs
- Both HVAC/mechanical inspection — Inspecting the HVAC and mechanical systems will ensure they are in good condition and address any potential issues before they become major repairs
Renovation cost estimate screening
| Repair item | Severity | Est. cost |
|---|---|---|
| overgrown vegetation · Vegetation is dense and overgrown, obscuring the property's layout and condition | Major | $15,000–50,000 |
| landscaping · Landscaping is overgrown and unkempt | Major | $15,000–50,000 |
| Total estimated repair cost · 2 items | $30,000–100,000 |
Value-add ROI direction
- Both landscaping and overgrown vegetation removal — Removing overgrown vegetation and landscaping will improve the property's curb appeal and make it more attractive for potential buyers or renters ↑
- Both exterior painting — Painting the exterior will improve the property's appearance and make it more attractive for potential buyers or renters ↑
- Both roof inspection — Inspecting the roof will ensure it is in good condition and address any potential issues before they become major repairs ↑
- Both HVAC/mechanical inspection — Inspecting the HVAC and mechanical systems will ensure they are in good condition and address any potential issues before they become major repairs ↑
ⓘ Cost ranges are severity-bucket heuristics (US national rule-of-thumb). Get contractor quotes + a written scope before underwriting a rehab budget.
Schools (NCES district)
- District
- Brownsville ISD
- NCES district ID
- 4811680
- Math proficiency
- 20% ▼ -36.00%
- Reading proficiency
- 34% ▼ -13.00%
- Median HH income
- $30,490
- Composite
- 21.8/100
- National rank
- #8249
- State rank
- #710 of 826 in TX
Livability — Brownsville
- Score
- 79/100
- State rank
- #62
- US rank
- #2311
Category grades
Schools grade is shown separately in the Schools card above.
Census & demographics
- County
- Cameron County · 310,734 people
- City population
- 212,132
- Metro
- Brownsville-Harlingen, TX
- Population (ZIP)
- 87,380
- Household income
- $44,509
- Rent vs Own
- Severe rent burden
- 2682.0
Population outlook (Cameron County) Hauer SSP2
- Today (2025)
- 441,603 people
- By 2030
- 448,113 · +1.5%
- By 2040
- 456,385 · +3.3%
- By 2050
- 456,294 · +3.3%
- By 2075
- 423,851 · -4.0%
- By 2100
- 342,787 · -22.4%
Race, ethnicity, and origin ACS 2023
- Neighborhood character
- Predominantly Hispanic (97%)
- Race & ethnicity
- Hispanic / Latino 97% Two or more races 45% White 3%
- Hispanic origin (detail)
- Mexican 91%
- Foreign-born
- 30% · Canada
- Languages at home
- 12% English-only · Spanish 88%
Political lean MEDSL · Cameron
- 2024 margin
- Lean R (+5.8) · D 46.7% · R 52.5%
- 2008→2024 swing
- -34.6pp toward R · 2008: 28.8pp · 2024: -5.8pp
- All cycles
- 2024: R+5.8 2020: D+13.2 2016: D+32.5 2012: D+32.4 2008: D+28.8
Not yet ingested
- Civics
- —
Market trends
- HPI YoY
- ▼ -81.45%
- Current HPI
- 232.1072
- Rent YoY
- ▲ 8.19%
- Metro
- Brownsville-Harlingen, TX
- State GDP YoY
- ▲ 3.95%
- F500 in state
- 110
Industry mix (Fortune 500 HQ in TX)
| Industry | F500 HQs | Revenue |
|---|---|---|
| Energy | 16 | $1,198B |
|
||
| Technology | 5 | $198B |
|
||
| Engineering / Construction | 4 | $72B |
|
||
| Energy Services | 3 | $60B |
|
||
| Utilities | 3 | $41B |
|
||
| Healthcare | 2 | $330B |
|
||
Price history
+0.0% since first listed4 events — show timeline
- 2026-05-11 Relisted — RGVMLS
- 2026-04-14 Relisted — RGVMLS
- 2026-03-05 Listed $155,000 RGVMLS
- 2026-02-03 Price Changed $155,000 RGVMLS
Cash-flow waterfall
monthlySold comps — $/sqft
last 12 mo · ≤1 miLoading sold comps…