 Multi-family
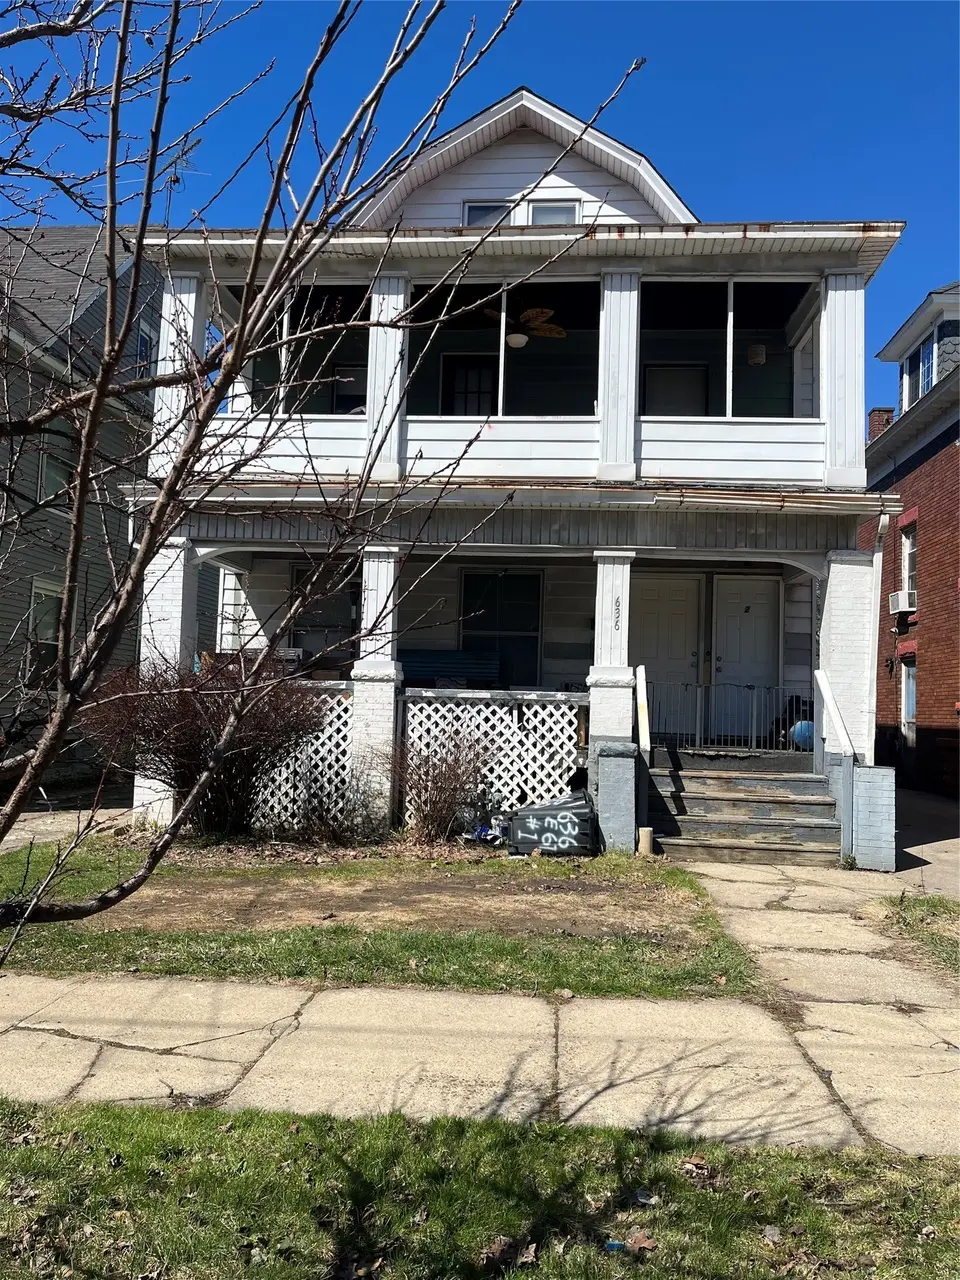
636 E 6th St · Erie, PA
Flood risk 1/10 · Minimal
- FEMA flood zone
- X (unshaded)
- Chance of flooding over 30 yrs
- 0.0%
- Est. flood insurance / yr
- $473 – $860
Fire risk 1/10 · Minimal
- Est. fire insurance / yr
- $511 – $949
Heat risk 2/10 · Minimal
- Hot days now (above 90°F)
- 7 days/yr
- Hot days in 30 yrs
- 17 days/yr
Wind risk 1/10 · Minimal
- Chance of severe wind over 30 yrs
- —
Air-quality risk 2/10 · Minimal
- Unhealthy air days now
- 1 days/yr
- Unhealthy air days in 30 yrs
- 3 days/yr
Risk factors via First Street. Map © Google.
Why this score? — see what drove the B- grade
The composite is a weighted blend of 9 inputs, each scored 0–100. Each bar is that input's sub-score; the figure is the points it added to the 100-point composite (weight × sub-score).
- Cash flow +30.0/30.0
- 1% rule +10.0/10.0
- DSCR +10.0/10.0
- Appreciation +7.1/10.0
- Livability +4.2/5.0
- Rent growth +2.5/5.0
- Condition / age +2.5/5.0
- Schools +1.3/10.0
- ARV discount +0.0/15.0
$82,000
🖨 Deal sheet 📄 Offer letter ✓ Due diligence
Multi-family units
County records classify this as Multi-Family (2-4 Unit). Listing-text estimate: 1 unit. estimate disagrees with records
Listing remarks MLS
Spacious two-unit property offering great income potential. Each unit features generous living space, marking it attractive for tenants. Shared driveway with convenient parking available in the rear. A solid addition to any investment portfolio!
Key facts
- Two-unit property
- Income potential
- Shared driveway
Tags
Neighborhood map
What this means for you Summary
Snapshot
- This is a 4-bed/2.0-bath multifamily listed at $82k.
Deal economics
- At list price, monthly cash flow is $1k ($12k/yr) — positive.
- The deal already cash-flows at list — no discount required.
- Meets the 1% rule at list price ($2k rent vs $82k).
- Recommended offer: $77k (6.0% below list) — sets the bar for market timing.
- Cap rate 21.4% vs local median 5.2% in Erie — top-decile yield for the area; either an underpriced asset or a hidden risk that comps aren't pricing in. Stress-test before assuming the spread holds.
Location & tenants
- Location reads 83/100 on livability (#109 in PA, #840 nationally) — a professional / high-income tenant draw. Strengths: amenities A+, commute A+, cost of living A+; Watch: crime D+, employment F.
- Erie City SD (urban): math 12% / reading 19% proficiency, ranked #510 of 539 in PA (top 95%) — low school quality limits family demand, transient renter base, plan for 1-2y turnover; 81% free/reduced lunch — lower-income household profile, screen leases tightly.
- Market conditions: Rents flat; 39 active listings in the ZIP; 1 comparable units currently listed for rent nearby; lower-income renter base — watch delinquency; 364 units permitted in Erie County in 2024 (188 in 5+ unit buildings).
- At $2,043/mo this rent would consume 73% of the median local household income ($33k/yr) (locally 776% of renters already pay >50% of income on rent) — very limited rent-growth headroom before tenants either downsize or default.
Forward outlook
- In year one you build about $4k of equity ($567 loan paydown + $3k appreciation (4.2% local appreciation)).
- Erie County population projected at -14% by 2050 — secular population decline; favor cash flow + early exit over multi-decade hold.
- At projected returns (4.2% appreciation + 0.1% rent growth), your $23k cash investment doubles in ~2 years — after that, you're playing with house money.
- By year 9, paydown + projected appreciation supports a ~$34k cash-out refi (75% LTV) — recoverable capital for the next deal without selling this one.
Negotiation context
- It's been on market 69 days — a 6% lower offer ($77k) is reasonable based on typical stale-listing flexibility.
- Current owner paid $35k; list at $82k implies a 135% gain — meaningful room to come down on a strong offer.
Risks & watch-outs
- Watch-outs: built in 1907 — expect roof / HVAC / electrical / plumbing capex.
Questions for the listing agent
- It's been on market 69 days. Have you received any prior offers? Is the seller open to a 6% concession, seller financing, or rate buy-down credit?
- Built in 1907 — when were the roof, HVAC, electrical panel, plumbing, and water heater last replaced?
- Why hasn't it sold? Are there any deal-killer items the seller is aware of (foundation, flood, title, zoning, code violations)?
- Is there a deadline driving the sale (1031 exchange, divorce, estate, relocation)? That informs how much negotiation room exists.
- Crime grade is D in this area — have there been break-ins, vandalism, or insurance claims at this property in the last 3 years? What carrier currently insures it and at what premium?
- What's the average days-on-market for RENTAL listings here right now (not sales)? A rising rental-DOM trend means longer vacancies and softer asking-rent achievability than the comps imply.
- What's the recent tenant-quality profile in this submarket — average credit score on applications, eviction rate, late-payment / NSF rate, and stable-employment percentage? A property-management company in the area should have these aggregated.
- How much new apartment / multifamily construction is in the pipeline within 1–3 miles? Heavy new supply (>2% of stock underway) typically softens rents 12–24 months out; light construction supports rent growth.
Investment metrics
- 1% rule
- 2.49% ✓
- Cap rate
- 21.42%
- Cash-on-cash
- 54.01%
- DSCR
- 3.40
- GRM
- 3.3
CMA / ARV
- ARV (median comp)
- $59,968
- List price
- $82,000
- Delta
- 36.74%
- Verdict
- OVERPRICED
- Comps
- 20 within 1.0 mi
Show comp detail 12 sales within ~0.75 mi
| Address | Dist | Beds/Ba | Sqft | Sold | Price | $/sf | Match |
|---|---|---|---|---|---|---|---|
| 730-32 E 8th St | 0.20mi | 5/2.0 (+1) | 2,033 (+2%) | 4mo | $65,000 | $32 | 80 |
| 548 E 7th St | 0.13mi | 4/2.0 | 1,936 (-3%) | 11mo | $47,000 | $24 | 79 |
| 815 Parade St | 0.38mi | 4/2.0 | 2,102 (+5%) | 2mo | $45,000 | $21 | 72 |
| 402 Reed St | 0.13mi | 5/2.0 (+1) | 1,877 (-6%) | 8mo | $110,000 | $59 | 72 |
| 508 E 9th St | 0.29mi | 4/3.0 | 1,814 (-9%) | 9mo | $100,000 | $55 | 60 |
| 713 E 12th St | 0.50mi | 3/2.0 (-1) | 1,880 (-6%) | 5mo | $82,000 | $44 | 58 |
| 327 E 7th St | 0.43mi | 4/2.0 | 2,184 (+9%) | 10mo | $80,327 | $37 | 56 |
| 1219 E Lake Rd | 0.74mi | 4/2.0 | 2,024 (+1%) | 9mo | $53,000 | $26 | 56 |
| 716 E 15th St | 0.63mi | 4/2.0 | 1,893 (-5%) | 11mo | $50,000 | $26 | 53 |
| 1117 E 9th St | 0.66mi | 5/2.0 (+1) | 1,912 (-4%) | 5mo | $68,000 | $36 | 53 |
| 644 E 13th St | 0.52mi | 3/2.0 (-1) | 1,875 (-6%) | 10mo | $37,000 | $20 | 51 |
| 346 E 2nd St | 0.48mi | 4/2.0 | 2,263 (+13%) | 10mo | $125,346 | $55 | 47 |
Match score weights: distance 35% · size 25% · config 20% · recency 20%. Top-matched comps best support the ARV.
Projected returns pro-forma
4.17% appreciation · 0.1% rent growth · sell at horizon
- IRR
- 57.7%
- Equity multiple
- 4.27×
- Total profit
- $75,133
- Equity at exit
- $42,390
- IRR
- 55.0%
- Equity multiple
- 8.07×
- Total profit
- $162,342
- Equity at exit
- $69,990
Cash invested: $22,960 (down + closing). Projections, not guarantees.
Landlord ↔ Tenant lean methodology
- Overall (STATE)
- 62 Landlord-Friendly
- State Pennsylvania
- 62 Landlord-Friendly · EVEN
- County
- — inherits STATE
- City
- — inherits STATE
ZIP-level market 16507
- Home prices YoY
- 2.6%
- Rents YoY
- 0.1%
- Active inventory
- 39
- Price-to-rent
- 6.7×
Monthly cashflow live
- Estimated rent
- $2,043 high interval (Pro) →
- Mortgage (P&I)
- −$430
- Tax from tax record
- −$116 /mo · $1,396/yr
- Insurance
- −$34
- HOA
- −$0
- Vacancy / Maint / Mgmt
- −$429
- Net cashflow
- $1,033
Break-even live
2-unit breakdown (identical units grouped — click to expand)
| Units | Beds | Baths | Est. rent |
|---|---|---|---|
| 2× units | 2 | 1 | $2,044 |
| #1 | 2 | 1 | $1,022 |
| #2 | 2 | 1 | $1,022 |
| Total (2 units) | $2,043 | ||
UW: 25.0% down · 7.5% · 30yr · 1.5% tax · 5.0% vac · 8.0% maint · 8.0% mgmt
Financing live
Cash to close
- Down payment
- $20,500
- Closing costs
- $2,460
- Reserves months
- —
- Total cash needed
- —
Loan-product check · same deal, 3 products live
Conventional
25% down · 7.5% · 30yr
- Down + closing
- —
- Monthly P&I
- —
- Monthly cashflow
- —
- DSCR
- —
- Eligible?
- —
Personal DTI + credit; lowest rate.
DSCR
20% down · 8.5% · 30yr
- Down + closing
- —
- Monthly P&I
- —
- Monthly cashflow
- —
- DSCR
- —
- Eligible?
- —
No personal income docs; deal must DSCR.
Hard money
10% down · 12.0% · 12mo
- Down + closing
- —
- Monthly P&I
- —
- Monthly cashflow
- —
- DSCR
- —
- Eligible?
- —
Short-term bridge; refi at stabilization.
Rent comps 1 comps
| Address | Beds | Baths | Sqft | Rent | $/sqft | DOM | Units | Dist |
|---|---|---|---|---|---|---|---|---|
| 622 E 4th St Erie, PA | 3.0 | 1.0 | 1500 | $1,250 | $0.83 | 44d | 1 | 0.15mi |
Listing history 19 events
-
2026-06-15status $82,000 Pending 69 DOM
-
2026-06-15days on market $82,000 Active 69 DOM
-
2026-06-14days on market $82,000 Active 67 DOM
-
2026-06-13days on market $82,000 Active 66 DOM
-
2026-06-10days on market $82,000 Active 64 DOM
-
2026-06-09days on market $82,000 Active 63 DOM
-
2026-06-08days on market $82,000 Active 62 DOM
-
2026-06-07days on market $82,000 Active 61 DOM
-
2026-06-05days on market $82,000 Active 58 DOM
-
2026-06-03days on market $82,000 Active 57 DOM
-
2026-06-02days on market $82,000 Active 56 DOM
-
2026-06-01days on market $82,000 Active 55 DOM
-
2026-05-31days on market $82,000 Active 54 DOM
-
2026-05-30days on market $82,000 Active 53 DOM
-
2026-04-07$82,000 Active 245-char remark
Show marketing remark (245 chars)
Spacious two-unit property offering great income potential. Each unit features generous living space, marking it attractive for tenants. Shared driveway with convenient parking available in the rear. A solid addition to any investment portfolio!
-
2022-05-11soldstatus $34,900
-
2001-03-23soldstatus $31,000
-
1988-12-06soldstatus $26,000
-
1984-06-18soldstatus $24,000
ⓘ Source: listings_history table (triggers on properties + properties_extension) + one-shot
backfill from property_details.listing_events for pre-trigger history.
Tax reassessment forecast PA · Partial reset (capped growth)
- Current annual tax
- $1,396 · $116/mo
- Projected year-2 tax
- $1,396 · $116/mo
- Expected delta
- $0/yr ($0/mo · 0.0%)
ⓘ Screening estimate from a state-policy table — verify with the county assessor before closing.
Climate risk First Street
- Flood 1/10 Low FEMA zone X (unshaded) · 0% chance over 30 yrs
- Wildfire 1/10 Low
- Heat 2/10 Low 7 d/yr ≥90°F today · 17 d/yr by 30 yrs out
- Wind 1/10 Low
- Air quality 2/10 Low 1 unhealthy d/yr today · 3 by 30 yrs out
Nearby sold comps map
Loading sold comps map…
Walkable amenities ~0.75 mi
Loading nearby amenities…
Taxation est. · year 1
- Rental income
- $24,516
- − Mortgage interest
- −$4,593
- − Property taxes
- −$1,396
- − Insurance
- −$410
- − Repairs & maintenance
- −$1,961
- − Management
- −$1,961
- − Depreciation
- −$2,385
- Taxable income
- $11,809
- Est. tax owed @ 24.0%
- −$2,834
- After-tax cash flow
- $9,567/yr
For passive investors: Depreciation is non-cash, so a rental often shows a tax loss while cash-flowing — sheltering income. Rental losses are passive: they offset passive income freely, and up to $25,000/yr can offset ordinary (W-2) income if you actively participate and your MAGI is under $100k (phasing out to $0 by $150k); unused losses carry forward. On sale, claimed depreciation is recaptured at up to 25%, and gains may owe capital-gains tax (a 1031 exchange can defer both). Figures are a year-1 estimate at your 24.0% rate — not tax advice; consult a CPA.
Schools (NCES district)
- District
- Erie City SD
- NCES district ID
- 4209300
- Math proficiency
- 12% ▼ -11.00%
- Reading proficiency
- 19% ▼ -16.00%
- Median HH income
- $33,625
- Composite
- 12.59/100
- National rank
- #9617
- State rank
- #510 of 539 in PA
Livability — Erie
- Score
- 83/100
- State rank
- #109
- US rank
- #840
Category grades
Schools grade is shown separately in the Schools card above.
Census & demographics
- Census place
- Erie, PA
- County
- Erie County · 92,215 people
- City population
- 92,215
- Metro
- Erie, PA
- Population (ZIP)
- 8,597
- Household income
- $33,361
- Rent vs Own
- Severe rent burden
- 776.0
Population outlook (Erie County) Hauer SSP2
- Today (2025)
- 272,159 people
- By 2030
- 266,299 · -2.2%
- By 2040
- 250,987 · -7.8%
- By 2050
- 234,925 · -13.7%
- By 2075
- 199,164 · -26.8%
- By 2100
- 162,985 · -40.1%
Race, ethnicity, and origin ACS 2023
- Neighborhood character
- Diverse neighborhood (Simpson 0.60)
- Race & ethnicity
- White 58% Black 24% Two or more races 9% Hispanic / Latino 8% Asian 3%
- Hispanic origin (detail)
- Mexican 1% Puerto Rican 4%
- Common ancestry
- Romanian 10% Scotch-Irish 1% Lithuanian 1%
- Foreign-born
- 6% · Canada, Vietnam, China
- Languages at home
- 90% English-only · Spanish 5% Vietnamese 1% Russian/Polish/Slavic 1%
Political lean MEDSL · Erie
- 2024 margin
- Toss-up / Even · D 49.0% · R 50.0%
- 2008→2024 swing
- -20.9pp toward R · 2008: 19.9pp · 2024: -1.0pp
- All cycles
- 2024: R+1.0 2020: D+1.0 2016: R+2.0 2012: D+16.9 2008: D+19.9
Not yet ingested
- Civics
- —
Market trends
- HPI YoY
- ▲ 4.17%
- Current HPI
- 163.92
- Rent YoY
- ▲ 0.10%
- Metro
- Erie, PA
- State GDP YoY
- ▲ 1.68%
- F500 in state
- 34
Industry mix (Fortune 500 HQ in PA)
| Industry | F500 HQs | Revenue |
|---|---|---|
| Healthcare | 2 | $309B |
|
||
| Insurance | 2 | $27B |
|
||
| Telecommunications / Media | 1 | $124B |
|
||
| Industrial Distribution | 1 | $22B |
|
||
| Financial Services | 1 | $20B |
|
||
| Chemicals / Materials | 1 | $18B |
|
||
Price history
+241.7% since first listed5 events — show timeline
- 2026-04-07 Listed $82,000 GEBOR
- 2022-05-11 Sold (Public Records) $34,900 Public Records
- 2001-03-23 Sold (Public Records) $31,000 Public Records
- 1988-12-06 Sold (Public Records) $26,000 Public Records
- 1984-06-18 Sold (Public Records) $24,000 Public Records
Property tax history
+1.9%/yrLatest (2026): $1,396 · +3.4% YoY. Source: county tax records.
Cash-flow waterfall
monthlySold comps — $/sqft
last 12 mo · ≤1 miLoading sold comps…