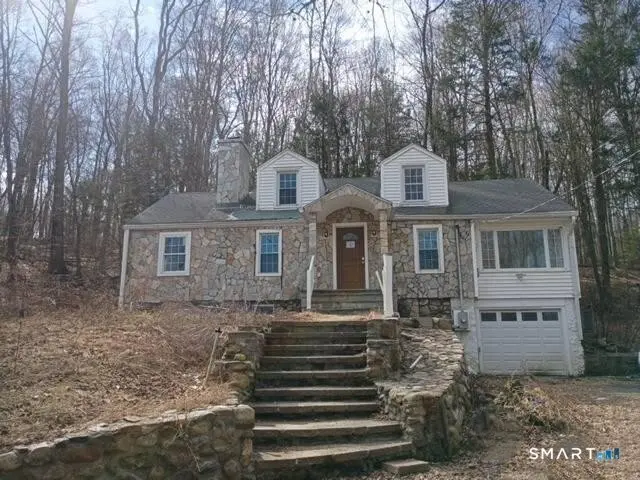
46 Broadview Hts Ext · Thomaston, CT
Flood risk 1/10 · Minimal
- FEMA flood zone
- X
- Chance of flooding over 30 yrs
- 0.0%
- Est. flood insurance / yr
- $473 – $860
Fire risk 4/10 · Minor
- Est. fire insurance / yr
- $829 – $1,539
Heat risk 4/10 · Minor
- Hot days now (above 96°F)
- 7 days/yr
- Hot days in 30 yrs
- 15 days/yr
Wind risk 5/10 · Moderate
- Chance of severe wind over 30 yrs
- 26.0%
Air-quality risk 2/10 · Minimal
- Unhealthy air days now
- 1 days/yr
- Unhealthy air days in 30 yrs
- 1 days/yr
Risk factors via First Street. Map © Google.
Why this score? — see what drove the B- grade
The composite is a weighted blend of 9 inputs, each scored 0–100. Each bar is that input's sub-score; the figure is the points it added to the 100-point composite (weight × sub-score).
- Cash flow +30.0/30.0
- 1% rule +10.0/10.0
- DSCR +10.0/10.0
- ARV discount +7.5/15.0
- Schools +3.6/10.0
- Livability +3.2/5.0
- Rent growth +2.5/5.0
- Condition / age +2.5/5.0
- Appreciation +0.0/10.0
$120,000
🖨 Deal sheet 📄 Offer letter ✓ Due diligence
Listing remarks MLS
Cape Cod home located on a convenient location. Great property to restore. Great potential that could be well worth the effort. Please review legal description on lot size information.
Key facts
- 1.26 acre lot
- Garage
- Built 1930
Property features AI
Exterior
- Parking: Under-house garage; One garage
- Utilities: Public water connected; Public sewer connected
- Home design: Single family home
- Construction: Block and stone foundation; Stone/masonry construction
- Exterior features: Asphalt shingle roof; Stone, wood and other siding; Property located on a cul-de-sac
Interior
- Kitchen: Oven/Range included
- Bedrooms: Three bedrooms
- Bathrooms: One full bathroom; One half bathroom
- Heating & cooling: Central air; Other heating type; Other hot water system
- Interior features: Open floor plan; One fireplace; Seven total rooms; No basement
- Laundry & utility: Laundry on lower level
Neighborhood map
What this means for you Summary
Snapshot
- This is a 3-bed/1.5-bath single-family listed at $120k.
Deal economics
- At list price, monthly cash flow is $663 ($8k/yr) — positive.
- The deal already cash-flows at list — no discount required.
- Meets the 1% rule at list price ($2k rent vs $120k).
- Cap rate 12.9% vs local median 4.5% in Thomaston — top-decile yield for the area; either an underpriced asset or a hidden risk that comps aren't pricing in. Stress-test before assuming the spread holds.
Location & tenants
- Location reads 64/100 on livability (#127 in CT) — a middle-class / working-renter tenant base. Strengths: crime A+, housing A-, cost of living B+; Watch: amenities F, commute F, employment D-.
- Thomaston School District (suburban): math 31% / reading 48% proficiency, ranked #101 of 153 in CT (top 66%) — families likely to look elsewhere, expect single-tenant / working-renter base with shorter leases; only 15% free/reduced lunch — higher-income household profile.
- Zoned schools: Thomaston High School (math 32% / reading 57%, grade F, #94 of 194 statewide, top 49%, 317 students, 33% FRL) — zoned schools average 33% FRL vs 15% district-wide (18 pts higher); higher-poverty schools than district average — tighter screening recommended.
- Market conditions: 16 active listings in the ZIP; 2 comparable units currently listed for rent nearby; 502 units permitted in Naugatuck Valley Planning Region in 2024 (171 in 5+ unit buildings).
Forward outlook
- Local home prices are declining (-3.0%/yr); year-one equity from $830 of loan paydown is wiped out by about $4k of value loss. Plan a longer hold.
- At projected returns (-3.0% appreciation + 3.0% rent growth), your $34k cash investment doubles in ~6 years — after that, you're playing with house money.
Negotiation context
- Only 5 days on market — expect competitive offers; lowballing is unlikely to land.
- 2 sale attempts since 8y ago with the ask held roughly flat each time — persistent listings suggest the price (not the market) is what's stuck; bring a comps-based counter.
- Current owner paid $48k; list at $120k implies a 153% gain — meaningful room to come down on a strong offer.
Risks & watch-outs
- Watch-outs: property tax is 4.1% of price; built in 1930 — expect roof / HVAC / electrical / plumbing capex.
- Climate carrying-cost: moderate wind risk, 26% chance of damaging wind over 30y — expect insurance premiums to compound above CPI over the hold.
Questions for the listing agent
- Built in 1930 — when were the roof, HVAC, electrical panel, plumbing, and water heater last replaced?
- Property tax is high relative to price — has the assessment been appealed recently, and will the sale trigger a re-assessment?
- Is there a deadline driving the sale (1031 exchange, divorce, estate, relocation)? That informs how much negotiation room exists.
- What's the average days-on-market for RENTAL listings here right now (not sales)? A rising rental-DOM trend means longer vacancies and softer asking-rent achievability than the comps imply.
- What's the recent tenant-quality profile in this submarket — average credit score on applications, eviction rate, late-payment / NSF rate, and stable-employment percentage? A property-management company in the area should have these aggregated.
- How much new for-sale + rental construction is in the pipeline within 1–3 miles? Heavy new supply typically softens prices + rents 12–24 months out; constrained supply supports both.
Investment metrics
- 1% rule
- 1.85% ✓
- Cap rate
- 12.93%
- Cash-on-cash
- 23.70%
- DSCR
- 2.05
- GRM
- 4.5
CMA / ARV
- ARV (median comp)
- $309,867
- List price
- $120,000
- Delta
- -61.27%
- Verdict
- UNDERPRICED
- Comps
- 20 within 1.0 mi
Show comp detail 7 sales within ~0.75 mi
| Address | Dist | Beds/Ba | Sqft | Sold | Price | $/sf | Match |
|---|---|---|---|---|---|---|---|
| 82 Pleasant St | 0.33mi | 3/1.5 | 1,608 (-7%) | 7mo | $340,000 | $211 | 67 |
| 258 Prospect St | 0.38mi | 3/1.0 | 1,740 (+0%) | 17mo | $295,000 | $170 | 66 |
| 96 Elm St | 0.50mi | 4/1.5 (+1) | 1,705 (-2%) | 5mo | $202,500 | $119 | 65 |
| 103 Clay St | 0.68mi | 3/1.5 | 1,730 (-0%) | 10mo | $306,000 | $177 | 59 |
| 81 Elm St | 0.53mi | 3/2.0 | 1,554 (-10%) | 1mo | $330,000 | $212 | 55 |
| 109 Clay St | 0.68mi | 3/1.5 | 1,889 (+9%) | 10mo | $95,000 | $50 | 45 |
| 68 Grand St | 0.71mi | 3/2.5 | 1,480 (-15%) | 15mo | $320,000 | $216 | 26 |
Match score weights: distance 35% · size 25% · config 20% · recency 20%. Top-matched comps best support the ARV.
Projected returns pro-forma
-3.0% appreciation · 3.0% rent growth · sell at horizon
- IRR
- 16.9%
- Equity multiple
- 1.68×
- Total profit
- $23,003
- Equity at exit
- $17,892
- IRR
- 25.5%
- Equity multiple
- 3.24×
- Total profit
- $75,222
- Equity at exit
- $10,375
Cash invested: $33,600 (down + closing). Projections, not guarantees.
Landlord ↔ Tenant lean methodology
- Overall (STATE)
- 27 Tenant-Leaning
- State Connecticut
- 27 Tenant-Leaning · D+7
- County
- — inherits STATE
- City
- — inherits STATE
ZIP-level market 06787
- Home prices YoY
- -27.1%
- Active inventory
- 16
- Price-to-rent
- 4.5×
Monthly cashflow live
- Estimated rent
- $2,216 medium interval (Pro) →
- Mortgage (P&I)
- −$629
- Tax from tax record
- −$408 /mo · $4,894/yr
- Insurance
- −$50
- HOA
- −$0
- Vacancy / Maint / Mgmt
- −$465
- Net cashflow
- $663
Break-even live
UW: 25.0% down · 7.5% · 30yr · 1.5% tax · 5.0% vac · 8.0% maint · 8.0% mgmt
Financing live
Cash to close
- Down payment
- $30,000
- Closing costs
- $3,600
- Reserves months
- —
- Total cash needed
- —
Loan-product check · same deal, 3 products live
Conventional
25% down · 7.5% · 30yr
- Down + closing
- —
- Monthly P&I
- —
- Monthly cashflow
- —
- DSCR
- —
- Eligible?
- —
Personal DTI + credit; lowest rate.
DSCR
20% down · 8.5% · 30yr
- Down + closing
- —
- Monthly P&I
- —
- Monthly cashflow
- —
- DSCR
- —
- Eligible?
- —
No personal income docs; deal must DSCR.
Hard money
10% down · 12.0% · 12mo
- Down + closing
- —
- Monthly P&I
- —
- Monthly cashflow
- —
- DSCR
- —
- Eligible?
- —
Short-term bridge; refi at stabilization.
Rent comps 2 comps
| Address | Beds | Baths | Sqft | Rent | $/sqft | DOM | Units | Dist |
|---|---|---|---|---|---|---|---|---|
| 720 Main St Unit 1ST Plymouth, CT | 4.0 | 1.0 | 1120 | $2,300 | $2.05 | 2d | 1 | 0.49mi |
| 143 Pine Hill Rd Unit 6F Thomaston, CT | 2.0 | 1.5 | 1088 | $1,950 | $1.79 | 2d | 1 | 1.50mi |
Listing history 8 events
-
2026-05-04status Under Contract 630-char remark
-
2026-04-29$120,000 Active 630-char remark
-
2019-02-08soldstatus $47,500 Closed 184-char remark
Show marketing remark (184 chars)
Cape Cod home located on a convenient location. Great property to restore. Great potential that could be well worth the effort. Please review legal description on lot size information.
-
2019-01-16historical 184-char remark
Show marketing remark (184 chars)
Cape Cod home located on a convenient location. Great property to restore. Great potential that could be well worth the effort. Please review legal description on lot size information.
-
2019-01-04historical Under Contract - Continue to Show 184-char remark
Show marketing remark (184 chars)
Cape Cod home located on a convenient location. Great property to restore. Great potential that could be well worth the effort. Please review legal description on lot size information.
-
2019-01-04price $19,400 184-char remark
Show marketing remark (184 chars)
Cape Cod home located on a convenient location. Great property to restore. Great potential that could be well worth the effort. Please review legal description on lot size information.
-
2018-12-10$22,800 Active 184-char remark
Show marketing remark (184 chars)
Cape Cod home located on a convenient location. Great property to restore. Great potential that could be well worth the effort. Please review legal description on lot size information.
-
1999-05-28soldstatus $130,000
ⓘ Source: listings_history table (triggers on properties + properties_extension) + one-shot
backfill from property_details.listing_events for pre-trigger history.
Tax reassessment forecast CT · Partial reset (capped growth)
- Current annual tax
- $4,894 · $408/mo
- Projected year-2 tax
- $4,894 · $408/mo
- Expected delta
- $0/yr ($0/mo · 0.0%)
ⓘ Screening estimate from a state-policy table — verify with the county assessor before closing.
Climate risk First Street
- Flood 1/10 Low FEMA zone X · 0% chance over 30 yrs
- Wildfire 4/10 Moderate
- Heat 4/10 Moderate 7 d/yr ≥96°F today · 15 d/yr by 30 yrs out
- Wind 5/10 Major 26% chance of damaging wind over 30 yrs
- Air quality 2/10 Low 1 unhealthy d/yr today · 1 by 30 yrs out
Nearby sold comps map
Loading sold comps map…
Walkable amenities ~0.75 mi
Loading nearby amenities…
Taxation est. · year 1
- Rental income
- $26,591
- − Mortgage interest
- −$6,722
- − Property taxes
- −$4,894
- − Insurance
- −$600
- − Repairs & maintenance
- −$2,127
- − Management
- −$2,127
- − Depreciation
- −$3,491
- Taxable income
- $6,630
- Est. tax owed @ 24.0%
- −$1,591
- After-tax cash flow
- $6,370/yr
For passive investors: Depreciation is non-cash, so a rental often shows a tax loss while cash-flowing — sheltering income. Rental losses are passive: they offset passive income freely, and up to $25,000/yr can offset ordinary (W-2) income if you actively participate and your MAGI is under $100k (phasing out to $0 by $150k); unused losses carry forward. On sale, claimed depreciation is recaptured at up to 25%, and gains may owe capital-gains tax (a 1031 exchange can defer both). Figures are a year-1 estimate at your 24.0% rate — not tax advice; consult a CPA.
Schools (NCES district)
- District
- Thomaston School District
- NCES district ID
- 0904500
- Math proficiency
- 31% ▼ -10.00%
- Reading proficiency
- 48% ▼ -8.00%
- Median HH income
- $65,757
- Composite
- 35.52/100
- National rank
- #4909
- State rank
- #101 of 153 in CT
Livability — Thomaston
- Score
- 64/100
- State rank
- #127
- US rank
- #14400
Category grades
Schools grade is shown separately in the Schools card above.
Census & demographics
- City population
- 7,493
- Population (ZIP)
- 7,493
Population outlook (Naugatuck Valley County) Hauer SSP2
- By 2040
- 496,846
Race, ethnicity, and origin ACS 2023
- Neighborhood character
- Predominantly White (80%)
- Race & ethnicity
- White 80% Hispanic / Latino 9% Two or more races 8% Black 2% Asian 2%
- Hispanic origin (detail)
- Puerto Rican 7%
- Common ancestry
- Romanian 7% Lithuanian 7% Russian 4%
- Foreign-born
- 5% · Canada, Vietnam
- Languages at home
- 96% English-only · Spanish 2% Other Indo-European 1% Korean 1%
Political lean MEDSL · Naugatuck Valley
- 2024 margin
- Lean R (+7.4) · D 45.6% · R 53.0% · Other 1.4%
- All cycles
- 2024: R+7.4
Not yet ingested
- Civics
- —
Market trends
- HPI YoY
- ▼ -71.78%
- Current HPI
- 192.8437
- Rent YoY
- —
- Metro
- —
- State GDP YoY
- ▲ 1.06%
- F500 in state
- 38
Industry mix (Fortune 500 HQ in CT)
| Industry | F500 HQs | Revenue |
|---|---|---|
| Industrial Machinery | 4 | $38B |
|
||
| Insurance | 3 | $71B |
|
||
| Financial Services | 2 | $25B |
|
||
| Transportation / Logistics | 2 | $18B |
|
||
| Healthcare | 1 | $247B |
|
||
| Telecommunications | 1 | $55B |
|
||
Price history
-7.7% since first listed8 events — show timeline
- 2026-05-04 Pending — Smart MLS
- 2026-04-29 Listed $120,000 Smart MLS
- 2019-02-08 Sold (MLS) $47,500 Smart MLS
- 2019-01-16 Listing Removed — Smart MLS
- 2019-01-04 Contingent — Smart MLS
- 2019-01-04 Price Changed $19,400 Smart MLS
- 2018-12-10 Listed $22,800 Smart MLS
- 1999-05-28 Sold (Public Records) $130,000 Public Records
Property tax history
+2.3%/yrLatest (2023): $4,894 · +6.3% YoY. Source: county tax records.
Cash-flow waterfall
monthlySold comps — $/sqft
last 12 mo · ≤1 miLoading sold comps…