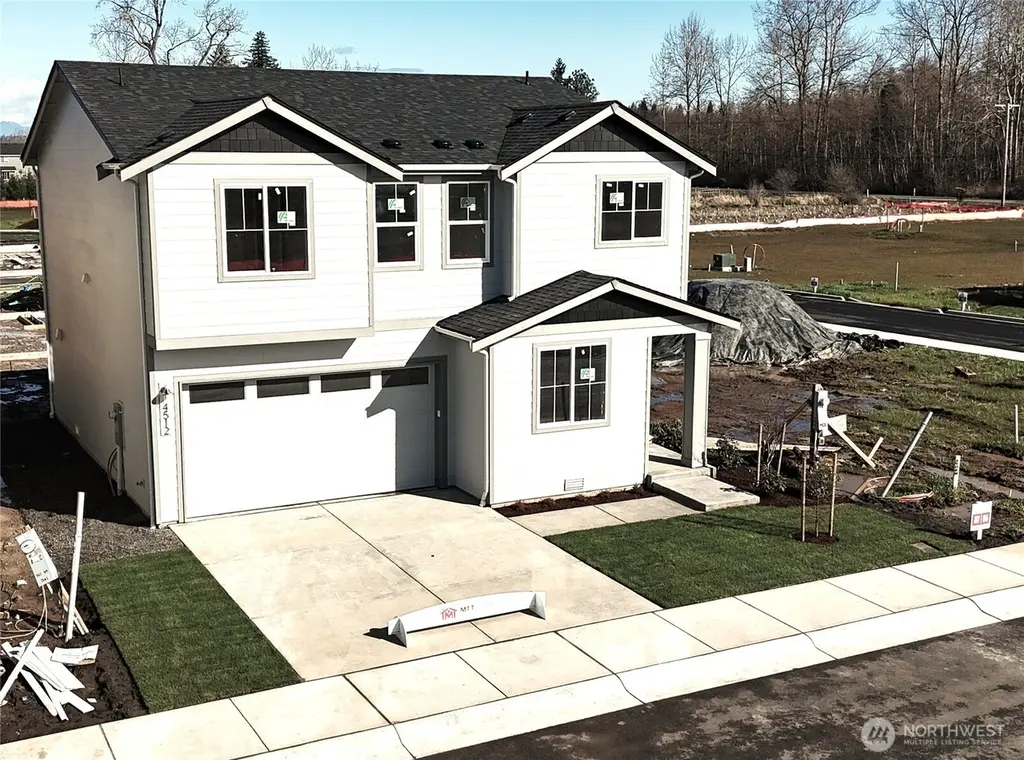
4521 Merlot (Lot 102) St · Birch Bay, WA
Flood risk No data
- FEMA flood zone
- —
- Chance of flooding over 30 yrs
- —
- Est. flood insurance / yr
- —
Fire risk No data
- Est. fire insurance / yr
- —
Heat risk No data
- Hot days now (above threshold)
- —
- Hot days in 30 yrs
- —
Wind risk No data
- Chance of severe wind over 30 yrs
- —
Air-quality risk No data
- Unhealthy air days now
- —
- Unhealthy air days in 30 yrs
- —
Risk factors via First Street. Map © Google.
Why this score? — see what drove the D- grade
The composite is a weighted blend of 9 inputs, each scored 0–100. Each bar is that input's sub-score; the figure is the points it added to the 100-point composite (weight × sub-score).
- Appreciation +10.0/10.0
- ARV discount +7.5/15.0
- Cash flow +4.7/30.0
- Schools +4.7/10.0
- Rent growth +3.3/5.0
- Livability +3.1/5.0
- Condition / age +2.5/5.0
- 1% rule +0.7/10.0
- DSCR +0.0/10.0
$537,950
🖨 Deal sheet (PDF) 📄 Offer letter ✓ Due diligence
Listing remarks
MTT's highly anticipated Grand Opening of Whisper Lake Division II in Birch Bay/Blaine. Great Opportunity for Affordable New Construction home featuring 2064 sq ft plan has 4 Bedrooms 3 baths plus Bonus Room. Great room concept with Island kitchen, stainless appliances, quartz counters with full tile backsplash, walk-in pantry. One bedroom on main with 3/4 bath on main. Large primary bedroom with large shower, bath tub(optional upgrade)and walk-in closet. Full forced air heat and A/C. Great area walking distance to Birch Bay with restaurants and shopping. Great recreation areas are close, marinas, world class crabbing, fishing, boating, fantastic golf, hiking, beach combing are w/ in minute
Key facts
- Quartz counters
- Full tile backsplash
- Island kitchen
Tags
Neighborhood map
What this means for you Summary
Snapshot
- This is a 4-bed/3.0-bath other listed at $538k.
Deal economics
- At list price, monthly cash flow is $-1k ($-16k/yr) — negative.
- To cash-flow at today's rent, offer at most $343k (36.2% below list).
- To meet the 1% rule (rent ≥ 1% of price), the offer needs to be $306k (43.0% below list).
- Recommended offer: $306k (43.0% below list) — sets the bar for 1% rule.
- Cap rate 3.3% vs local median 2.6% in Birch Bay — meaningfully above typical; check what's discounted (condition, days-on-market, listing class) to confirm the premium yield is real.
Location & tenants
- Location reads 62/100 on livability (#406 in WA) — a middle-class / working-renter tenant base. Strengths: housing A; Watch: cost of living D+, health & safety D, amenities F.
- Blaine School District (town): math 49% / reading 55% proficiency, ranked #120 of 291 in WA (top 41%) — acceptable for families but not a draw, mixed tenant base, ~2y average lease.
- Zoned schools: Blaine Elementary School (463 students, 54% FRL); Blaine Middle School (459 students, 54% FRL); Blaine High School (609 students, 46% FRL) — zoned schools average 51% FRL vs 33% district-wide (18 pts higher); higher-poverty schools than district average — tighter screening recommended.
- Market conditions: Rents rising (+3.1%/yr); 461 active listings in the ZIP; 1 comparable units currently listed for rent nearby; solid renter incomes; 1,190 units permitted in Whatcom County in 2024 (327 in 5+ unit buildings).
- This rent runs 42% of the median local income ($87k/yr) — at the standard rent-burdened threshold; future hikes will face affordability resistance.
Forward outlook
- In year one you build about $58k of equity ($4k loan paydown + $54k appreciation (10.0% local appreciation)).
- Whatcom County population projected at +28% by 2050 — long-run rental-demand tailwind backs the buy-and-hold thesis.
- By year 2, paydown + projected appreciation supports a ~$92k cash-out refi (75% LTV) — recoverable capital for the next deal without selling this one.
Negotiation context
- It's been on market 90 days — a 6% lower offer ($506k) is reasonable based on typical stale-listing flexibility.
Questions for the listing agent
- What do current leases actually rent for vs. the listed asking? Can we see a recent rent roll and the last 12 months of T-12 income?
- It's been on market 90 days. Have you received any prior offers? Is the seller open to a 43% concession, seller financing, or rate buy-down credit?
- What does the HOA fee cover, when was the last increase, and are there any pending special assessments or reserve-fund shortfalls?
- Why hasn't it sold? Are there any deal-killer items the seller is aware of (foundation, flood, title, zoning, code violations)?
- Is there a deadline driving the sale (1031 exchange, divorce, estate, relocation)? That informs how much negotiation room exists.
- Schools are F-rated, which usually means shorter tenancies and higher turnover. Who's the typical renter profile here, and what's been the actual vacancy rate?
- The area grade is low — what's the realistic commute time and amenity access for the typical tenant pool here? Any planned neighborhood developments (good or bad) we should know about?
- What's the average days-on-market for RENTAL listings here right now (not sales)? A rising rental-DOM trend means longer vacancies and softer asking-rent achievability than the comps imply.
- What's the recent tenant-quality profile in this submarket — average credit score on applications, eviction rate, late-payment / NSF rate, and stable-employment percentage? A property-management company in the area should have these aggregated.
- How much new for-sale + rental construction is in the pipeline within 1–3 miles? Heavy new supply typically softens prices + rents 12–24 months out; constrained supply supports both.
Investment metrics
- 1% rule
- 0.57% ✗
- Cap rate
- 3.29%
- Cash-on-cash
- -10.73%
- DSCR
- 0.52
- GRM
- 14.6
CMA / ARV
No comps found within radius.
Projected returns pro-forma
10.0% appreciation · 3.1% rent growth · sell at horizon
- IRR
- 16.8%
- Equity multiple
- 2.38×
- Total profit
- $207,582
- Equity at exit
- $484,628
- IRR
- 16.0%
- Equity multiple
- 5.51×
- Total profit
- $679,539
- Equity at exit
- $1,045,119
Cash invested: $150,626 (down + closing). Projections, not guarantees.
Landlord ↔ Tenant lean methodology
- Overall (STATE)
- 28 Tenant-Leaning
- State Washington
- 28 Tenant-Leaning · D+8
- County
- — inherits STATE
- City
- — inherits STATE
ZIP-level market 98230
- Home prices YoY
- 14.0%
- Rents YoY
- 3.1%
- Active inventory
- 461
- Price-to-rent
- 14.6×
Monthly cashflow live
- Estimated rent
- $3,064 medium interval (Pro) →
- Mortgage (P&I)
- −$2,821
- Tax est. 1.5%
- −$672 /mo · $8,069/yr
- Insurance
- −$224
- HOA
- −$50
- Vacancy / Maint / Mgmt
- −$643
- Net cashflow
- $-1,347
Break-even live
Sensitivity live
| Price | -10% $-975 | -5% $-1,161 | +0% $-1,347 | +5% $-1,533 | +10% $-1,719 |
|---|---|---|---|---|---|
| Rent | -10% $-1,589 | -5% $-1,468 | +0% $-1,347 | +5% $-1,226 | +10% $-1,105 |
| Rate | -1.0pp $-1,076 | -0.5pp $-1,210 | base $-1,347 | +0.5pp $-1,486 | +1.0pp $-1,628 |
UW: 25.0% down · 7.5% · 30yr · 1.5% tax · 5.0% vac · 8.0% maint · 8.0% mgmt
Financing live
Cash to close
- Down payment
- $134,488
- Closing costs
- $16,138
- Reserves months
- —
- Total cash needed
- —
Loan-product check · same deal, 3 products live
Conventional
25% down · 7.5% · 30yr
- Down + closing
- —
- Monthly P&I
- —
- Monthly cashflow
- —
- DSCR
- —
- Eligible?
- —
Personal DTI + credit; lowest rate.
DSCR
20% down · 8.5% · 30yr
- Down + closing
- —
- Monthly P&I
- —
- Monthly cashflow
- —
- DSCR
- —
- Eligible?
- —
No personal income docs; deal must DSCR.
Hard money
10% down · 12.0% · 12mo
- Down + closing
- —
- Monthly P&I
- —
- Monthly cashflow
- —
- DSCR
- —
- Eligible?
- —
Short-term bridge; refi at stabilization.
Rent comps 1 comps
| Address | Beds | Baths | Sqft | Rent | $/sqft | DOM | Units | Dist |
|---|---|---|---|---|---|---|---|---|
| 4739 S Golf Course Dr Blaine, WA | 3.0 | 2.5 | 2361 | $3,000 | $1.27 | 15d | 1 | 1.35mi |
HOA detail
- Monthly dues
- $50 · $600/yr
Listing history 3 events
-
2026-05-13status Pending
-
2026-03-19price $537,950
-
2026-02-12$536,950 Active
ⓘ Source: listings_history table (triggers on properties + properties_extension) + one-shot
backfill from property_details.listing_events for pre-trigger history.
Nearby sold comps map
Loading sold comps map…
Walkable amenities ~0.75 mi
Loading nearby amenities…
Taxation est. · year 1
- Rental income
- $36,771
- − Mortgage interest
- −$30,134
- − Property taxes
- −$8,069
- − Insurance
- −$2,690
- − Repairs & maintenance
- −$2,942
- − Management
- −$2,942
- − HOA
- −$600
- − Depreciation
- −$15,649
- Taxable loss
- −$26,254
- Est. tax savings @ 24.0%
- +$6,301
- After-tax cash flow
- $-9,862/yr
For passive investors: Depreciation is non-cash, so a rental often shows a tax loss while cash-flowing — sheltering income. Rental losses are passive: they offset passive income freely, and up to $25,000/yr can offset ordinary (W-2) income if you actively participate and your MAGI is under $100k (phasing out to $0 by $150k); unused losses carry forward. On sale, claimed depreciation is recaptured at up to 25%, and gains may owe capital-gains tax (a 1031 exchange can defer both). Figures are a year-1 estimate at your 24.0% rate — not tax advice; consult a CPA.
Schools (NCES district)
- District
- Blaine School District
- NCES district ID
- 5300570
- Math proficiency
- 49% ▼ -1.00%
- Reading proficiency
- 55% ▼ -2.00%
- Median HH income
- $57,085
- Composite
- 47.05/100
- National rank
- #5128
- State rank
- #120 of 291 in WA
Livability — Birch Bay
- Score
- 62/100
- State rank
- #406
- US rank
- #16180
Category grades
Schools grade is shown separately in the Schools card above.
Census & demographics
- Census place
- Birch Bay, WA
- County
- Whatcom County · 209,776 people
- Metro
- Bellingham, WA
- Population (ZIP)
- 18,744
- Household income
- $86,623
- Rent vs Own
- Severe rent burden
- 454.0
Population outlook (Whatcom County) Hauer SSP2
- Today (2025)
- 240,408 people
- By 2030
- 254,667 · +5.9%
- By 2040
- 281,365 · +17.0%
- By 2050
- 307,592 · +27.9%
- By 2075
- 375,576 · +56.2%
- By 2100
- 421,637 · +75.4%
Race, ethnicity, and origin ACS 2023
- Neighborhood character
- Predominantly White (77%)
- Race & ethnicity
- White 77% Two or more races 11% Hispanic / Latino 9% Asian 3% Pacific Islander 2% Black 1%
- Hispanic origin (detail)
- Mexican 5%
- Common ancestry
- Portuguese 6% Iranian 4% Lithuanian 3%
- Foreign-born
- 13% · Canada, China
- Languages at home
- 89% English-only · Spanish 4% Russian/Polish/Slavic 1% Other Indo-European 1%
Political lean MEDSL · Whatcom
- 2024 margin
- Strong D (+24.9) · D 60.8% · R 35.9% · Other 3.3%
- 2008→2024 swing
- +6.9pp toward D · 2008: 18.0pp · 2024: 24.9pp
- All cycles
- 2024: D+24.9 2020: D+23.9 2016: D+17.7 2012: D+12.1 2008: D+18.0
Not yet ingested
- Civics
- —
Market trends
- HPI YoY
- ▲ 106.58%
- Current HPI
- 868.68
- Rent YoY
- ▲ 3.10%
- Metro
- Bellingham, WA
- State GDP YoY
- ▲ 4.65%
- F500 in state
- 22
Industry mix (Fortune 500 HQ in WA)
| Industry | F500 HQs | Revenue |
|---|---|---|
| Retail | 2 | $269B |
|
||
| Technology / Retail | 1 | $638B |
|
||
| Technology | 1 | $245B |
|
||
| Telecommunications | 1 | $38B |
|
||
| Food / Beverage | 1 | $36B |
|
||
| Automotive / Trucks | 1 | $34B |
|
||
Price history
+0.2% since first listed3 events — show timeline
- 2026-05-13 Pending — NWMLS as Distributed by MLS Grid
- 2026-03-19 Price Changed $537,950 NWMLS as Distributed by MLS Grid
- 2026-02-12 Listed $536,950 NWMLS as Distributed by MLS Grid
Cash-flow waterfall
monthlySold comps — $/sqft
last 12 mo · ≤1 miLoading sold comps…