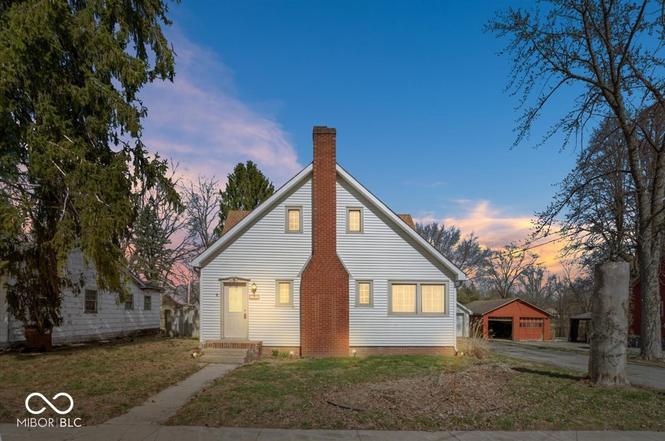
206 E Main St · New Market, IN
Flood risk 1/10 · Minimal
- FEMA flood zone
- X (unshaded)
- Chance of flooding over 30 yrs
- 0.0%
- Est. flood insurance / yr
- $473 – $860
Fire risk 1/10 · Minimal
- Est. fire insurance / yr
- $717 – $1,331
Heat risk 3/10 · Minor
- Hot days now (above 101°F)
- 7 days/yr
- Hot days in 30 yrs
- 18 days/yr
Wind risk 2/10 · Minimal
- Chance of severe wind over 30 yrs
- 1.0%
Air-quality risk 2/10 · Minimal
- Unhealthy air days now
- 1 days/yr
- Unhealthy air days in 30 yrs
- 2 days/yr
Risk factors via First Street. Map © Google.
Why this score? — see what drove the C- grade
The composite is a weighted blend of 9 inputs, each scored 0–100. Each bar is that input's sub-score; the figure is the points it added to the 100-point composite (weight × sub-score).
- ARV discount +14.3/15.0
- Cash flow +12.5/30.0
- Appreciation +5.0/10.0
- Schools +4.4/10.0
- DSCR +3.7/10.0
- Livability +3.3/5.0
- 1% rule +2.7/10.0
- Rent growth +2.5/5.0
- Condition / age +2.5/5.0
$177,900
🖨 Deal sheet (PDF) 📄 Offer letter ✓ Due diligence
Listing remarks MLS
Well maintained 4 bedroom 1.5 bathroom home located in town New Market. This home has ample room for entertainment, and a large backyard for those summer BBQs. New Flooring on the first floor including vinyl and new carpet. Don't miss your chance to see this home.
Key facts
- Sun porch
- Laundry room
- Basement for storage
Tags
Property features AI
Finance
- Other: Lot size approximately 0.2 acres (< 1/4 acre); Basement present — unfinished; Total building area approximately 3,450; living area on main and upper levels approximately 2,432
Exterior
- Parking: Detached 2-car garage (approximately 460 sq ft)
- Utilities: Public water; Municipal sewer connected; Solid waste: no
- Home design: Single-family residence; One and one-half stories; Residential property
- Construction: Vinyl siding; Concrete perimeter foundation
- Exterior features: Exterior is handicap accessible; Porch; Not in a subdivision
Interior
- Kitchen: Gas oven; Dishwasher; Refrigerator
- Bedrooms: Three bedrooms total — one on the main level and two on the upper level; Primary bedroom: see remarks
- Bathrooms: One full bathroom and one half bathroom total; Primary bathroom includes a full tub and a full shower stall
- Heating & cooling: Forced-air heating (natural gas); Central air conditioning; One wood-burning fireplace
- Interior features: Accessible entrance and accessible full bathroom; Storage space in basement; Porch
- Laundry & utility: Laundry room with washer and dryer; Electric water heater
Neighborhood map
What this means for you Summary
Snapshot
- This is a 4-bed/1.5-bath single-family listed at $178k.
Deal economics
- At list price, monthly cash flow is $-27 ($-322/yr) — negative.
- To cash-flow at today's rent, offer at most $173k (2.7% below list).
- To meet the 1% rule (rent ≥ 1% of price), the offer needs to be $137k (23.1% below list).
- Recommended offer: $137k (23.1% below list) — sets the bar for 1% rule.
Location & tenants
- Location reads 66/100 on livability (#297 in IN) — a middle-class / working-renter tenant base. Strengths: cost of living A+, housing A+; Watch: amenities F, commute F, health & safety F.
- South Montgomery Community School Corporation (rural): math 52% / reading 49% proficiency, ranked #46 of 301 in IN (top 15%) — acceptable for families but not a draw, mixed tenant base, ~2y average lease.
- Zoned schools: New Market Elementary School (math 67% / reading 49%, grade C+, #160 of 994 statewide, top 17%, 471 students, 42% FRL); Southmont Jr High School (math 42% / reading 47%, grade D, #84 of 330 statewide, top 26%, 376 students, 40% FRL); Southmont Sr High School (math 32% / reading 62%, grade D-, #143 of 369 statewide, top 44%, 477 students, 39% FRL).
- Market conditions: 4 active listings in the ZIP; 52 units permitted in Montgomery County in 2024 (0 in 5+ unit buildings).
Forward outlook
- In year one you build about $1k of equity ($1k loan paydown + $132 appreciation (0.1% local appreciation)).
- Montgomery County population projected to shrink 9% by 2050 — rents likely to lag national; underwrite the cash flow, not the appreciation.
Negotiation context
- It's been on market 103 days — a 9% lower offer ($162k) is reasonable based on typical stale-listing flexibility.
- 2 sale attempts since 5y ago with the ask held roughly flat each time — persistent listings suggest the price (not the market) is what's stuck; bring a comps-based counter.
- Current owner paid $138k; 29% above their basis — modest negotiation headroom, anchor on the comps not their cost.
Risks & watch-outs
- Watch-outs: built in 1956 — expect roof / HVAC / electrical / plumbing capex.
Questions for the listing agent
- What do current leases actually rent for vs. the listed asking? Can we see a recent rent roll and the last 12 months of T-12 income?
- It's been on market 103 days. Have you received any prior offers? Is the seller open to a 23% concession, seller financing, or rate buy-down credit?
- Built in 1956 — when were the roof, HVAC, electrical panel, plumbing, and water heater last replaced?
- Why hasn't it sold? Are there any deal-killer items the seller is aware of (foundation, flood, title, zoning, code violations)?
- Is there a deadline driving the sale (1031 exchange, divorce, estate, relocation)? That informs how much negotiation room exists.
- Schools are B-rated — typically a magnet for longer-tenancy family renters. What's the average tenant stay here, and is there a school-zone premium baked into asking?
- What's the average days-on-market for RENTAL listings here right now (not sales)? A rising rental-DOM trend means longer vacancies and softer asking-rent achievability than the comps imply.
- What's the recent tenant-quality profile in this submarket — average credit score on applications, eviction rate, late-payment / NSF rate, and stable-employment percentage? A property-management company in the area should have these aggregated.
- How much new for-sale + rental construction is in the pipeline within 1–3 miles? Heavy new supply typically softens prices + rents 12–24 months out; constrained supply supports both.
Investment metrics
- 1% rule
- 0.77% ✗
- Cap rate
- 6.11%
- Cash-on-cash
- -0.65%
- DSCR
- 0.97
- GRM
- 10.8
CMA / ARV
- ARV (on-the-fly)
- $209,328
- Comps found
- 4
Show comp detail 4 sales within ~0.75 mi
| Address | Dist | Beds/Ba | Sqft | Sold | Price | $/sf | Match |
|---|---|---|---|---|---|---|---|
| 106 E Main St | 0.07mi | 5/2.0 (+1) | 2,209 (-11%) | 6mo | $184,900 | $84 | 66 |
| 200 E Pine St | 0.09mi | 4/3.0 | 2,756 (+11%) | 11mo | $229,900 | $83 | 63 |
| 109 S 6th St | 0.37mi | 4/1.0 | 2,272 (-9%) | 19mo | $170,000 | $75 | 50 |
| 125 Circle Dr | 0.19mi | 5/2.5 (+1) | 2,800 (+12%) | 21mo | $499,999 | $179 | 44 |
Match score weights: distance 35% · size 25% · config 20% · recency 20%. Top-matched comps best support the ARV.
Projected returns pro-forma
0.07% appreciation · 3.0% rent growth · sell at horizon
- IRR
- -2.7%
- Equity multiple
- 0.87×
- Total profit
- $-6,346
- Equity at exit
- $52,318
- IRR
- 3.0%
- Equity multiple
- 1.32×
- Total profit
- $16,096
- Equity at exit
- $63,418
Cash invested: $49,812 (down + closing). Projections, not guarantees.
Landlord ↔ Tenant lean methodology
- Overall (STATE)
- 90 Strongly Landlord-Friendly
- State Indiana
- 90 Strongly Landlord-Friendly · R+11
- County
- — inherits STATE
- City
- — inherits STATE
ZIP-level market 47965
- Home prices YoY
- 0.1%
- Active inventory
- 4
- Price-to-rent
- 10.8×
Monthly cashflow live
- Estimated rent
- $1,368 medium interval (Pro) →
- Mortgage (P&I)
- −$933
- Tax from tax record
- −$100 /mo · $1,202/yr
- Insurance
- −$74
- HOA
- −$0
- Vacancy / Maint / Mgmt
- −$287
- Net cashflow
- $-27
Break-even live
Sensitivity live
| Price | -10% $74 | -5% $24 | +0% $-27 | +5% $-77 | +10% $-128 |
|---|---|---|---|---|---|
| Rent | -10% $-135 | -5% $-81 | +0% $-27 | +5% $27 | +10% $81 |
| Rate | -1.0pp $63 | -0.5pp $18 | base $-27 | +0.5pp $-73 | +1.0pp $-120 |
UW: 25.0% down · 7.5% · 30yr · 1.5% tax · 5.0% vac · 8.0% maint · 8.0% mgmt
Financing live
Cash to close
- Down payment
- $44,475
- Closing costs
- $5,337
- Reserves months
- —
- Total cash needed
- —
Loan-product check · same deal, 3 products live
Conventional
25% down · 7.5% · 30yr
- Down + closing
- —
- Monthly P&I
- —
- Monthly cashflow
- —
- DSCR
- —
- Eligible?
- —
Personal DTI + credit; lowest rate.
DSCR
20% down · 8.5% · 30yr
- Down + closing
- —
- Monthly P&I
- —
- Monthly cashflow
- —
- DSCR
- —
- Eligible?
- —
No personal income docs; deal must DSCR.
Hard money
10% down · 12.0% · 12mo
- Down + closing
- —
- Monthly P&I
- —
- Monthly cashflow
- —
- DSCR
- —
- Eligible?
- —
Short-term bridge; refi at stabilization.
Listing history 23 events
-
2026-06-22days on market $177,900 Active 103 DOM
-
2026-06-21days on market $177,900 Active 102 DOM
-
2026-06-19days on market $177,900 Active 100 DOM
-
2026-06-18days on market $177,900 Active 99 DOM
-
2026-06-17days on market $177,900 Active 98 DOM
-
2026-06-16days on market $177,900 Active 97 DOM
-
2026-06-15days on market $177,900 Active 96 DOM
-
2026-06-14days on market $177,900 Active 94 DOM
-
2026-06-12days on market $177,900 Active 93 DOM
-
2026-06-09days on market $177,900 Active 90 DOM
-
2026-06-08days on market $177,900 Active 89 DOM
-
2026-06-07days on market $177,900 Active 88 DOM
-
2026-06-05days on market $177,900 Active 86 DOM
-
2026-06-03days on market $177,900 Active 84 DOM
-
2026-06-02days on market $177,900 Active 83 DOM
-
2026-06-01days on market $177,900 Active 82 DOM
-
2026-05-31days on market $177,900 Active 81 DOM
-
2026-05-30days on market $177,900 Active 80 DOM
-
2026-05-11price $177,900
-
2026-03-29price $179,900
-
2026-03-11$184,900 Active
-
2022-06-10soldstatus $137,500 264-char remark
Show marketing remark (264 chars)
Well maintained 4 bedroom 1.5 bathroom home located in town New Market. This home has ample room for entertainment, and a large backyard for those summer BBQs. New Flooring on the first floor including vinyl and new carpet. Don't miss your chance to see this home.
-
2021-12-20$137,400 264-char remark
Show marketing remark (264 chars)
Well maintained 4 bedroom 1.5 bathroom home located in town New Market. This home has ample room for entertainment, and a large backyard for those summer BBQs. New Flooring on the first floor including vinyl and new carpet. Don't miss your chance to see this home.
ⓘ Source: listings_history table (triggers on properties + properties_extension) + one-shot
backfill from property_details.listing_events for pre-trigger history.
Tax reassessment forecast IN · Partial reset (capped growth)
- Current annual tax
- $1,202 · $100/mo
- Projected year-2 tax
- $1,357 · $113/mo
- Expected delta
- +$155/yr (+$13/mo · 12.9%)
ⓘ Screening estimate from a state-policy table — verify with the county assessor before closing.
Climate risk First Street
- Flood 1/10 Low FEMA zone X (unshaded) · 0% chance over 30 yrs
- Wildfire 1/10 Low
- Heat 3/10 Moderate 7 d/yr ≥101°F today · 18 d/yr by 30 yrs out
- Wind 2/10 Low 100% chance of damaging wind over 30 yrs
- Air quality 2/10 Low 1 unhealthy d/yr today · 2 by 30 yrs out
Nearby sold comps map
Loading sold comps map…
Walkable amenities ~0.75 mi
Loading nearby amenities…
Taxation est. · year 1
- Rental income
- $16,411
- − Mortgage interest
- −$9,965
- − Property taxes
- −$1,202
- − Insurance
- −$890
- − Repairs & maintenance
- −$1,313
- − Management
- −$1,313
- − Depreciation
- −$5,175
- Taxable loss
- −$3,447
- Est. tax savings @ 24.0%
- +$827
- After-tax cash flow
- $505/yr
For passive investors: Depreciation is non-cash, so a rental often shows a tax loss while cash-flowing — sheltering income. Rental losses are passive: they offset passive income freely, and up to $25,000/yr can offset ordinary (W-2) income if you actively participate and your MAGI is under $100k (phasing out to $0 by $150k); unused losses carry forward. On sale, claimed depreciation is recaptured at up to 25%, and gains may owe capital-gains tax (a 1031 exchange can defer both). Figures are a year-1 estimate at your 24.0% rate — not tax advice; consult a CPA.
Schools (NCES district)
- District
- South Montgomery Community School Corporation
- NCES district ID
- 1810450
- Math proficiency
- 52% ▼ -3.00%
- Reading proficiency
- 49% ▼ -4.00%
- Median HH income
- $55,952
- Composite
- 43.79/100
- National rank
- #2935
- State rank
- #46 of 301 in IN
Livability — New Market
- Score
- 66/100
- State rank
- #297
- US rank
- #11953
Category grades
Schools grade is shown separately in the Schools card above.
Census & demographics
- Census place
- New Market, IN
- City population
- 550
- Population (ZIP)
- 550
Population outlook (Montgomery County) Hauer SSP2
- Today (2025)
- 37,893 people
- By 2030
- 37,539 · -0.9%
- By 2040
- 36,536 · -3.6%
- By 2050
- 34,454 · -9.1%
- By 2075
- 28,852 · -23.9%
- By 2100
- 21,145 · -44.2%
Race, ethnicity, and origin ACS 2023
- Neighborhood character
- Predominantly White (97%)
- Race & ethnicity
- White 97% Hispanic / Latino 2% Two or more races 1%
- Common ancestry
- Romanian 2% Portuguese 1% Serbian 1%
- Foreign-born
- 0%
Political lean MEDSL · Montgomery
- 2024 margin
- Solid R (+48.2) · D 24.9% · R 73.2% · Other 1.9%
- 2008→2024 swing
- -28.3pp toward R · 2008: -19.9pp · 2024: -48.2pp
- All cycles
- 2024: R+48.2 2020: R+49.1 2016: R+50.9 2012: R+38.5 2008: R+19.9
Not yet ingested
- Civics
- —
Market trends
- HPI YoY
- ▲ 0.07%
- Current HPI
- 111.399
- Rent YoY
- —
- Metro
- —
- State GDP YoY
- ▲ 2.90%
- F500 in state
- 18
Industry mix (Fortune 500 HQ in IN)
| Industry | F500 HQs | Revenue |
|---|---|---|
| Industrial Machinery | 2 | $37B |
|
||
| Healthcare | 1 | $177B |
|
||
| Pharmaceuticals | 1 | $45B |
|
||
| Metals / Steel | 1 | $18B |
|
||
| Agriculture | 1 | $17B |
|
||
| Packaging | 1 | $12B |
|
||
Price history
+29.5% since first listed5 events — show timeline
- 2026-05-11 Price Changed $177,900 MIBOR as Distributed by MLS Grid
- 2026-03-29 Price Changed $179,900 MIBOR as Distributed by MLS Grid
- 2026-03-11 Listed $184,900 MIBOR as Distributed by MLS Grid
- 2022-06-10 Sold (MLS) $137,500 IRMLS
- 2021-12-20 Listed $137,400 IRMLS
Property tax history
+15.9%/yrLatest (2025): $1,202 · +5.1% YoY. Source: county tax records.
Cash-flow waterfall
monthlySold comps — $/sqft
last 12 mo · ≤1 miLoading sold comps…