32806 Westwood Square West Dr · The Woodlands, TX
Flood risk 1/10 · Minimal
- FEMA flood zone
- X (unshaded)
- Chance of flooding over 30 yrs
- 0.0%
- Est. flood insurance / yr
- $507 – $1,088
Fire risk 3/10 · Minor
- Est. fire insurance / yr
- $1,222 – $2,270
Heat risk 8/10 · Major
- Hot days now (above 111°F)
- 7 days/yr
- Hot days in 30 yrs
- 24 days/yr
Wind risk 8/10 · Major
- Chance of severe wind over 30 yrs
- 99.0%
Air-quality risk 2/10 · Minimal
- Unhealthy air days now
- 2 days/yr
- Unhealthy air days in 30 yrs
- 2 days/yr
Risk factors via First Street. Map © Google.
Why this score? — see what drove the D grade
The composite is a weighted blend of 9 inputs, each scored 0–100. Each bar is that input's sub-score; the figure is the points it added to the 100-point composite (weight × sub-score).
- ARV discount +15.0/15.0
- Appreciation +10.0/10.0
- Livability +4.5/5.0
- Schools +3.9/10.0
- Cash flow +3.3/30.0
- Rent growth +2.6/5.0
- Condition / age +2.5/5.0
- 1% rule +0.5/10.0
- DSCR +0.0/10.0
$430,000
🖨 Deal sheet (PDF) 📄 Offer letter ✓ Due diligence
Listing remarks
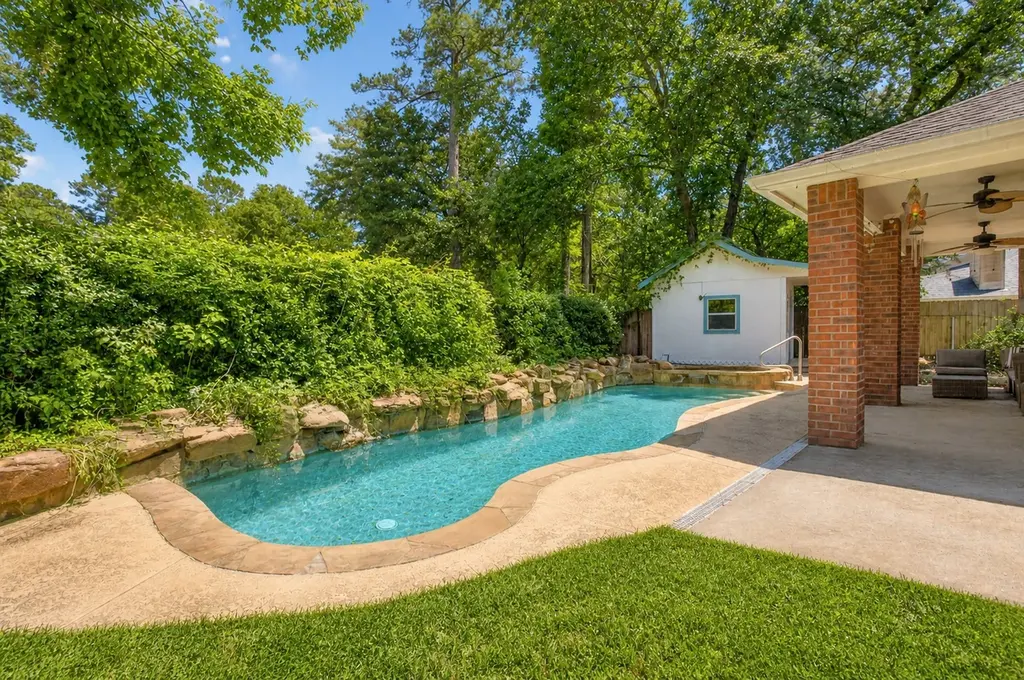
* * POOL/ SPA * * * 1.5 STORY * * * FLEX ROOM * * SUNROOM * * OVERSIZED LOT * * * HOME OFFICE * * Welcome to this beautifully designed home in Magnolia offering comfort, space & thoughtful features throughout! Open-concept layout w/ plantation shutters on every window & a spacious living area that flows into a gourmet kitchen featuring granite countertops, oversized island & abundant storage. All bedrooms located on the first floor, including a versatile flex room ideal as a 4th bedroom or home office. Downstairs game room provides additional space for fun or relaxation. Enjoy the bright sunroom overlooking the backyard oasis. Step outside to an oversized lot fe
Key facts
- Spa
- Sunroom
- Pool
Tags
Property features AI
Finance
- Financial info: Lease considered
- HOA & community: Westwood Landowners' Association; Annual association fee of $207
Exterior
- Parking: Attached carport; Additional parking; Driveway; Carport with 2 spaces
- Utilities: Public water; Aerobic septic
- Home design: Residential property; Faces west; Built in 2000; Slab foundation
- Construction: Brick construction; Composition roof
- Exterior features: Covered patio; Covered deck; Patio; Private yard; Fenced backyard; Hot tub / spa; In-ground heated gunite pool
Interior
- Kitchen: Dishwasher; Electric oven; Electric range / free-standing range; Microwave; Oven; Granite counters
- Bedrooms: Primary bedroom on the first floor (19x12); Bedroom on the first floor (14x11); Bedroom on the first floor (14x11); Four bedrooms possible total; Bonus room on the second floor (15x14); Bonus room on the first floor (14x13); Bonus room on the first floor (18x18)
- Flooring: Engineered hardwood; Tile
- Bathrooms: 2 full bathrooms; 1 half bathroom
- Heating & cooling: Central heating (electric); Central air (electric); Programmable thermostat
- Interior features: Crown molding; Granite counters; Window treatments / coverings; Ceiling fan(s); Programmable thermostat
- Laundry & utility: Washer hookup; Electric dryer hookup
Neighborhood map
What this means for you Summary
Snapshot
- This is a 3-bed/2.5-bath single-family listed at $430k.
Deal economics
- At list price, monthly cash flow is $-1k ($-16k/yr) — negative.
- To cash-flow at today's rent, offer at most $193k (55.2% below list).
- To meet the 1% rule (rent ≥ 1% of price), the offer needs to be $235k (45.3% below list).
- Recommended offer: $193k (55.2% below list) — sets the bar for cash-flow.
Location & tenants
- Location reads 91/100 on livability (#1 in TX, #47 nationally) — a professional / high-income tenant draw. Strengths: amenities A+, commute A+, employment A+; Watch: cost of living D-.
- Magnolia ISD (rural): math 42% / reading 45% proficiency, ranked #247 of 826 in TX (top 30%) — families likely to look elsewhere, expect single-tenant / working-renter base with shorter leases.
- Zoned schools: Bear Branch El (math 48% / reading 51%, grade D, #865 of 4,322 statewide, top 21%, 579 students, 28% FRL); Bear Branch J H (math 44% / reading 46%, grade D, #479 of 1,662 statewide, top 29%, 1,076 students, 37% FRL); Magnolia H S (math 47% / reading 62%, grade C-, #379 of 1,632 statewide, top 26%, 2,248 students, 31% FRL).
- Market conditions: Rents flat; 1622 active listings in the ZIP; 1 comparable units currently listed for rent nearby; high-income renter base; 13,259 units permitted in Montgomery County in 2024 (1,402 in 5+ unit buildings).
Forward outlook
- In year one you build about $46k of equity ($3k loan paydown + $43k appreciation (10.0% local appreciation)).
- Montgomery County population projected at +65% by 2050 — long-run rental-demand tailwind backs the buy-and-hold thesis.
- By year 2, paydown + projected appreciation supports a ~$74k cash-out refi (75% LTV) — recoverable capital for the next deal without selling this one.
Negotiation context
- It's been on market 37 days — a 3% lower offer ($417k) is reasonable based on typical stale-listing flexibility.
- 13 sale attempts since 12y ago with the ask held roughly flat each time — persistent listings suggest the price (not the market) is what's stuck; bring a comps-based counter.
Risks & watch-outs
- Climate carrying-cost: severe wind risk, 99% chance of damaging wind over 30y; extreme-heat days projected 7→24/yr by 2055 (HVAC capex compounding) — expect insurance premiums to compound above CPI over the hold.
Questions for the listing agent
- What do current leases actually rent for vs. the listed asking? Can we see a recent rent roll and the last 12 months of T-12 income?
- It's been on market 37 days. Have you received any prior offers? Is the seller open to a 55% concession, seller financing, or rate buy-down credit?
- What does the HOA fee cover, when was the last increase, and are there any pending special assessments or reserve-fund shortfalls?
- Is there a deadline driving the sale (1031 exchange, divorce, estate, relocation)? That informs how much negotiation room exists.
- Schools are A-rated — typically a magnet for longer-tenancy family renters. What's the average tenant stay here, and is there a school-zone premium baked into asking?
- The area grade is low — what's the realistic commute time and amenity access for the typical tenant pool here? Any planned neighborhood developments (good or bad) we should know about?
- What's the average days-on-market for RENTAL listings here right now (not sales)? A rising rental-DOM trend means longer vacancies and softer asking-rent achievability than the comps imply.
- What's the recent tenant-quality profile in this submarket — average credit score on applications, eviction rate, late-payment / NSF rate, and stable-employment percentage? A property-management company in the area should have these aggregated.
- How much new for-sale + rental construction is in the pipeline within 1–3 miles? Heavy new supply typically softens prices + rents 12–24 months out; constrained supply supports both.
Investment metrics
- 1% rule
- 0.55% ✗
- Cap rate
- 2.54%
- Cash-on-cash
- -13.39%
- DSCR
- 0.40
- GRM
- 15.2
CMA / ARV
- ARV (median comp)
- $538,767
- List price
- $430,000
- Delta
- -20.19%
- Verdict
- UNDERPRICED
- Comps
- 20 within 1.0 mi
Show comp detail 10 sales within ~0.75 mi
| Address | Dist | Beds/Ba | Sqft | Sold | Price | $/sf | Match |
|---|---|---|---|---|---|---|---|
| 7102 Black Forest Dr | 0.36mi | 3/3.0 | 3,579 (-0%) | 9mo | $685,000 | $191 | 73 |
| 7402 Charred Pine Dr | 0.57mi | 4/3.5 (+1) | 3,444 (-4%) | 0mo | $510,000 | $148 | 57 |
| 32610 Riverwood Dr | 0.19mi | 4/3.5 (+1) | 3,208 (-10%) | 12mo | $549,000 | $171 | 55 |
| 32119 Damon Ct | 0.69mi | 4/4.5 (+1) | 3,400 (-5%) | 3mo | $790,000 | $232 | 44 |
| 87 S Bluff Creek Cir | 0.59mi | 4/3.0 (+1) | 3,212 (-10%) | 12mo | $775,000 | $241 | 38 |
| 135 S Bluff Creek Cir | 0.61mi | 4/3.5 (+1) | 3,135 (-13%) | 4mo | $635,000 | $203 | 38 |
| 7003 Black Forest Dr | 0.35mi | 4/3.5 (+1) | 3,105 (-13%) | 20mo | $720,000 | $232 | 35 |
| 126 S Bluff Creek Cir | 0.59mi | 4/3.5 (+1) | 3,112 (-13%) | 11mo | $750,000 | $241 | 33 |
| 114 S Bluff Creek Cir | 0.59mi | 4/3.5 (+1) | 3,060 (-15%) | 14mo | $650,000 | $212 | 27 |
| 78 N Westwinds Cir | 0.73mi | 4/3.5 (+1) | 3,225 (-10%) | 24mo | $630,000 | $195 | 20 |
Match score weights: distance 35% · size 25% · config 20% · recency 20%. Top-matched comps best support the ARV.
Projected returns pro-forma
10.0% appreciation · 0.32% rent growth · sell at horizon
- IRR
- 14.4%
- Equity multiple
- 2.18×
- Total profit
- $142,642
- Equity at exit
- $387,378
- IRR
- 13.9%
- Equity multiple
- 4.96×
- Total profit
- $476,462
- Equity at exit
- $835,395
Cash invested: $120,400 (down + closing). Projections, not guarantees.
Landlord ↔ Tenant lean methodology
- Overall (STATE)
- 87 Strongly Landlord-Friendly
- State Texas
- 87 Strongly Landlord-Friendly · R+5
- County
- — inherits STATE
- City
- — inherits STATE
ZIP-level market 77354
- Home prices YoY
- 2.4%
- Rents YoY
- 0.3%
- Active inventory
- 1622
- Price-to-rent
- 15.2×
Monthly cashflow live
- Estimated rent
- $2,353 medium interval (Pro) →
- Mortgage (P&I)
- −$2,255
- Tax from tax record
- −$751 /mo · $9,015/yr
- Insurance
- −$179
- HOA
- −$17
- Vacancy / Maint / Mgmt
- −$494
- Net cashflow
- $-1,343
Break-even live
Sensitivity live
| Price | -10% $-1,100 | -5% $-1,221 | +0% $-1,343 | +5% $-1,465 | +10% $-1,587 |
|---|---|---|---|---|---|
| Rent | -10% $-1,529 | -5% $-1,436 | +0% $-1,343 | +5% $-1,250 | +10% $-1,157 |
| Rate | -1.0pp $-1,127 | -0.5pp $-1,234 | base $-1,343 | +0.5pp $-1,455 | +1.0pp $-1,568 |
UW: 25.0% down · 7.5% · 30yr · 1.5% tax · 5.0% vac · 8.0% maint · 8.0% mgmt
Financing live
Cash to close
- Down payment
- $107,500
- Closing costs
- $12,900
- Reserves months
- —
- Total cash needed
- —
Loan-product check · same deal, 3 products live
Conventional
25% down · 7.5% · 30yr
- Down + closing
- —
- Monthly P&I
- —
- Monthly cashflow
- —
- DSCR
- —
- Eligible?
- —
Personal DTI + credit; lowest rate.
DSCR
20% down · 8.5% · 30yr
- Down + closing
- —
- Monthly P&I
- —
- Monthly cashflow
- —
- DSCR
- —
- Eligible?
- —
No personal income docs; deal must DSCR.
Hard money
10% down · 12.0% · 12mo
- Down + closing
- —
- Monthly P&I
- —
- Monthly cashflow
- —
- DSCR
- —
- Eligible?
- —
Short-term bridge; refi at stabilization.
Rent comps 1 comps
| Address | Beds | Baths | Sqft | Rent | $/sqft | DOM | Units | Dist |
|---|---|---|---|---|---|---|---|---|
| 3969 Eagle Nest Lake Ln Magnolia, TX | 3.0 | 2.5 | 2986 | $2,895 | $0.97 | 14d | 1 | 1.35mi |
HOA detail
- Monthly dues
- $17 · $204/yr
- Likely covers
- pool
Listing history 50 events
-
2026-06-09days on market $430,000 Pending 37 DOM
-
2026-06-08days on market $430,000 Pending 36 DOM
-
2026-06-07days on market $430,000 Pending 35 DOM
-
2026-06-04days on market $430,000 Pending 32 DOM
-
2026-06-03statusdays on market $430,000 Pending 31 DOM
-
2026-06-02days on market $430,000 Active 30 DOM
-
2026-06-01days on market $430,000 Active 29 DOM
-
2026-05-31days on market $430,000 Active 28 DOM
-
2026-05-03$430,000 Active 705-char remark
-
2025-08-04historical
-
2025-07-28status Active
-
2025-07-19historical
-
2025-07-11$499,000 Active
-
2025-07-11historical
-
2025-06-25price $499,000
-
2025-06-04$525,000 Active
-
2025-06-02historical
-
2022-02-23soldstatus
-
2022-02-22soldstatus Sold
-
2022-01-31status Pending
-
2022-01-24status Option Pending
-
2022-01-21$465,900 Active
-
2018-08-22soldstatus
-
2018-08-17soldstatus Sold
-
2018-07-28status Pending
-
2018-07-25status Option Pending
-
2018-07-24status Pending
-
2018-07-13status Option Pending
-
2018-06-17price $295,000
-
2018-06-07status Active
-
2018-06-02status Pending
-
2018-05-21status Option Pending
-
2018-03-15$299,000 Active
-
2018-01-15historical
-
2017-11-16status Active
-
2017-11-09status Pending
-
2017-11-04status Option Pending
-
2017-10-03price $328,000
-
2017-08-07price $339,000
-
2017-07-10price $349,000
-
2017-04-04price $356,954
-
2017-03-10$369,900 Active
-
2016-09-12historical
-
2016-01-29$379,000 Active
-
2016-01-29historical
-
2015-09-17$384,000 Active
-
2015-08-01historical
-
2015-01-27$384,999 Active
-
2015-01-20historical
-
2014-11-21price $389,900
ⓘ Source: listings_history table (triggers on properties + properties_extension) + one-shot
backfill from property_details.listing_events for pre-trigger history.
Tax reassessment forecast TX · Resets to sale price
- Current annual tax
- $9,015 · $751/mo
- Projected year-2 tax
- $9,015 · $751/mo
- Expected delta
- $0/yr ($0/mo · 0.0%)
ⓘ Screening estimate from a state-policy table — verify with the county assessor before closing.
Climate risk First Street
- Flood 1/10 Low FEMA zone X (unshaded) · 0% chance over 30 yrs
- Wildfire 3/10 Moderate
- Heat 8/10 Severe 7 d/yr ≥111°F today · 24 d/yr by 30 yrs out
- Wind 8/10 Severe 99% chance of damaging wind over 30 yrs
- Air quality 2/10 Low 2 unhealthy d/yr today · 2 by 30 yrs out
Nearby sold comps map
Loading sold comps map…
Walkable amenities ~0.75 mi
Loading nearby amenities…
Taxation est. · year 1
- Rental income
- $28,242
- − Mortgage interest
- −$24,087
- − Property taxes
- −$9,015
- − Insurance
- −$2,150
- − Repairs & maintenance
- −$2,259
- − Management
- −$2,259
- − HOA
- −$204
- − Depreciation
- −$12,509
- Taxable loss
- −$24,242
- Est. tax savings @ 24.0%
- +$5,818
- After-tax cash flow
- $-10,299/yr
For passive investors: Depreciation is non-cash, so a rental often shows a tax loss while cash-flowing — sheltering income. Rental losses are passive: they offset passive income freely, and up to $25,000/yr can offset ordinary (W-2) income if you actively participate and your MAGI is under $100k (phasing out to $0 by $150k); unused losses carry forward. On sale, claimed depreciation is recaptured at up to 25%, and gains may owe capital-gains tax (a 1031 exchange can defer both). Figures are a year-1 estimate at your 24.0% rate — not tax advice; consult a CPA.
Schools (NCES district)
- District
- Magnolia ISD
- NCES district ID
- 4828740
- Math proficiency
- 42% ▼ -7.00%
- Reading proficiency
- 45% ▼ -4.00%
- Median HH income
- $71,692
- Composite
- 39.46/100
- National rank
- #3958
- State rank
- #247 of 826 in TX
Livability — The Woodlands
- Score
- 91/100
- State rank
- #1
- US rank
- #47
Category grades
Schools grade is shown separately in the Schools card above.
Census & demographics
- County
- Montgomery County · 663,713 people
- Metro
- Houston-The Woodlands-Sugar Land, TX
- Population (ZIP)
- 44,900
- Household income
- $112,504
- Rent vs Own
- Severe rent burden
- 586.0
Population outlook (Montgomery County) Hauer SSP2
- Today (2025)
- 713,896 people
- By 2030
- 805,263 · +12.8%
- By 2040
- 992,708 · +39.1%
- By 2050
- 1,179,590 · +65.2%
- By 2075
- 1,628,084 · +128.1%
- By 2100
- 1,937,880 · +171.5%
Race, ethnicity, and origin ACS 2023
- Neighborhood character
- Predominantly White (66%)
- Race & ethnicity
- White 66% Hispanic / Latino 25% Two or more races 18% Black 3% Asian 1%
- Hispanic origin (detail)
- Mexican 14% Puerto Rican 1%
- Common ancestry
- Lithuanian 4% Slovak 2% Italian 2%
- Foreign-born
- 11% · Canada, Vietnam
- Languages at home
- 83% English-only · Spanish 15% Other Indo-European 1% German/W. Germanic 1%
Political lean MEDSL · Montgomery
- 2024 margin
- Solid R (+45.5) · D 26.8% · R 72.3%
- 2008→2024 swing
- +7.2pp toward D · 2008: -52.7pp · 2024: -45.5pp
- All cycles
- 2024: R+45.5 2020: R+43.8 2016: R+51.4 2012: R+60.7 2008: R+52.7
Not yet ingested
- Civics
- —
Market trends
- HPI YoY
- ▲ 12.09%
- Current HPI
- 512.87
- Rent YoY
- ▲ 0.32%
- Metro
- Houston-The Woodlands-Sugar Land, TX
- State GDP YoY
- ▲ 3.95%
- F500 in state
- 110
Industry mix (Fortune 500 HQ in TX)
| Industry | F500 HQs | Revenue |
|---|---|---|
| Energy | 16 | $1,198B |
|
||
| Technology | 5 | $198B |
|
||
| Engineering / Construction | 4 | $72B |
|
||
| Energy Services | 3 | $60B |
|
||
| Utilities | 3 | $41B |
|
||
| Healthcare | 2 | $330B |
|
||
Price history
-5.6% since first listed46 events — show timeline
- 2026-06-10 Pending — HARMLS
- 2026-06-03 Pending — HARMLS
- 2026-05-03 Listed $430,000 HARMLS
- 2025-08-04 Listing Removed — HARMLS
- 2025-07-28 Relisted — HARMLS
- 2025-07-19 Listing Removed — HARMLS
- 2025-07-11 Listing Removed — HARMLS
- 2025-07-11 Listed $499,000 HARMLS
- 2025-06-25 Price Changed $499,000 HARMLS
- 2025-06-04 Listed $525,000 HARMLS
- 2025-06-02 Coming Soon — HARMLS
- 2022-02-23 Sold (Public Records) — Public Records
- 2022-02-22 Sold (MLS) — HARMLS
- 2022-01-31 Pending — HARMLS
- 2022-01-24 Pending — HARMLS
- 2022-01-21 Listed $465,900 HARMLS
- 2018-08-22 Sold (Public Records) — Public Records
- 2018-08-17 Sold (MLS) — HARMLS
- 2018-07-28 Pending — HARMLS
- 2018-07-25 Pending — HARMLS
- 2018-07-24 Pending — HARMLS
- 2018-07-13 Pending — HARMLS
- 2018-06-17 Price Changed $295,000 HARMLS
- 2018-06-07 Relisted — HARMLS
- 2018-06-02 Pending — HARMLS
- 2018-05-21 Pending — HARMLS
- 2018-03-15 Listed $299,000 HARMLS
- 2018-01-15 Listing Removed — HARMLS
- 2017-11-16 Relisted — HARMLS
- 2017-11-09 Pending — HARMLS
- 2017-11-04 Pending — HARMLS
- 2017-10-03 Price Changed $328,000 HARMLS
- 2017-08-07 Price Changed $339,000 HARMLS
- 2017-07-10 Price Changed $349,000 HARMLS
- 2017-04-04 Price Changed $356,954 HARMLS
- 2017-03-10 Listed $369,900 HARMLS
- 2016-09-12 Listing Removed — HARMLS
- 2016-01-29 Listed $379,000 HARMLS
- 2016-01-29 Listing Removed — HARMLS
- 2015-09-17 Listed $384,000 HARMLS
- 2015-08-01 Listing Removed — HARMLS
- 2015-01-27 Listed $384,999 HARMLS
- 2015-01-20 Listing Removed — HARMLS
- 2014-11-21 Price Changed $389,900 HARMLS
- 2014-07-15 Price Changed $399,900 HARMLS
- 2014-07-09 Listed $455,295 HARMLS
Property tax history
+4.1%/yrLatest (2025): $9,015 · +1.8% YoY. Source: county tax records.
Cash-flow waterfall
monthlySold comps — $/sqft
last 12 mo · ≤1 miLoading sold comps…