2213 NE 1st Ct #203 · Boynton Beach, FL
Flood risk 1/10 · Minimal
- FEMA flood zone
- X (unshaded)
- Chance of flooding over 30 yrs
- 0.0%
- Est. flood insurance / yr
- $507 – $1,088
Fire risk 1/10 · Minimal
- Est. fire insurance / yr
- $947 – $1,759
Heat risk 10/10 · Severe
- Hot days now (above 105°F)
- 7 days/yr
- Hot days in 30 yrs
- 26 days/yr
Wind risk 10/10 · Severe
- Chance of severe wind over 30 yrs
- 99.0%
Air-quality risk 2/10 · Minimal
- Unhealthy air days now
- 1 days/yr
- Unhealthy air days in 30 yrs
- 2 days/yr
Risk factors via First Street. Map © Google.
Why this score? — see what drove the C grade
The composite is a weighted blend of 9 inputs, each scored 0–100. Each bar is that input's sub-score; the figure is the points it added to the 100-point composite (weight × sub-score).
- Cash flow +19.3/30.0
- 1% rule +10.0/10.0
- ARV discount +7.5/15.0
- DSCR +6.1/10.0
- Schools +4.3/10.0
- Livability +3.6/5.0
- Rent growth +3.4/5.0
- Condition / age +2.5/5.0
- Appreciation +0.0/10.0
$94,900
🖨 Deal sheet 📄 Offer letter ✓ Due diligence
Listing remarks
Beautiful 1-bedroom, 1-bath apartment in a desirable 55+ Boynton Beach community, just minutes from the beach. Located on the second floor, this well-maintained unit includes 1 assigned parking space. Building recently painted with resurfaced catwalks and stairs. Currently rented through February 2027, great investment opportunity. Showings by appointment only. Please do not disturb tenant. Call listing agent with 24-hour notice to request a showing.
Key facts
- $535 HOA
- Parking
- Community pool
Property features AI
Finance
- Other: Association-managed pool
- Financial info: Pets not allowed / pet restrictions apply
- HOA & community: Monthly association fee; Association fee covers common areas, cable TV, laundry, grounds maintenance, structure maintenance, recreation facilities, sewer, trash, and water; Association amenities include clubhouse, pool, billiard room, laundry, library, barbecue, and picnic area; Community is a senior community
Exterior
- Parking: Assigned parking; Guest parking; Open parking (one space)
- Security: Smoke detector(s)
- Utilities: Has cooling; Has heating
- Home design: 2-story building; Property is attached; Entry on level 2
- Construction: Block construction; Effective year built
- Exterior features: Courtyard; TV antenna; Association pool
Interior
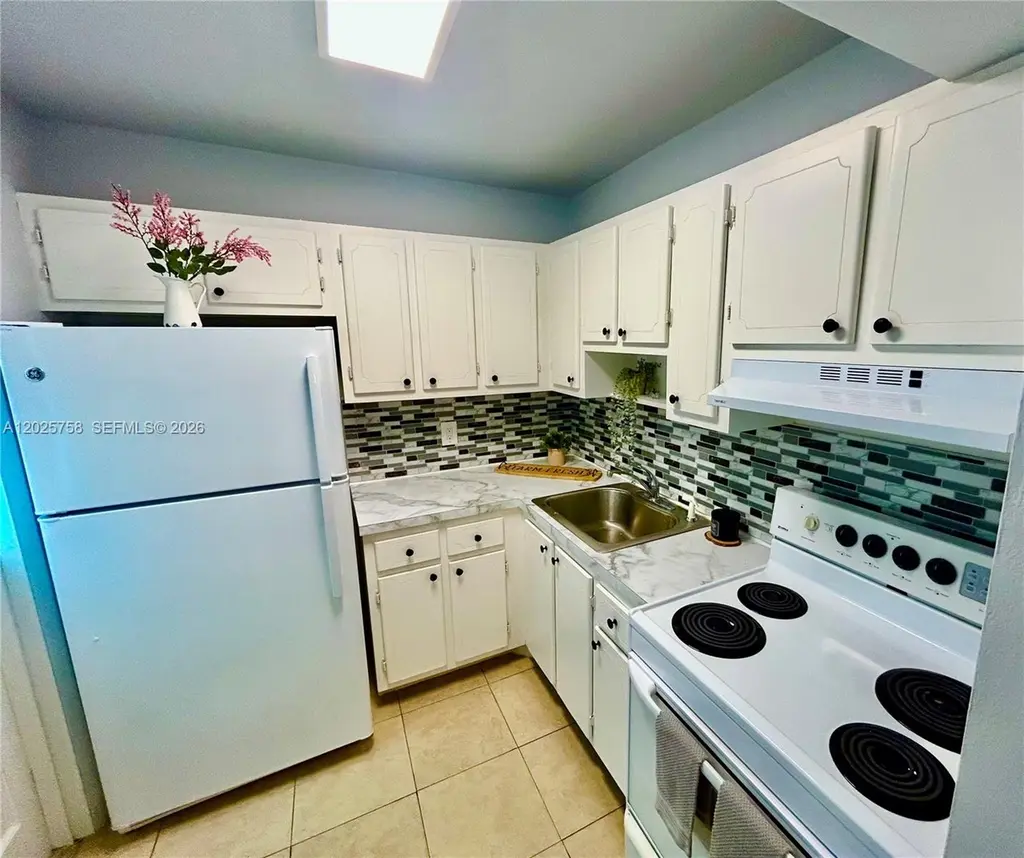
- Kitchen: Electric range; Refrigerator
- Bedrooms: Bedroom located on the main level
- Flooring: Ceramic tile
- Bathrooms: 1 full bathroom; 1 half bathroom
- Heating & cooling: Central air (electric); Electric heating
- Interior features: Bedroom on main level; Second-floor entry; Family room
- Laundry & utility: Laundry in common area; Electric water heater
Neighborhood map
What this means for you Summary
Snapshot
- This is a 1-bed/1.5-bath condo listed at $95k.
Deal economics
- At list price, monthly cash flow is $104 ($1k/yr) — positive.
- The deal already cash-flows at list — no discount required.
- Meets the 1% rule at list price ($2k rent vs $95k).
- Recommended offer: $93k (1.5% below list) — sets the bar for market timing.
- Cap rate 7.6% vs local median 4.3% in Boynton Beach — top-decile yield for the area; either an underpriced asset or a hidden risk that comps aren't pricing in. Stress-test before assuming the spread holds.
Location & tenants
- Location reads 72/100 on livability (#351 in FL) — a middle-class / working-renter tenant base. Strengths: housing A+, health & safety B+, cost of living B; Watch: amenities D+, crime D-, commute F.
- Palm Beach (suburban): math 46% / reading 53% proficiency, ranked #34 of 73 in FL (top 47%) — families likely to look elsewhere, expect single-tenant / working-renter base with shorter leases.
- Market conditions: Rents rising (+3.6%/yr); 536 active listings in the ZIP; 18 comparable units currently listed for rent nearby; rentals at typical pace (median 24d on market — plan ~3-4 weeks tenant-placement turnaround); 3,974 units permitted in Palm Beach County in 2024 (1,012 in 5+ unit buildings).
Forward outlook
- Local home prices are declining (-3.0%/yr); year-one equity from $656 of loan paydown is wiped out by about $3k of value loss. Plan a longer hold.
- Palm Beach County population projected at +30% by 2050 — long-run rental-demand tailwind backs the buy-and-hold thesis.
Negotiation context
- It's been on market 23 days — a 2% lower offer ($93k) is reasonable based on typical stale-listing flexibility.
- 9 sale attempts since 21y ago with the ask held roughly flat each time — persistent listings suggest the price (not the market) is what's stuck; bring a comps-based counter.
Risks & watch-outs
- Watch-outs: HOA is 32% of rent.
- Climate carrying-cost: severe wind risk, 99% chance of damaging wind over 30y; extreme-heat days projected 7→26/yr by 2055 (HVAC capex compounding) — expect insurance premiums to compound above CPI over the hold.
Questions for the listing agent
- Built in 1970 — when were the roof, HVAC, electrical panel, plumbing, and water heater last replaced?
- What does the HOA fee cover, when was the last increase, and are there any pending special assessments or reserve-fund shortfalls?
- Any open or pending special assessments — roof, HVAC, plumbing, elevator, façade? What's the per-unit balance and payoff schedule, and is the seller paying it off at close or rolling it to the buyer?
- Is there a deadline driving the sale (1031 exchange, divorce, estate, relocation)? That informs how much negotiation room exists.
- Crime grade is D in this area — have there been break-ins, vandalism, or insurance claims at this property in the last 3 years? What carrier currently insures it and at what premium?
- What's the average days-on-market for RENTAL listings here right now (not sales)? A rising rental-DOM trend means longer vacancies and softer asking-rent achievability than the comps imply.
- What's the recent tenant-quality profile in this submarket — average credit score on applications, eviction rate, late-payment / NSF rate, and stable-employment percentage? A property-management company in the area should have these aggregated.
- How much new apartment / multifamily construction is in the pipeline within 1–3 miles? Heavy new supply (>2% of stock underway) typically softens rents 12–24 months out; light construction supports rent growth.
Investment metrics
- 1% rule
- 1.75% ✓
- Cap rate
- 7.61%
- Cash-on-cash
- 4.69%
- DSCR
- 1.21
- GRM
- 4.7
CMA / ARV
No comps found within radius.
Projected returns pro-forma
-3.0% appreciation · 3.64% rent growth · sell at horizon
- IRR
- -7.3%
- Equity multiple
- 0.72×
- Total profit
- $-7,312
- Equity at exit
- $14,150
- IRR
- 4.0%
- Equity multiple
- 1.31×
- Total profit
- $8,133
- Equity at exit
- $8,205
Cash invested: $26,572 (down + closing). Projections, not guarantees.
Landlord ↔ Tenant lean methodology
- Overall (STATE)
- 87 Strongly Landlord-Friendly
- State Florida
- 87 Strongly Landlord-Friendly · R+3
- County
- — inherits STATE
- City
- — inherits STATE
ZIP-level market 33435
- Rents YoY
- 3.6%
- Active inventory
- 536
- Price-to-rent
- 4.7×
Monthly cashflow live
- Estimated rent
- $1,665 high interval (Pro) →
- Mortgage (P&I)
- −$498
- Tax from tax record
- −$139 /mo · $1,670/yr
- Insurance
- −$40
- HOA
- −$535
- Vacancy / Maint / Mgmt
- −$350
- Net cashflow
- $104
Break-even live
UW: 25.0% down · 7.5% · 30yr · 1.5% tax · 5.0% vac · 8.0% maint · 8.0% mgmt
Financing live
Cash to close
- Down payment
- $23,725
- Closing costs
- $2,847
- Reserves months
- —
- Total cash needed
- —
Loan-product check · same deal, 3 products live
Conventional
25% down · 7.5% · 30yr
- Down + closing
- —
- Monthly P&I
- —
- Monthly cashflow
- —
- DSCR
- —
- Eligible?
- —
Personal DTI + credit; lowest rate.
DSCR
20% down · 8.5% · 30yr
- Down + closing
- —
- Monthly P&I
- —
- Monthly cashflow
- —
- DSCR
- —
- Eligible?
- —
No personal income docs; deal must DSCR.
Hard money
10% down · 12.0% · 12mo
- Down + closing
- —
- Monthly P&I
- —
- Monthly cashflow
- —
- DSCR
- —
- Eligible?
- —
Short-term bridge; refi at stabilization.
Rent comps 18 comps
| Address | Beds | Baths | Sqft | Rent | $/sqft | DOM | Units | Dist |
|---|---|---|---|---|---|---|---|---|
| 2213 NE 1st Ct #103 Boynton Beach, FL | 1.0 | 1.5 | 624 | $1,350 | $2.16 | 24d | 1 | 0.03mi |
| 977 Miner Rd Lantana, FL | 1.0 | 1.0 | 500 | $1,995 | $3.99 | 24d | 1 | 0.64mi |
| 977 Miner Rd Unit 9 Hypoluxo, FL | 1.0 | 1.0 | 500 | $1,995 | $3.99 | 1d | 1 | 0.67mi |
| 7871 Terrace Rd Unit A Lantana, FL | 1.0 | 1.0 | 470 | $1,500 | $3.19 | 24d | 1 | 0.77mi |
| 7871 Terrace Rd Unit B Lantana, FL | 1.0 | 1.0 | 470 | $1,600 | $3.40 | 7d | 1 | 0.77mi |
| 7871 Terrace Rd Unit B Lantana, FL | 1.0 | 1.0 | 470 | $1,600 | $3.40 | 15d | 1 | 0.77mi |
| 408 NW 13th Ave Unit 2 Boynton Beach, FL | 1.0 | 1.0 | 400 | $1,375 | $3.44 | 24d | 1 | 0.87mi |
| 430 NW 12th Ave Unit A Boynton Beach, FL | 1.0 | 1.0 | 500 | $2,195 | $4.39 | 24d | 1 | 0.94mi |
| 25 S Loafing St Unit 25 Hypoluxo, FL | 2.0 | 1.0 | 552 | $1,500 | $2.72 | 2d | 1 | 0.95mi |
| 25 S Loafing St Unit 25 Hypoluxo, FL | 2.0 | 1.0 | 552 | $1,500 | $2.72 | 24d | 1 | 0.95mi |
| 22 S Loafing St Hypoluxo, FL | 2.0 | 1.0 | 696 | $1,300 | $1.87 | 24d | 1 | 0.95mi |
| 656 Manor Dr Unit 3 Boynton Beach, FL | — | 1.0 | 650 | $1,600 | $2.46 | 21d | 1 | 1.01mi |
| 717 NE 10th Ave Unit 6 Boynton Beach, FL | 1.0 | 1.0 | 700 | $1,600 | $2.29 | 7d | 1 | 1.09mi |
| 615 NE 7th Ave Boynton Beach, FL | 1.0 | 1.0 | 698 | $1,699 | $2.43 | 17d | 1 | 1.20mi |
| 689 NE 6th Ct #404 Boynton Beach, FL | 1.0 | 1.0 | 703 | $2,000 | $2.84 | 24d | 1 | 1.32mi |
| 689 NE 6th Ct #4070 Boynton Beach, FL | 1.0 | 1.0 | 703 | $1,900 | $2.70 | 17d | 1 | 1.32mi |
| 518 NE 4th St Unit A Boynton Beach, FL | 1.0 | 1.0 | 500 | $1,700 | $3.40 | 15d | 1 | 1.33mi |
| 400 N Federal Hwy Unit N304 Boynton Beach, FL | 1.0 | 1.0 | 640 | $2,400 | $3.75 | 24d | 1 | 1.44mi |
HOA detail condo
- Monthly dues
- $535 · $6,420/yr
- Likely covers
- parking
- Assessments
- None detected in remarks — confirm with the listing agent.
Listing history 43 events
-
2026-06-18days on market $94,900 Active 23 DOM
-
2026-06-17days on market $94,900 Active 22 DOM
-
2026-06-16days on market $94,900 Active 21 DOM
-
2026-06-15days on market $94,900 Active 20 DOM
-
2026-06-13days on market $94,900 Active 18 DOM
-
2026-06-10price $94,900 Active 14 DOM
-
2026-06-09days on market $97,900 Active 14 DOM
-
2026-06-08days on market $97,900 Active 13 DOM
-
2026-06-07days on market $97,900 Active 12 DOM
-
2026-06-04days on market $97,900 Active 9 DOM
-
2026-06-03days on market $97,900 Active 8 DOM
-
2026-06-02days on market $97,900 Active 7 DOM
-
2026-06-01days on market $97,900 Active 6 DOM
-
2026-05-31days on market $97,900 Active 5 DOM
-
2026-05-25$97,900 Active
-
2026-05-14historical
-
2026-03-03historical $1,275
-
2026-01-31$1,275
-
2026-01-07historical $1,200
-
2025-12-27price $1,200
-
2025-12-26price $100,999
-
2025-11-18$1,275
-
2025-11-16$104,999 Active
-
2025-10-11historical $1,400
-
2025-10-11historical
-
2025-07-20price $1,400
-
2025-05-07$1,500
-
2025-05-06$110,000 Active
-
2025-04-25historical $1,400
-
2025-02-14price $1,400
-
2024-10-27$1,450
-
2023-07-14soldstatus $92,000
-
2023-06-16soldstatus $92,000 Closed
-
2023-06-01status Pending
-
2023-05-09historical Active Under Contract
-
2023-03-30price $100,000
-
2023-03-23$110,000 Active
-
2005-04-27soldstatus $65,000
-
2005-04-04soldstatus $65,000
-
2005-03-22historical
-
2005-02-01$69,900
-
2004-03-01soldstatus $43,000
-
1996-03-18soldstatus $20,000
ⓘ Source: listings_history table (triggers on properties + properties_extension) + one-shot
backfill from property_details.listing_events for pre-trigger history.
Tax reassessment forecast FL · Resets to sale price
- Current annual tax
- $1,670 · $139/mo
- Projected year-2 tax
- $1,670 · $139/mo
- Expected delta
- $0/yr ($0/mo · 0.0%)
ⓘ Screening estimate from a state-policy table — verify with the county assessor before closing.
Climate risk First Street
- Flood 1/10 Low FEMA zone X (unshaded) · 0% chance over 30 yrs
- Wildfire 1/10 Low
- Heat 10/10 Extreme 7 d/yr ≥105°F today · 26 d/yr by 30 yrs out
- Wind 10/10 Extreme 99% chance of damaging wind over 30 yrs
- Air quality 2/10 Low 1 unhealthy d/yr today · 2 by 30 yrs out
Nearby sold comps map
Loading sold comps map…
Walkable amenities ~0.75 mi
Loading nearby amenities…
Taxation est. · year 1
- Rental income
- $19,980
- − Mortgage interest
- −$5,316
- − Property taxes
- −$1,670
- − Insurance
- −$474
- − Repairs & maintenance
- −$1,598
- − Management
- −$1,598
- − HOA
- −$6,420
- − Depreciation
- −$2,761
- Taxable income
- $142
- Est. tax owed @ 24.0%
- −$34
- After-tax cash flow
- $1,213/yr
For passive investors: Depreciation is non-cash, so a rental often shows a tax loss while cash-flowing — sheltering income. Rental losses are passive: they offset passive income freely, and up to $25,000/yr can offset ordinary (W-2) income if you actively participate and your MAGI is under $100k (phasing out to $0 by $150k); unused losses carry forward. On sale, claimed depreciation is recaptured at up to 25%, and gains may owe capital-gains tax (a 1031 exchange can defer both). Figures are a year-1 estimate at your 24.0% rate — not tax advice; consult a CPA.
Schools (NCES district)
- District
- Palm Beach
- NCES district ID
- 1201500
- Math proficiency
- 46% ▼ -16.00%
- Reading proficiency
- 53% ▼ -4.00%
- Median HH income
- $53,943
- Composite
- 42.72/100
- National rank
- #3160
- State rank
- #34 of 73 in FL
Livability — Boynton Beach
- Score
- 72/100
- State rank
- #351
- US rank
- #6098
Category grades
Schools grade is shown separately in the Schools card above.
Census & demographics
- Census place
- Boynton Beach, FL
- County
- Palm Beach County · 1,438,312 people
- City population
- 148,060
- Metro
- Miami-Fort Lauderdale-Pompano Beach, FL
- Population (ZIP)
- 37,833
- Household income
- $67,979
- Rent vs Own
- Severe rent burden
- 1623.0
Population outlook (Palm Beach County) Hauer SSP2
- Today (2025)
- 1,637,487 people
- By 2030
- 1,743,255 · +6.5%
- By 2040
- 1,948,712 · +19.0%
- By 2050
- 2,132,979 · +30.3%
- By 2075
- 2,530,027 · +54.5%
- By 2100
- 2,706,979 · +65.3%
Race, ethnicity, and origin ACS 2023
- Neighborhood character
- Diverse neighborhood (Simpson 0.65)
- Race & ethnicity
- White 41% Black 40% Hispanic / Latino 15% Two or more races 10%
- Hispanic origin (detail)
- Mexican 3% Puerto Rican 3% Cuban 2% Dominican 1%
- Common ancestry
- Hispanic 23% Romanian 2% Lithuanian 2%
- Foreign-born
- 30% · Canada, Jamaica
- Languages at home
- 61% English-only · French/Haitian/Cajun 24% Spanish 11% Other Indo-European 2%
Political lean MEDSL · Palm Beach
- 2024 margin
- Toss-up / Even · D 50.0% · R 49.2%
- 2008→2024 swing
- -22.1pp toward R · 2008: 22.9pp · 2024: 0.8pp
- All cycles
- 2024: D+0.8 2020: D+12.8 2016: D+15.3 2012: D+17.0 2008: D+22.9
Not yet ingested
- Civics
- —
Market trends
- HPI YoY
- ▼ -345.86%
- Current HPI
- 371.0527
- Rent YoY
- ▲ 3.64%
- Metro
- Miami-Fort Lauderdale-Pompano Beach, FL
- State GDP YoY
- ▲ 3.28%
- F500 in state
- 36
Industry mix (Fortune 500 HQ in FL)
| Industry | F500 HQs | Revenue |
|---|---|---|
| Industrial Technology | 2 | $29B |
|
||
| Insurance | 2 | $17B |
|
||
| Retail | 1 | $60B |
|
||
| Technology Distribution | 1 | $58B |
|
||
| Homebuilding | 1 | $35B |
|
||
| Technology Manufacturing | 1 | $35B |
|
||
Price history
+389.5% since first listed29 events — show timeline
- 2026-05-25 Listed $97,900 MARMLS
- 2026-05-14 Listing Removed — MARMLS
- 2026-03-03 Rental Removed $1,275 MARMLS
- 2026-01-31 Listed for Rent $1,275 MARMLS
- 2026-01-07 Rental Removed $1,200 MARMLS
- 2025-12-27 Price Changed $1,200 MARMLS
- 2025-12-26 Price Changed $100,999 MARMLS
- 2025-11-18 Listed for Rent $1,275 MARMLS
- 2025-11-16 Listed $104,999 MARMLS
- 2025-10-11 Rental Removed $1,400 GFLMLS
- 2025-10-11 Listing Removed — Beaches MLS
- 2025-07-20 Price Changed $1,400 GFLMLS
- 2025-05-07 Listed for Rent $1,500 GFLMLS
- 2025-05-06 Listed $110,000 Beaches MLS
- 2025-04-25 Rental Removed $1,400 GFLMLS
- 2025-02-14 Price Changed $1,400 GFLMLS
- 2024-10-27 Listed for Rent $1,450 GFLMLS
- 2023-07-14 Sold (Public Records) $92,000 Public Records
- 2023-06-16 Sold (MLS) $92,000 Beaches MLS
- 2023-06-01 Pending — Beaches MLS
- 2023-05-09 Contingent — Beaches MLS
- 2023-03-30 Price Changed $100,000 Beaches MLS
- 2023-03-23 Listed $110,000 Beaches MLS
- 2005-04-27 Sold (Public Records) $65,000 Public Records
- 2005-04-04 Sold (MLS) $65,000 Beaches MLS
- 2005-03-22 Listing Removed — Beaches MLS
- 2005-02-01 Listed $69,900 Beaches MLS
- 2004-03-01 Sold (Public Records) $43,000 Public Records
- 1996-03-18 Sold (Public Records) $20,000 Public Records
Property tax history
+7.4%/yrLatest (2025): $1,670 · -19.2% YoY. Source: county tax records.
Cash-flow waterfall
monthlySold comps — $/sqft
last 12 mo · ≤1 miLoading sold comps…