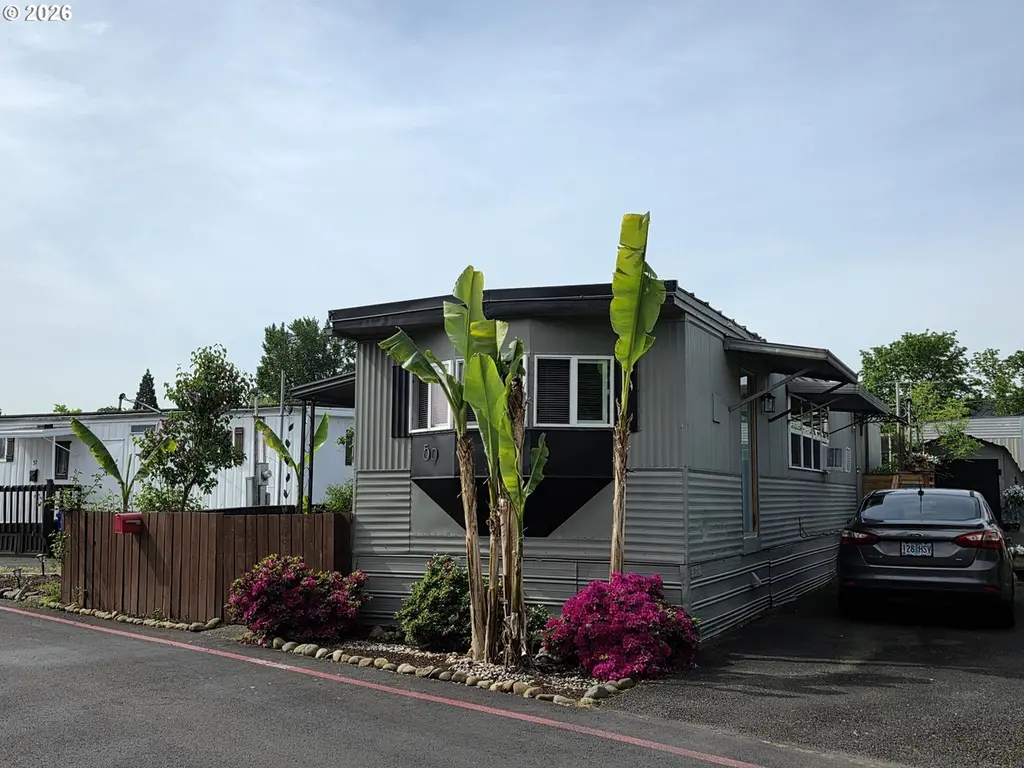
19605 River Rd #59 · Gladstone, OR
Flood risk 6/10 · Moderate
- FEMA flood zone
- X (shaded)
- Chance of flooding over 30 yrs
- 0.52%
- Est. flood insurance / yr
- $507 – $1,088
Fire risk 2/10 · Minimal
- Est. fire insurance / yr
- $498 – $926
Heat risk 3/10 · Minor
- Hot days now (above 94°F)
- 7 days/yr
- Hot days in 30 yrs
- 16 days/yr
Wind risk 1/10 · Minimal
- Chance of severe wind over 30 yrs
- —
Air-quality risk 10/10 · Severe
- Unhealthy air days now
- 18 days/yr
- Unhealthy air days in 30 yrs
- 20 days/yr
Risk factors via First Street. Map © Google.
Why this score? — see what drove the B- grade
The composite is a weighted blend of 9 inputs, each scored 0–100. Each bar is that input's sub-score; the figure is the points it added to the 100-point composite (weight × sub-score).
- Cash flow +30.0/30.0
- 1% rule +10.0/10.0
- DSCR +10.0/10.0
- Schools +6.4/10.0
- Livability +4.5/5.0
- Rent growth +2.7/5.0
- ARV discount +2.5/15.0
- Condition / age +2.5/5.0
- Appreciation +0.0/10.0
$78,500
🖨 Deal sheet 📄 Offer letter ✓ Due diligence
Listing remarks
Stylish, contemporary, and delightfully eclectic, this inviting home offers comfort, character, and thoughtful updates throughout. Step outside to a fabulous, fenced yard featuring a curated mix of plants and just enough lawn to stay low-maintenance, plus a spacious covered patio—perfect for relaxing on warm summer evenings. Inside, the beautifully updated kitchen shines with shaker-style cabinetry, butcher block countertops, stainless steel appliances, updated lighting, and abundant storage. A moveable island adds flexibility for cooking and entertaining. The dining area and large living room are filled with soft, filtered natural light, complemented by tasteful décor and acce
Key facts
- Built 1967
- Listed 26 days
Property features AI
Finance
- Other: Park home public remarks note a senior cooperative with clubhouse, pool, and proximity to a local park
- Financial info: Lot rent $630 monthly
- HOA & community: Located in TWO RIVERS park; Senior community with clubhouse and pool; Land lease present (monthly lot rent of $630); Land lease expires December 31, 2028
Exterior
- Parking: Driveway
- Security: No specific security features listed
- Utilities: Public water; Public sewer; Electricity (fuel and hot water); Cable internet available
- Home design: Manufactured home in a park; Residential property, not attached; Updated/remodeled; Single-story (main level living); Built in 1967; Skirting foundation
- Construction: Metal roof; Metal siding; Skirting foundation; Year built 1967
- Exterior features: Covered deck; Fenced yard; Level lot; Paved road access; Metal siding
Interior
- Kitchen: Free-standing range; Free-standing refrigerator; Island
- Bedrooms: Primary bedroom on main level; Second bedroom
- Flooring: Luxury vinyl plank
- Bathrooms: One full bathroom (main level)
- Heating & cooling: Forced air heating; Window air conditioning unit(s)
- Interior features: Accessible with minimal steps; Laundry area; Luxury vinyl plank flooring; Washer and dryer included; Double-pane windows with vinyl frames; Crawl space basement
- Laundry & utility: Washer and dryer included; Electric hot water
Neighborhood map
What this means for you Summary
Snapshot
- This is a 2-bed/1.0-bath other listed at $78k.
Deal economics
- At list price, monthly cash flow is $795 ($10k/yr) — positive.
- The deal already cash-flows at list — no discount required.
- Meets the 1% rule at list price ($2k rent vs $78k).
- Recommended offer: $77k (1.5% below list) — sets the bar for market timing.
- Cap rate 18.4% vs local median 2.9% in Gladstone — top-decile yield for the area; either an underpriced asset or a hidden risk that comps aren't pricing in. Stress-test before assuming the spread holds.
Location & tenants
- Location reads 89/100 on livability (#7 in OR, #168 nationally) — a professional / high-income tenant draw. Strengths: amenities A+, commute A+, housing A+; Watch: cost of living D-.
- Gladstone SD 115 (suburban): math 75% / reading 75% proficiency, ranked #2 of 58 in OR (top 3%) — strong family-tenant draw, lease renewals of 3-5y typical.
- Zoned schools: John Wetten Elementary School (574 students, 42% FRL); Walter L Kraxberger Middle School (373 students, 39% FRL); Gladstone High School (594 students, 35% FRL) — zoned schools at 38% FRL track the district average.
- Market conditions: Rents flat; 43 active listings in the ZIP; 7 comparable units currently listed for rent nearby; rentals at typical pace (median 15d on market — plan ~3-4 weeks tenant-placement turnaround); 43% of comp listings sitting > 30 days — soft ceiling on asking rent; solid renter incomes; 946 units permitted in Clackamas County in 2024 (188 in 5+ unit buildings).
Forward outlook
- Local home prices are declining (-3.0%/yr); year-one equity from $543 of loan paydown is wiped out by about $2k of value loss. Plan a longer hold.
- Clackamas County population projected at +25% by 2050 — long-run rental-demand tailwind backs the buy-and-hold thesis.
- At projected returns (-3.0% appreciation + 0.6% rent growth), your $22k cash investment doubles in ~3 years — after that, you're playing with house money.
Negotiation context
- It's been on market 26 days — a 2% lower offer ($77k) is reasonable based on typical stale-listing flexibility.
Risks & watch-outs
- Climate carrying-cost: major flood risk — expect insurance premiums to compound above CPI over the hold.
Questions for the listing agent
- Built in 1967 — when were the roof, HVAC, electrical panel, plumbing, and water heater last replaced?
- Is there a deadline driving the sale (1031 exchange, divorce, estate, relocation)? That informs how much negotiation room exists.
- What's the average days-on-market for RENTAL listings here right now (not sales)? A rising rental-DOM trend means longer vacancies and softer asking-rent achievability than the comps imply.
- What's the recent tenant-quality profile in this submarket — average credit score on applications, eviction rate, late-payment / NSF rate, and stable-employment percentage? A property-management company in the area should have these aggregated.
- How much new for-sale + rental construction is in the pipeline within 1–3 miles? Heavy new supply typically softens prices + rents 12–24 months out; constrained supply supports both.
Investment metrics
- 1% rule
- 2.16% ✓
- Cap rate
- 18.44%
- Cash-on-cash
- 43.38%
- DSCR
- 2.93
- GRM
- 3.9
CMA / ARV
- ARV (median comp)
- $70,675
- List price
- $78,500
- Delta
- 11.07%
- Verdict
- OVERPRICED
- Comps
- 12 within 1.0 mi
Projected returns pro-forma
-3.0% appreciation · 0.62% rent growth · sell at horizon
- IRR
- 37.5%
- Equity multiple
- 2.54×
- Total profit
- $33,957
- Equity at exit
- $11,705
- IRR
- 42.9%
- Equity multiple
- 4.61×
- Total profit
- $79,353
- Equity at exit
- $6,787
Cash invested: $21,980 (down + closing). Projections, not guarantees.
Landlord ↔ Tenant lean methodology
- Overall (STATE)
- 28 Tenant-Leaning
- State Oregon
- 28 Tenant-Leaning · D+6
- County
- — inherits STATE
- City
- — inherits STATE
ZIP-level market 97027
- Rents YoY
- 0.6%
- Active inventory
- 43
- Price-to-rent
- 3.9×
Monthly cashflow live
- Estimated rent
- $1,693 high interval (Pro) →
- Mortgage (P&I)
- −$412
- Tax est. 1.5%
- −$98 /mo · $1,178/yr
- Insurance
- −$33
- HOA
- −$0
- Vacancy / Maint / Mgmt
- −$355
- Net cashflow
- $795
Break-even live
UW: 25.0% down · 7.5% · 30yr · 1.5% tax · 5.0% vac · 8.0% maint · 8.0% mgmt
Financing live
Cash to close
- Down payment
- $19,625
- Closing costs
- $2,355
- Reserves months
- —
- Total cash needed
- —
Loan-product check · same deal, 3 products live
Conventional
25% down · 7.5% · 30yr
- Down + closing
- —
- Monthly P&I
- —
- Monthly cashflow
- —
- DSCR
- —
- Eligible?
- —
Personal DTI + credit; lowest rate.
DSCR
20% down · 8.5% · 30yr
- Down + closing
- —
- Monthly P&I
- —
- Monthly cashflow
- —
- DSCR
- —
- Eligible?
- —
No personal income docs; deal must DSCR.
Hard money
10% down · 12.0% · 12mo
- Down + closing
- —
- Monthly P&I
- —
- Monthly cashflow
- —
- DSCR
- —
- Eligible?
- —
Short-term bridge; refi at stabilization.
Rent comps 7 comps
| Address | Beds | Baths | Sqft | Rent | $/sqft | DOM | Units | Dist |
|---|---|---|---|---|---|---|---|---|
| 458 W Berkeley St Gladstone, OR | 1.0 | 1.0 | 400 | $1,300 | $3.25 | 43d | 1 | 0.33mi |
| 4900 SE Meldrum Ave Unit B Milwaukie, OR | 1.0 | 1.0 | 750 | $1,695 | $2.26 | 43d | 1 | 0.50mi |
| 1937 Main St Oregon City, OR | 1.0–3.0 | 1.0–2.0 | 1187 | $2,380 | $2.00 | 1d | 19 | 0.77mi |
| 5200 SE Jennings Ave Portland, OR | 1.0 | 1.0 | 423 | $1,497 | $3.54 | 3d | 2 | 0.94mi |
| 911 15th St Apt 6 Oregon City, OR | 1.0 | 1.0 | 580 | $1,375 | $2.37 | 15d | 1 | 1.31mi |
| 911 15th St Apt 19 Oregon City, OR | 1.0 | 1.0 | 580 | $1,425 | $2.46 | 43d | 1 | 1.31mi |
| 18181 Webster Rd Gladstone, OR | 3.0 | 1.0–2.0 | 771 | $2,072 | $2.69 | 7d | 11 | 1.39mi |
Listing history 4 events
-
2026-06-02status $78,500 Pending 26 DOM
-
2026-06-01days on market $78,500 Active 26 DOM
-
2026-05-31days on market $78,500 Active 25 DOM
-
2026-05-06$78,500 Active 1422-char remark
ⓘ Source: listings_history table (triggers on properties + properties_extension) + one-shot
backfill from property_details.listing_events for pre-trigger history.
Climate risk First Street
- Flood 6/10 Major FEMA zone X (shaded) · 52% chance over 30 yrs
- Wildfire 2/10 Low
- Heat 3/10 Moderate 7 d/yr ≥94°F today · 16 d/yr by 30 yrs out
- Wind 1/10 Low
- Air quality 10/10 Extreme 18 unhealthy d/yr today · 20 by 30 yrs out
Nearby sold comps map
Loading sold comps map…
Walkable amenities ~0.75 mi
Loading nearby amenities…
Taxation est. · year 1
- Rental income
- $20,311
- − Mortgage interest
- −$4,397
- − Property taxes
- −$1,178
- − Insurance
- −$392
- − Repairs & maintenance
- −$1,625
- − Management
- −$1,625
- − Depreciation
- −$2,284
- Taxable income
- $8,810
- Est. tax owed @ 24.0%
- −$2,114
- After-tax cash flow
- $7,421/yr
For passive investors: Depreciation is non-cash, so a rental often shows a tax loss while cash-flowing — sheltering income. Rental losses are passive: they offset passive income freely, and up to $25,000/yr can offset ordinary (W-2) income if you actively participate and your MAGI is under $100k (phasing out to $0 by $150k); unused losses carry forward. On sale, claimed depreciation is recaptured at up to 25%, and gains may owe capital-gains tax (a 1031 exchange can defer both). Figures are a year-1 estimate at your 24.0% rate — not tax advice; consult a CPA.
Schools (NCES district)
- District
- Gladstone SD 115
- NCES district ID
- 4105610
- Math proficiency
- 75% ▲ 40.00%
- Reading proficiency
- 75% ▲ 21.00%
- Median HH income
- $53,736
- Composite
- 63.88/100
- National rank
- #589
- State rank
- #2 of 58 in OR
Livability — Gladstone
- Score
- 89/100
- State rank
- #7
- US rank
- #168
Category grades
Schools grade is shown separately in the Schools card above.
Census & demographics
- Census place
- Gladstone, OR
- County
- Clackamas County · 361,406 people
- City population
- 12,347
- Metro
- Portland-Vancouver-Hillsboro, OR-WA
- Population (ZIP)
- 12,347
- Household income
- $94,375
- Rent vs Own
- Severe rent burden
- 494.0
Population outlook (Clackamas County) Hauer SSP2
- Today (2025)
- 458,456 people
- By 2030
- 485,185 · +5.8%
- By 2040
- 532,932 · +16.2%
- By 2050
- 574,445 · +25.3%
- By 2075
- 665,497 · +45.2%
- By 2100
- 697,488 · +52.1%
Race, ethnicity, and origin ACS 2023
- Neighborhood character
- Predominantly White (78%)
- Race & ethnicity
- White 78% Two or more races 13% Hispanic / Latino 9% Black 2% Asian 2% Native American 1%
- Hispanic origin (detail)
- Mexican 7%
- Common ancestry
- Italian 4% Lithuanian 3% Portuguese 2%
- Foreign-born
- 6% · Canada, South Korea
- Languages at home
- 94% English-only · Spanish 5% Tagalog/Filipino 1%
Political lean MEDSL · Clackamas
- 2024 margin
- Lean D (+9.7) · D 53.4% · R 43.6% · Other 3.0%
- 2008→2024 swing
- -0.6pp no change · 2008: 10.4pp · 2024: 9.7pp
- All cycles
- 2024: D+9.7 2020: D+11.1 2016: D+6.1 2012: D+3.5 2008: D+10.4
Not yet ingested
- Civics
- —
Market trends
- HPI YoY
- ▼ -332.75%
- Current HPI
- 313.7905
- Rent YoY
- ▲ 0.62%
- Metro
- Portland-Vancouver-Hillsboro, OR-WA
- State GDP YoY
- ▲ 2.05%
- F500 in state
- 2
Industry mix (Fortune 500 HQ in OR)
| Industry | F500 HQs | Revenue |
|---|---|---|
| Consumer Goods | 1 | $51B |
|
||
Price history
2 events — show timeline
- 2026-06-01 Pending — RMLS
- 2026-05-06 Listed $78,500 RMLS
Property tax history
-4.9%/yrLatest (2018): $51 · +14.3% YoY. Source: county tax records.
Cash-flow waterfall
monthlySold comps — $/sqft
last 12 mo · ≤1 miLoading sold comps…