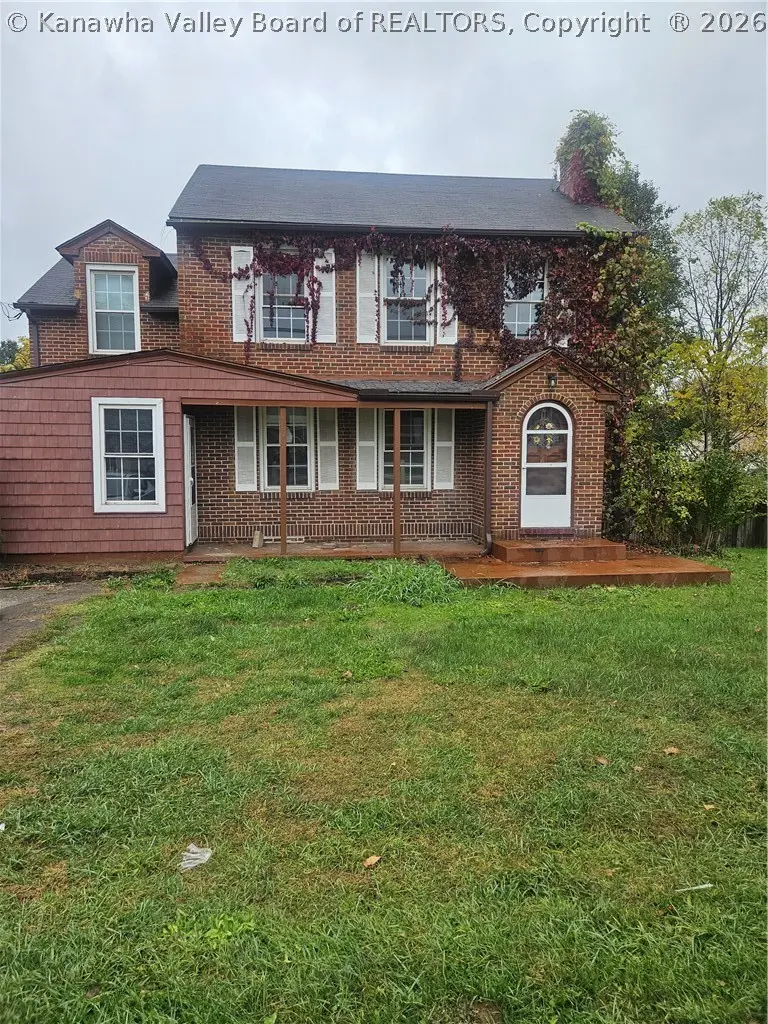
3213 Jackson Ave · Point Pleasant, WV
Flood risk 6/10 · Moderate
- FEMA flood zone
- X (unshaded)
- Chance of flooding over 30 yrs
- 0.74%
- Est. flood insurance / yr
- $473 – $860
Fire risk 4/10 · Minor
- Est. fire insurance / yr
- $787 – $1,461
Heat risk 5/10 · Moderate
- Hot days now (above 101°F)
- 7 days/yr
- Hot days in 30 yrs
- 19 days/yr
Wind risk 2/10 · Minimal
- Chance of severe wind over 30 yrs
- 1.0%
Air-quality risk 1/10 · Minimal
- Unhealthy air days now
- 0 days/yr
- Unhealthy air days in 30 yrs
- 0 days/yr
Risk factors via First Street. Map © Google.
Why this score? — see what drove the B+ grade
The composite is a weighted blend of 9 inputs, each scored 0–100. Each bar is that input's sub-score; the figure is the points it added to the 100-point composite (weight × sub-score).
- Cash flow +25.9/30.0
- ARV discount +15.0/15.0
- Appreciation +10.0/10.0
- DSCR +8.7/10.0
- 1% rule +7.0/10.0
- Livability +3.4/5.0
- Rent growth +2.5/5.0
- Condition / age +2.5/5.0
- Schools +2.2/10.0
$139,000
🖨 Deal sheet (PDF) 📄 Offer letter ✓ Due diligence
Listing remarks MLS
Investor special! Two-story brick home with 4 bedrooms, 2 baths, and formal dining room. Deck off the kitchen overlooks a large, flat, fenced backyard. Unfinished basement and detached garage/workshop. Property needs TLC and is being sold as-is with great potential.
Key facts
- 9,583 sq ft lot
- Garage
- Built 1937
Neighborhood map
What this means for you Summary
Snapshot
- This is a 4-bed/2.0-bath single-family listed at $139k.
Deal economics
- At list price, monthly cash flow is $342 ($4k/yr) — positive.
- The deal already cash-flows at list — no discount required.
- Meets the 1% rule at list price ($2k rent vs $139k).
- Recommended offer: $131k (6.0% below list) — sets the bar for market timing.
- Cap rate 9.2% vs local median 6.1% in Point Pleasant — top-decile yield for the area; either an underpriced asset or a hidden risk that comps aren't pricing in. Stress-test before assuming the spread holds.
Location & tenants
- Location reads 67/100 on livability (#95 in WV) — a middle-class / working-renter tenant base. Strengths: cost of living A+, housing A+, crime A; Watch: health & safety C-, employment D, amenities F.
- Mason County Schools (town): math 20% / reading 33% proficiency, ranked #44 of 55 in WV (top 80%) — low school quality limits family demand, transient renter base, plan for 1-2y turnover.
- Zoned schools: Pt. Pleasant Primary (351 students, 0% FRL); Point Pleasant Junior/Senior High School (math 13% / reading 35%, grade F, #95 of 110 statewide, top 86%, 1,107 students, 0% FRL) — zoned schools average 0% FRL vs 47% district-wide (47 pts lower); this property's tenant base skews higher-income than the district average.
- Market conditions: 58 active listings in the ZIP; 3 units permitted in Mason County in 2024 (0 in 5+ unit buildings).
Forward outlook
- In year one you build about $15k of equity ($961 loan paydown + $14k appreciation (10.0% local appreciation)).
- Mason County population projected at -14% by 2050 — secular population decline; favor cash flow + early exit over multi-decade hold.
- At projected returns (10.0% appreciation + 3.0% rent growth), your $39k cash investment doubles in ~2 years — after that, you're playing with house money.
- By year 3, paydown + projected appreciation supports a ~$38k cash-out refi (75% LTV) — recoverable capital for the next deal without selling this one.
Negotiation context
- It's been on market 75 days — a 6% lower offer ($131k) is reasonable based on typical stale-listing flexibility.
- 4 sale attempts since 13y ago with the ask held roughly flat each time — persistent listings suggest the price (not the market) is what's stuck; bring a comps-based counter.
Risks & watch-outs
- Watch-outs: built in 1937 — expect roof / HVAC / electrical / plumbing capex.
- Climate carrying-cost: major flood risk; extreme-heat days projected 7→19/yr by 2055 (HVAC capex compounding) — expect insurance premiums to compound above CPI over the hold.
Questions for the listing agent
- It's been on market 75 days. Have you received any prior offers? Is the seller open to a 6% concession, seller financing, or rate buy-down credit?
- Built in 1937 — when were the roof, HVAC, electrical panel, plumbing, and water heater last replaced?
- Why hasn't it sold? Are there any deal-killer items the seller is aware of (foundation, flood, title, zoning, code violations)?
- Is there a deadline driving the sale (1031 exchange, divorce, estate, relocation)? That informs how much negotiation room exists.
- Schools are F-rated, which usually means shorter tenancies and higher turnover. Who's the typical renter profile here, and what's been the actual vacancy rate?
- What's the average days-on-market for RENTAL listings here right now (not sales)? A rising rental-DOM trend means longer vacancies and softer asking-rent achievability than the comps imply.
- What's the recent tenant-quality profile in this submarket — average credit score on applications, eviction rate, late-payment / NSF rate, and stable-employment percentage? A property-management company in the area should have these aggregated.
- How much new for-sale + rental construction is in the pipeline within 1–3 miles? Heavy new supply typically softens prices + rents 12–24 months out; constrained supply supports both.
Investment metrics
- 1% rule
- 1.20% ✓
- Cap rate
- 9.24%
- Cash-on-cash
- 10.54%
- DSCR
- 1.47
- GRM
- 7.0
CMA / ARV
- ARV (median comp)
- $191,380
- List price
- $139,000
- Delta
- -27.37%
- Verdict
- UNDERPRICED
- Comps
- 20 within 1.0 mi
Show comp detail 6 sales within ~0.75 mi
| Address | Dist | Beds/Ba | Sqft | Sold | Price | $/sf | Match |
|---|---|---|---|---|---|---|---|
| 3221 Jackson Ave | 0.03mi | 4/2.0 | 1,800 (-0%) | 17mo | $185,000 | $103 | 85 |
| 518 Burdette Dr | 0.14mi | 4/2.0 | 1,568 (-13%) | 7mo | $19,500 | $12 | 66 |
| 508 29th St | 0.31mi | 3/2.5 (-1) | 1,938 (+8%) | 1mo | $207,400 | $107 | 65 |
| 510 29th St | 0.31mi | 3/2.0 (-1) | 1,906 (+6%) | 13mo | $186,000 | $98 | 60 |
| 2903 Meadowbrook Dr | 0.42mi | 3/2.0 (-1) | 1,661 (-8%) | 17mo | $217,500 | $131 | 48 |
| 904 Mossman Cir | 0.64mi | 3/2.5 (-1) | 2,053 (+14%) | 3mo | $236,500 | $115 | 38 |
Match score weights: distance 35% · size 25% · config 20% · recency 20%. Top-matched comps best support the ARV.
Projected returns pro-forma
10.0% appreciation · 3.0% rent growth · sell at horizon
- IRR
- 32.0%
- Equity multiple
- 3.51×
- Total profit
- $97,507
- Equity at exit
- $125,222
- IRR
- 27.6%
- Equity multiple
- 7.94×
- Total profit
- $270,083
- Equity at exit
- $270,046
Cash invested: $38,920 (down + closing). Projections, not guarantees.
Landlord ↔ Tenant lean methodology
- Overall (STATE)
- 83 Strongly Landlord-Friendly
- State West Virginia
- 83 Strongly Landlord-Friendly · R+22
- County
- — inherits STATE
- City
- — inherits STATE
ZIP-level market 25550
- Home prices YoY
- 6.7%
- Active inventory
- 58
- Price-to-rent
- 7.0×
Monthly cashflow live
- Estimated rent
- $1,662 medium interval (Pro) →
- Mortgage (P&I)
- −$729
- Tax from tax record
- −$184 /mo · $2,214/yr
- Insurance
- −$58
- HOA
- −$0
- Vacancy / Maint / Mgmt
- −$349
- Net cashflow
- $342
Break-even live
Sensitivity live
| Price | -10% $421 | -5% $381 | +0% $342 | +5% $303 | +10% $263 |
|---|---|---|---|---|---|
| Rent | -10% $211 | -5% $276 | +0% $342 | +5% $408 | +10% $473 |
| Rate | -1.0pp $412 | -0.5pp $377 | base $342 | +0.5pp $306 | +1.0pp $269 |
UW: 25.0% down · 7.5% · 30yr · 1.5% tax · 5.0% vac · 8.0% maint · 8.0% mgmt
Financing live
Cash to close
- Down payment
- $34,750
- Closing costs
- $4,170
- Reserves months
- —
- Total cash needed
- —
Loan-product check · same deal, 3 products live
Conventional
25% down · 7.5% · 30yr
- Down + closing
- —
- Monthly P&I
- —
- Monthly cashflow
- —
- DSCR
- —
- Eligible?
- —
Personal DTI + credit; lowest rate.
DSCR
20% down · 8.5% · 30yr
- Down + closing
- —
- Monthly P&I
- —
- Monthly cashflow
- —
- DSCR
- —
- Eligible?
- —
No personal income docs; deal must DSCR.
Hard money
10% down · 12.0% · 12mo
- Down + closing
- —
- Monthly P&I
- —
- Monthly cashflow
- —
- DSCR
- —
- Eligible?
- —
Short-term bridge; refi at stabilization.
Listing history 15 events
-
2026-06-07statusdays on market $139,000 Pending 75 DOM
-
2026-06-05days on market $139,000 Active 73 DOM
-
2026-06-03days on market $139,000 Active 72 DOM
-
2026-06-02days on market $139,000 Active 71 DOM
-
2026-06-01days on market $139,000 Active 70 DOM
-
2026-05-31days on market $139,000 Active 69 DOM
-
2026-05-30days on market $139,000 Active 68 DOM
-
2026-03-20$139,000 Active 266-char remark
Show marketing remark (266 chars)
Investor special! Two-story brick home with 4 bedrooms, 2 baths, and formal dining room. Deck off the kitchen overlooks a large, flat, fenced backyard. Unfinished basement and detached garage/workshop. Property needs TLC and is being sold as-is with great potential.
-
2021-10-07soldstatus $142,000
-
2021-07-15$139,000
-
2021-01-08soldstatus $43,000
-
2020-12-29soldstatus $43,000
-
2020-07-08$49,000
-
2013-10-29$100,000
-
1988-06-01soldstatus $54,000
ⓘ Source: listings_history table (triggers on properties + properties_extension) + one-shot
backfill from property_details.listing_events for pre-trigger history.
Tax reassessment forecast WV · Resets to sale price
- Current annual tax
- $2,214 · $184/mo
- Projected year-2 tax
- $2,214 · $184/mo
- Expected delta
- $0/yr ($0/mo · 0.0%)
ⓘ Screening estimate from a state-policy table — verify with the county assessor before closing.
Climate risk First Street
- Flood 6/10 Major FEMA zone X (unshaded) · 74% chance over 30 yrs
- Wildfire 4/10 Moderate
- Heat 5/10 Major 7 d/yr ≥101°F today · 19 d/yr by 30 yrs out
- Wind 2/10 Low 100% chance of damaging wind over 30 yrs
- Air quality 1/10 Low 0 unhealthy d/yr today · 0 by 30 yrs out
Nearby sold comps map
Loading sold comps map…
Walkable amenities ~0.75 mi
Loading nearby amenities…
Taxation est. · year 1
- Rental income
- $19,947
- − Mortgage interest
- −$7,786
- − Property taxes
- −$2,214
- − Insurance
- −$695
- − Repairs & maintenance
- −$1,596
- − Management
- −$1,596
- − Depreciation
- −$4,044
- Taxable income
- $2,017
- Est. tax owed @ 24.0%
- −$484
- After-tax cash flow
- $3,618/yr
For passive investors: Depreciation is non-cash, so a rental often shows a tax loss while cash-flowing — sheltering income. Rental losses are passive: they offset passive income freely, and up to $25,000/yr can offset ordinary (W-2) income if you actively participate and your MAGI is under $100k (phasing out to $0 by $150k); unused losses carry forward. On sale, claimed depreciation is recaptured at up to 25%, and gains may owe capital-gains tax (a 1031 exchange can defer both). Figures are a year-1 estimate at your 24.0% rate — not tax advice; consult a CPA.
Schools (NCES district)
- District
- Mason County Schools
- NCES district ID
- 5400780
- Math proficiency
- 20% ▼ -13.00%
- Reading proficiency
- 33% ▼ -10.00%
- Median HH income
- $37,623
- Composite
- 22.07/100
- National rank
- #8191
- State rank
- #44 of 55 in WV
Livability — Point Pleasant
- Score
- 67/100
- State rank
- #95
- US rank
- #10881
Category grades
Schools grade is shown separately in the Schools card above.
Census & demographics
- Census place
- Point Pleasant, WV
- County
- Mason · 14,594 people
- Population (ZIP)
- 8,925
- Household income
- $49,940
- Rent vs Own
- Severe rent burden
- 10.6
Population outlook (Mason County) Hauer SSP2
- Today (2025)
- 26,174 people
- By 2030
- 25,482 · -2.6%
- By 2040
- 23,934 · -8.6%
- By 2050
- 22,432 · -14.3%
- By 2075
- 19,241 · -26.5%
- By 2100
- 15,427 · -41.1%
Race, ethnicity, and origin ACS 2023
- Neighborhood character
- Predominantly White (95%)
- Race & ethnicity
- White 95% Two or more races 2% Hispanic / Latino 2% Black 2%
- Common ancestry
- Slovak 1% Serbian 1% Lithuanian 1%
- Foreign-born
- 0%
Political lean MEDSL · Mason
- 2024 margin
- Solid R (+58.0) · D 20.0% · R 78.0% · Other 1.9%
- 2008→2024 swing
- -45.1pp toward R · 2008: -12.9pp · 2024: -58.0pp
- All cycles
- 2024: R+58.0 2020: R+53.2 2016: R+54.7 2012: R+20.3 2008: R+12.9
Not yet ingested
- Civics
- —
Market trends
- HPI YoY
- ▲ 11.63%
- Current HPI
- 185.6226
- Rent YoY
- —
- Metro
- —
- State GDP YoY
- —
- F500 in state
- 0
Price history
+157.4% since first listed8 events — show timeline
- 2026-03-20 Listed $139,000 KVBOR
- 2021-10-07 Sold (MLS) $142,000 KVBOR
- 2021-07-15 Listed $139,000 KVBOR
- 2021-01-08 Sold (Public Records) $43,000 Public Records
- 2020-12-29 Sold (MLS) $43,000 HBRMLS
- 2020-07-08 Listed $49,000 HBRMLS
- 2013-10-29 Listed $100,000 KVBOR
- 1988-06-01 Sold (Public Records) $54,000 Public Records
Property tax history
+15.5%/yrLatest (2025): $2,214 · +21.7% YoY. Source: county tax records.
Cash-flow waterfall
monthlySold comps — $/sqft
last 12 mo · ≤1 miLoading sold comps…