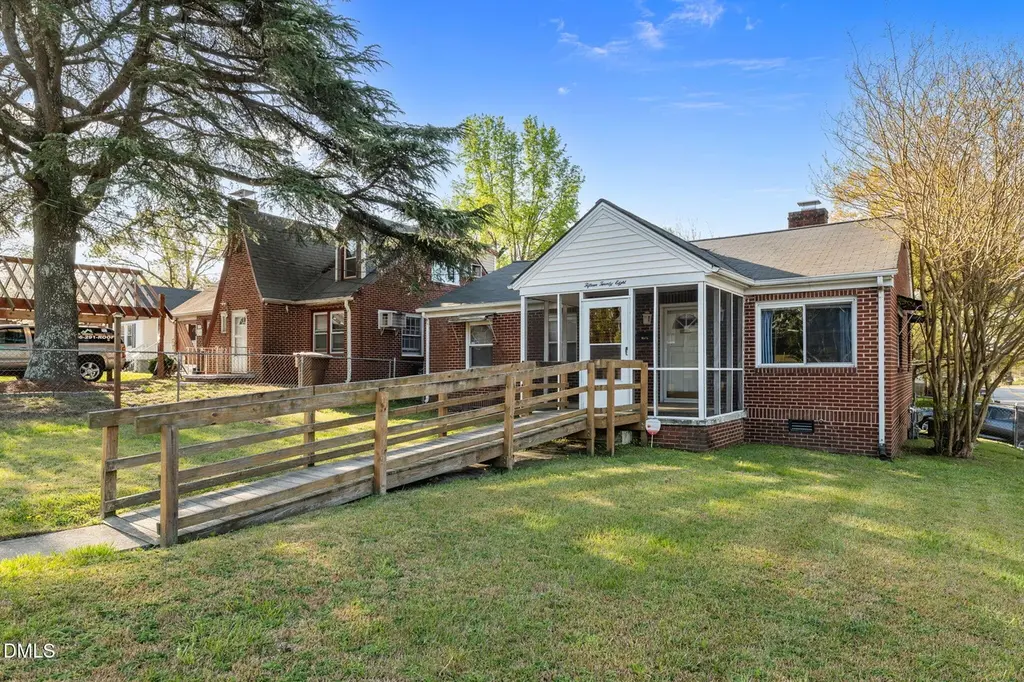
1528 Gorrell St · Greensboro, NC
Flood risk 1/10 · Minimal
- FEMA flood zone
- X (unshaded)
- Chance of flooding over 30 yrs
- 0.0%
- Est. flood insurance / yr
- $507 – $1,088
Fire risk 1/10 · Minimal
- Est. fire insurance / yr
- $906 – $1,684
Heat risk 5/10 · Moderate
- Hot days now (above 103°F)
- 7 days/yr
- Hot days in 30 yrs
- 16 days/yr
Wind risk 4/10 · Minor
- Chance of severe wind over 30 yrs
- 15.0%
Air-quality risk 2/10 · Minimal
- Unhealthy air days now
- 1 days/yr
- Unhealthy air days in 30 yrs
- 2 days/yr
Risk factors via First Street. Map © Google.
Why this score? — see what drove the C- grade
The composite is a weighted blend of 9 inputs, each scored 0–100. Each bar is that input's sub-score; the figure is the points it added to the 100-point composite (weight × sub-score).
- Cash flow +15.2/30.0
- ARV discount +14.6/15.0
- DSCR +4.7/10.0
- Livability +4.0/5.0
- Schools +3.6/10.0
- 1% rule +3.0/10.0
- Rent growth +2.9/5.0
- Condition / age +2.5/5.0
- Appreciation +0.0/10.0
$170,000
🖨 Deal sheet (PDF) 📄 Offer letter ✓ Due diligence
Listing remarks MLS
Fantastic all-brick one-level home in a highly convenient location! Situated on a deep lot, this property features a detached one-car garage and a newer roof for added peace of mind. An excellent opportunity to update and customize to your personal style, priced accordingly to make it your own!
Key facts
- Deep lot
- Newer roof
- All-brick home
Tags
Neighborhood map
What this means for you Summary
Snapshot
- This is a 3-bed/1.0-bath single-family listed at $170k.
Deal economics
- At list price, monthly cash flow is $59 ($704/yr) — positive.
- The deal already cash-flows at list — no discount required.
- To meet the 1% rule (rent ≥ 1% of price), the offer needs to be $137k (19.6% below list).
- Recommended offer: $137k (19.6% below list) — sets the bar for 1% rule.
- Cap rate 6.7% vs local median 3.7% in Greensboro — top-decile yield for the area; either an underpriced asset or a hidden risk that comps aren't pricing in. Stress-test before assuming the spread holds.
Location & tenants
- Location reads 81/100 on livability (#12 in NC, #1,335 nationally) — a professional / high-income tenant draw. Strengths: amenities A+, commute A+, cost of living A+; Watch: employment D, crime F.
- Guilford County Schools (urban): math 39% / reading 45% proficiency, ranked #99 of 178 in NC (top 56%) — families likely to look elsewhere, expect single-tenant / working-renter base with shorter leases.
- Zoned schools: Otis L Hairston Sr Middle (math 13% / reading 22%, grade F, #445 of 475 statewide, top 94%, 631 students, 100% FRL); James B Dudley High (math 34% / reading 40%, grade F, #414 of 535 statewide, top 79%, 1,491 students, 100% FRL) — zoned schools average 100% FRL vs 52% district-wide (47 pts higher); higher-poverty schools than district average — tighter screening recommended.
- Zoned-school proficiency averages 27% at this address vs 42% district-wide (-15 pts) — the specific schools serving this property underperform the Guilford County Schools average; the district grade overstates school quality for this exact location.
- Market conditions: Rents rising (+1.8%/yr); 130 active listings in the ZIP; 28 comparable units currently listed for rent nearby; rentals at typical pace (median 25d on market — plan ~3-4 weeks tenant-placement turnaround); 3,843 units permitted in Guilford County in 2024 (2,397 in 5+ unit buildings).
- This rent runs 34% of the median local income ($48k/yr) — at the standard rent-burdened threshold; future hikes will face affordability resistance.
Forward outlook
- Local home prices are declining (-3.0%/yr); year-one equity from $1k of loan paydown is wiped out by about $5k of value loss. Plan a longer hold.
- Guilford County population projected at +26% by 2050 — long-run rental-demand tailwind backs the buy-and-hold thesis.
Negotiation context
- Only 5 days on market — expect competitive offers; lowballing is unlikely to land.
- 2 sale attempts with the ask held roughly flat each time — persistent listings suggest the price (not the market) is what's stuck; bring a comps-based counter.
Risks & watch-outs
- Watch-outs: built in 1950 — expect roof / HVAC / electrical / plumbing capex.
- Climate carrying-cost: extreme-heat days projected 7→16/yr by 2055 (HVAC capex compounding) — expect insurance premiums to compound above CPI over the hold.
Questions for the listing agent
- Built in 1950 — when were the roof, HVAC, electrical panel, plumbing, and water heater last replaced?
- Is there a deadline driving the sale (1031 exchange, divorce, estate, relocation)? That informs how much negotiation room exists.
- Crime grade is F in this area — have there been break-ins, vandalism, or insurance claims at this property in the last 3 years? What carrier currently insures it and at what premium?
- What's the average days-on-market for RENTAL listings here right now (not sales)? A rising rental-DOM trend means longer vacancies and softer asking-rent achievability than the comps imply.
- What's the recent tenant-quality profile in this submarket — average credit score on applications, eviction rate, late-payment / NSF rate, and stable-employment percentage? A property-management company in the area should have these aggregated.
- How much new for-sale + rental construction is in the pipeline within 1–3 miles? Heavy new supply typically softens prices + rents 12–24 months out; constrained supply supports both.
Investment metrics
- 1% rule
- 0.80% ✗
- Cap rate
- 6.71%
- Cash-on-cash
- 1.48%
- DSCR
- 1.07
- GRM
- 10.4
CMA / ARV
- ARV (on-the-fly)
- $201,960
- Comps found
- 12
Show comp detail 12 sales within ~0.75 mi
| Address | Dist | Beds/Ba | Sqft | Sold | Price | $/sf | Match |
|---|---|---|---|---|---|---|---|
| 1118 Duke St | 0.35mi | 3/2.0 | 1,064 (-2%) | 6mo | $85,000 | $80 | 72 |
| 315 Gillespie St | 0.41mi | 3/1.0 | 1,150 (+6%) | 1mo | $125,000 | $109 | 70 |
| 2127 Mcconnell Rd | 0.40mi | 3/2.0 | 1,132 (+5%) | 2mo | $215,000 | $190 | 68 |
| 610 Bingham St | 0.24mi | 3/2.0 | 1,159 (+7%) | 10mo | $219,000 | $189 | 64 |
| 1013 Duke St | 0.21mi | 3/1.0 | 962 (-11%) | 10mo | $170,000 | $177 | 64 |
| 719 S Benbow Rd | 0.29mi | 3/2.0 | 1,188 (+10%) | 6mo | $235,000 | $198 | 61 |
| 1709 Morning View Dr | 0.14mi | 3/2.0 | 1,227 (+14%) | 10mo | $220,000 | $179 | 58 |
| 1402 Ardmore Dr | 0.75mi | 3/2.0 | 1,087 (+1%) | 2mo | $225,000 | $207 | 58 |
| 2222 E Gate City Blvd | 0.48mi | 3/1.5 | 1,125 (+4%) | 13mo | $190,300 | $169 | 58 |
| 1109 Benjamin Benson St | 0.71mi | 3/2.0 | 1,134 (+5%) | 2mo | $212,500 | $187 | 53 |
| 2019 Hassall St | 0.38mi | 3/2.0 | 1,238 (+15%) | 11mo | $220,500 | $178 | 45 |
| 1408 Willow Rd | 0.60mi | 3/2.0 | 932 (-14%) | 2mo | $200,000 | $215 | 44 |
Match score weights: distance 35% · size 25% · config 20% · recency 20%. Top-matched comps best support the ARV.
Projected returns pro-forma
-3.0% appreciation · 1.78% rent growth · sell at horizon
- IRR
- -15.2%
- Equity multiple
- 0.46×
- Total profit
- $-25,543
- Equity at exit
- $25,348
- IRR
- -8.6%
- Equity multiple
- 0.49×
- Total profit
- $-24,368
- Equity at exit
- $14,698
Cash invested: $47,600 (down + closing). Projections, not guarantees.
Landlord ↔ Tenant lean methodology
- Overall (STATE)
- 85 Strongly Landlord-Friendly
- State North Carolina
- 85 Strongly Landlord-Friendly · R+3
- County
- — inherits STATE
- City
- — inherits STATE
ZIP-level market 27401
- Home prices YoY
- -28.9%
- Rents YoY
- 1.8%
- Active inventory
- 130
- Price-to-rent
- 10.4×
Monthly cashflow live
- Estimated rent
- $1,367 high interval (Pro) →
- Mortgage (P&I)
- −$891
- Tax from tax record
- −$59 /mo · $706/yr
- Insurance
- −$71
- HOA
- −$0
- Vacancy / Maint / Mgmt
- −$287
- Net cashflow
- $59
Break-even live
Sensitivity live
| Price | -10% $155 | -5% $107 | +0% $59 | +5% $11 | +10% $-38 |
|---|---|---|---|---|---|
| Rent | -10% $-49 | -5% $5 | +0% $59 | +5% $113 | +10% $167 |
| Rate | -1.0pp $144 | -0.5pp $102 | base $59 | +0.5pp $15 | +1.0pp $-30 |
UW: 25.0% down · 7.5% · 30yr · 1.5% tax · 5.0% vac · 8.0% maint · 8.0% mgmt
Financing live
Cash to close
- Down payment
- $42,500
- Closing costs
- $5,100
- Reserves months
- —
- Total cash needed
- —
Loan-product check · same deal, 3 products live
Conventional
25% down · 7.5% · 30yr
- Down + closing
- —
- Monthly P&I
- —
- Monthly cashflow
- —
- DSCR
- —
- Eligible?
- —
Personal DTI + credit; lowest rate.
DSCR
20% down · 8.5% · 30yr
- Down + closing
- —
- Monthly P&I
- —
- Monthly cashflow
- —
- DSCR
- —
- Eligible?
- —
No personal income docs; deal must DSCR.
Hard money
10% down · 12.0% · 12mo
- Down + closing
- —
- Monthly P&I
- —
- Monthly cashflow
- —
- DSCR
- —
- Eligible?
- —
Short-term bridge; refi at stabilization.
Rent comps 28 comps
| Address | Beds | Baths | Sqft | Rent | $/sqft | DOM | Units | Dist |
|---|---|---|---|---|---|---|---|---|
| 503 S O Henry Blvd Greensboro, NC | 2.0 | 1.0 | 860 | $850 | $0.99 | 25d | 1 | 0.27mi |
| 403 S O Henry Blvd Unit Alexander Homes Greensboro, NC | 2.0 | 1.0 | 860 | $875 | $1.02 | 25d | 1 | 0.31mi |
| 2001 Spencer St Greensboro, NC | 2.0 | 1.0 | 720 | $1,295 | $1.80 | 25d | 1 | 0.42mi |
| 2117 Tuscaloosa St Greensboro, NC | 3.0 | 1.0 | 1000 | $1,600 | $1.60 | 25d | 1 | 0.61mi |
| 1001 E Bragg St Apt B Greensboro, NC | 2.0 | 1.0 | 700 | $925 | $1.32 | 16d | 1 | 0.64mi |
| 710 Reid St Greensboro, NC | 3.0 | 1.0 | 925 | $1,395 | $1.51 | 16d | 1 | 0.71mi |
| 201 Huffman St Greensboro, NC | 3.0 | 2.0 | 1350 | $1,000 | $0.74 | 16d | 1 | 0.72mi |
| 1112 Stephens St Greensboro, NC | 2.0 | 1.0 | 744 | $1,250 | $1.68 | 21d | 1 | 0.73mi |
| 1404 Ardmore Dr Greensboro, NC | 3.0 | 2.0 | 1094 | $1,625 | $1.49 | 16d | 1 | 0.78mi |
| 909 Tuscaloosa St Greensboro, NC | 2.0 | 1.0 | 840 | $1,195 | $1.42 | 25d | 1 | 0.79mi |
| 600 Banner Ave Unit 614-B Greensboro, NC | 2.0 | 1.5 | 850 | $850 | $1.00 | 25d | 1 | 0.80mi |
| 112 S Raleigh St Greensboro, NC | 3.0 | 1.0 | 1000 | $1,200 | $1.20 | 25d | 1 | 0.80mi |
| 522 Banner Ave Greensboro, NC | 3.0 | 2.0 | 822 | $1,600 | $1.95 | 25d | 1 | 0.80mi |
| 110 S Raleigh St Greensboro, NC | 3.0 | 1.0 | 1000 | $1,200 | $1.20 | 25d | 1 | 0.81mi |
| 904 Stephens St Greensboro, NC | 3.0 | 1.0 | 1052 | $1,490 | $1.42 | 16d | 1 | 0.88mi |
| 2011 Lutheran St Greensboro, NC | 2.0 | 1.0 | 800 | $985 | $1.23 | 25d | 1 | 0.94mi |
| 506 Martin St Greensboro, NC | 3.0 | 2.0 | 1296 | $1,500 | $1.16 | 25d | 1 | 0.96mi |
| 1923 Belcrest Dr Greensboro, NC | 4.0 | 1.5 | 1205 | $1,895 | $1.57 | 21d | 1 | 1.01mi |
| 1610 Eastwood Ave Greensboro, NC | 3.0 | 2.0 | 950 | $1,750 | $1.84 | 25d | 1 | 1.03mi |
| 405 N Dudley St Greensboro, NC | 3.0 | 2.0 | 1264 | $2,200 | $1.74 | 16d | 1 | 1.05mi |
| 909 Beaumont Ave Greensboro, NC | 4.0 | 2.0 | 1192 | $1,625 | $1.36 | 25d | 1 | 1.06mi |
| 2007 S Benbow Rd Greensboro, NC | 3.0 | 1.0 | 960 | $1,100 | $1.15 | 25d | 1 | 1.09mi |
| 405 E Whittington St Greensboro, NC | 2.0 | 1.0 | 700 | $995 | $1.42 | 25d | 1 | 1.25mi |
| 238 E Lewis St #302 Greensboro, NC | 2.0 | 2.0 | 1270 | $1,795 | $1.41 | 25d | 1 | 1.27mi |
| 321 S Elm St Greensboro, NC | 1.0–2.0 | 1.0–2.0 | 950 | $1,787 | $1.88 | 16d | 8 | 1.38mi |
| 309 Holt Ave Greensboro, NC | 2.0 | 1.0 | 1000 | $1,175 | $1.18 | 25d | 1 | 1.47mi |
| 201 N Elm St Greensboro, NC | 2.0 | 2.0 | 1154 | $2,195 | $1.90 | 25d | 1 | 1.50mi |
| 201 N Elm St Greensboro, NC | 2.0 | 2.0 | 1046 | $2,298 | $2.20 | 16d | 2 | 1.50mi |
Listing history 4 events
-
2026-04-08status Pending Accepting Backup Offers 295-char remark
Show marketing remark (295 chars)
Fantastic all-brick one-level home in a highly convenient location! Situated on a deep lot, this property features a detached one-car garage and a newer roof for added peace of mind. An excellent opportunity to update and customize to your personal style, priced accordingly to make it your own!
-
2026-04-08status Pending
Show marketing remark (295 chars)
Fantastic all-brick one-level home in a highly convenient location! Situated on a deep lot, this property features a detached one-car garage and a newer roof for added peace of mind. An excellent opportunity to update and customize to your personal style, priced accordingly to make it your own!
-
2026-04-03$170,000 Active 295-char remark
Show marketing remark (295 chars)
Fantastic all-brick one-level home in a highly convenient location! Situated on a deep lot, this property features a detached one-car garage and a newer roof for added peace of mind. An excellent opportunity to update and customize to your personal style, priced accordingly to make it your own!
-
2026-04-03$170,000 Active
Show marketing remark (295 chars)
Fantastic all-brick one-level home in a highly convenient location! Situated on a deep lot, this property features a detached one-car garage and a newer roof for added peace of mind. An excellent opportunity to update and customize to your personal style, priced accordingly to make it your own!
ⓘ Source: listings_history table (triggers on properties + properties_extension) + one-shot
backfill from property_details.listing_events for pre-trigger history.
Tax reassessment forecast NC · Resets to sale price
- Current annual tax
- $706 · $59/mo
- Projected year-2 tax
- $1,394 · $116/mo
- Expected delta
- +$688/yr (+$57/mo · 97.6%)
ⓘ Screening estimate from a state-policy table — verify with the county assessor before closing.
Climate risk First Street
- Flood 1/10 Low FEMA zone X (unshaded) · 0% chance over 30 yrs
- Wildfire 1/10 Low
- Heat 5/10 Major 7 d/yr ≥103°F today · 16 d/yr by 30 yrs out
- Wind 4/10 Moderate 15% chance of damaging wind over 30 yrs
- Air quality 2/10 Low 1 unhealthy d/yr today · 2 by 30 yrs out
Nearby sold comps map
Loading sold comps map…
Walkable amenities ~0.75 mi
Loading nearby amenities…
Taxation est. · year 1
- Rental income
- $16,402
- − Mortgage interest
- −$9,523
- − Property taxes
- −$706
- − Insurance
- −$850
- − Repairs & maintenance
- −$1,312
- − Management
- −$1,312
- − Depreciation
- −$4,945
- Taxable loss
- −$2,246
- Est. tax savings @ 24.0%
- +$539
- After-tax cash flow
- $1,243/yr
For passive investors: Depreciation is non-cash, so a rental often shows a tax loss while cash-flowing — sheltering income. Rental losses are passive: they offset passive income freely, and up to $25,000/yr can offset ordinary (W-2) income if you actively participate and your MAGI is under $100k (phasing out to $0 by $150k); unused losses carry forward. On sale, claimed depreciation is recaptured at up to 25%, and gains may owe capital-gains tax (a 1031 exchange can defer both). Figures are a year-1 estimate at your 24.0% rate — not tax advice; consult a CPA.
Schools (NCES district)
- District
- Guilford County Schools
- NCES district ID
- 3701920
- Math proficiency
- 39% ▲ 1.00%
- Reading proficiency
- 45% ▲ 1.00%
- Median HH income
- $46,315
- Composite
- 35.78/100
- National rank
- #4842
- State rank
- #99 of 178 in NC
Livability — Greensboro
- Score
- 81/100
- State rank
- #12
- US rank
- #1335
Category grades
Schools grade is shown separately in the Schools card above.
Census & demographics
- Census place
- Greensboro, NC
- County
- Guilford County · 487,190 people
- City population
- 329,421
- Metro
- Greensboro-High Point, NC
- Population (ZIP)
- 21,920
- Household income
- $47,972
- Rent vs Own
- Severe rent burden
- 1138.0
Population outlook (Guilford County) Hauer SSP2
- Today (2025)
- 584,596 people
- By 2030
- 616,851 · +5.5%
- By 2040
- 678,451 · +16.1%
- By 2050
- 734,788 · +25.7%
- By 2075
- 862,985 · +47.6%
- By 2100
- 948,704 · +62.3%
Race, ethnicity, and origin ACS 2023
- Neighborhood character
- Majority Black (62%)
- Race & ethnicity
- Black 62% White 26% Hispanic / Latino 8% Two or more races 4% Asian 1%
- Hispanic origin (detail)
- Mexican 4%
- Common ancestry
- Italian 1% Serbian 1% Slovak 1%
- Foreign-born
- 9% · Canada
- Languages at home
- 88% English-only · Spanish 6% Arabic 2% French/Haitian/Cajun 1%
Political lean MEDSL · Guilford
- 2024 margin
- Strong D (+21.8) · D 60.2% · R 38.4% · Other 1.4%
- 2008→2024 swing
- +3.5pp toward D · 2008: 18.4pp · 2024: 21.8pp
- All cycles
- 2024: D+21.8 2020: D+23.1 2016: D+20.0 2012: D+16.5 2008: D+18.4
Not yet ingested
- Civics
- —
Market trends
- HPI YoY
- ▼ -97.87%
- Current HPI
- 240.5377
- Rent YoY
- ▲ 1.78%
- Metro
- Greensboro-High Point, NC
- State GDP YoY
- ▲ 3.28%
- F500 in state
- 26
Industry mix (Fortune 500 HQ in NC)
| Industry | F500 HQs | Revenue |
|---|---|---|
| Financial Services | 2 | $213B |
|
||
| Retail | 2 | $95B |
|
||
| Industrial Conglomerate | 1 | $38B |
|
||
| Metals / Steel | 1 | $35B |
|
||
| Utilities | 1 | $30B |
|
||
| Industrial Machinery | 1 | $19B |
|
||
Price history
+0.0% since first listed4 events — show timeline
- 2026-04-08 Pending — Triad MLS
- 2026-04-08 Pending — TMLS
- 2026-04-03 Listed $170,000 TMLS
- 2026-04-03 Listed $170,000 Triad MLS
Property tax history
+9.3%/yrLatest (2025): $706 · +98.0% YoY. Source: county tax records.
Cash-flow waterfall
monthlySold comps — $/sqft
last 12 mo · ≤1 miLoading sold comps…