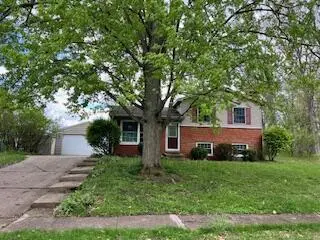
4410 Fireside Ave · Portage, MI
Flood risk 1/10 · Minimal
- FEMA flood zone
- X (unshaded)
- Chance of flooding over 30 yrs
- 0.0%
- Est. flood insurance / yr
- $507 – $1,088
Fire risk 1/10 · Minimal
- Est. fire insurance / yr
- $784 – $1,456
Heat risk 2/10 · Minimal
- Hot days now (above 98°F)
- 7 days/yr
- Hot days in 30 yrs
- 16 days/yr
Wind risk 2/10 · Minimal
- Chance of severe wind over 30 yrs
- —
Air-quality risk 2/10 · Minimal
- Unhealthy air days now
- 1 days/yr
- Unhealthy air days in 30 yrs
- 2 days/yr
Risk factors via First Street. Map © Google.
Why this score? — see what drove the D grade
The composite is a weighted blend of 9 inputs, each scored 0–100. Each bar is that input's sub-score; the figure is the points it added to the 100-point composite (weight × sub-score).
- Cash flow +11.0/30.0
- ARV discount +7.1/15.0
- Rent growth +5.0/5.0
- Schools +4.8/10.0
- Livability +4.0/5.0
- DSCR +3.2/10.0
- 1% rule +2.8/10.0
- Condition / age +2.5/5.0
- Appreciation +0.0/10.0
$244,000
🖨 Deal sheet 📄 Offer letter ✓ Due diligence
Listing remarks MLS
Home was an unlisted sale. Newer mechanicals and updated.
Key facts
- 8,276 sq ft lot
- 3 garage spots
- Built 1961
Property features AI
Finance
- Other: Living area reported as 1,352
- Financial info: Details not provided
- HOA & community: Details not provided
Exterior
- Parking: Detached garage; 3-car garage
- Security: Details not provided
- Utilities: Public water; Natural gas connected; Natural gas water heater; Cable connected
- Home design: Single-family residence; Residential property; Built in 1961
- Construction: Brick and wood siding exterior; Composition roof; Partial daylight basement
- Exterior features: Sidewalk; Paved road access; Daylight partial basement
Interior
- Kitchen: Dishwasher; Range; Refrigerator; Eat-in kitchen; Pantry
- Bedrooms: Details not provided
- Flooring: Details not provided
- Bathrooms: 1 full bathroom; 1 half bathroom
- Heating & cooling: Forced air heating; Central cooling
- Interior features: Garage door opener; Eat-in kitchen; Pantry; Wood-burning fireplace; Replacement windows; Window treatments; 7 total rooms
- Laundry & utility: Washer; Dryer
Neighborhood map
What this means for you Summary
Snapshot
- This is a 3-bed/1.5-bath single-family listed at $244k.
Deal economics
- At list price, monthly cash flow is $-103 ($-1k/yr) — negative.
- To cash-flow at today's rent, offer at most $226k (7.5% below list).
- To meet the 1% rule (rent ≥ 1% of price), the offer needs to be $190k (22.1% below list).
- Recommended offer: $190k (22.1% below list) — sets the bar for 1% rule.
- Cap rate 5.8% vs local median 3.3% in Portage — top-decile yield for the area; either an underpriced asset or a hidden risk that comps aren't pricing in. Stress-test before assuming the spread holds.
Location & tenants
- Location reads 79/100 on livability (#90 in MI, #2,044 nationally) — a middle-class / working-renter tenant base. Strengths: cost of living A+, housing A+, health & safety A+; Watch: crime D+, amenities D-, commute F.
- Portage Public Schools (urban): math 48% / reading 63% proficiency, ranked #67 of 540 in MI (top 12%) — acceptable for families but not a draw, mixed tenant base, ~2y average lease.
- Market conditions: Rents rising fast (+11.3%/yr); 127 active listings in the ZIP; 1 comparable units currently listed for rent nearby; 339 units permitted in Kalamazoo County in 2024 (22 in 5+ unit buildings).
- This rent runs 31% of the median local income ($74k/yr) — at the standard rent-burdened threshold; future hikes will face affordability resistance.
Forward outlook
- Local home prices are declining (-3.0%/yr); year-one equity from $2k of loan paydown is wiped out by about $7k of value loss. Plan a longer hold.
- Kalamazoo County population projected at +18% by 2050 — long-run rental-demand tailwind backs the buy-and-hold thesis.
Negotiation context
- Only 1 days on market — expect competitive offers; lowballing is unlikely to land.
- 5 sale attempts since 28y ago with the ask held roughly flat each time — persistent listings suggest the price (not the market) is what's stuck; bring a comps-based counter.
- Current owner paid $89k; list at $244k implies a 174% gain — meaningful room to come down on a strong offer.
Questions for the listing agent
- What do current leases actually rent for vs. the listed asking? Can we see a recent rent roll and the last 12 months of T-12 income?
- Built in 1961 — when were the roof, HVAC, electrical panel, plumbing, and water heater last replaced?
- Is there a deadline driving the sale (1031 exchange, divorce, estate, relocation)? That informs how much negotiation room exists.
- Schools are A-rated — typically a magnet for longer-tenancy family renters. What's the average tenant stay here, and is there a school-zone premium baked into asking?
- Crime grade is D in this area — have there been break-ins, vandalism, or insurance claims at this property in the last 3 years? What carrier currently insures it and at what premium?
- The area grade is low — what's the realistic commute time and amenity access for the typical tenant pool here? Any planned neighborhood developments (good or bad) we should know about?
- What's the average days-on-market for RENTAL listings here right now (not sales)? A rising rental-DOM trend means longer vacancies and softer asking-rent achievability than the comps imply.
- What's the recent tenant-quality profile in this submarket — average credit score on applications, eviction rate, late-payment / NSF rate, and stable-employment percentage? A property-management company in the area should have these aggregated.
- How much new for-sale + rental construction is in the pipeline within 1–3 miles? Heavy new supply typically softens prices + rents 12–24 months out; constrained supply supports both.
Investment metrics
- 1% rule
- 0.78% ✗
- Cap rate
- 5.79%
- Cash-on-cash
- -1.81%
- DSCR
- 0.92
- GRM
- 10.7
CMA / ARV
- ARV (on-the-fly)
- $242,008
- Comps found
- 8
Show comp detail 8 sales within ~0.75 mi
| Address | Dist | Beds/Ba | Sqft | Sold | Price | $/sf | Match |
|---|---|---|---|---|---|---|---|
| 4410 Fireside Ave | 0.00mi | 3/1.5 | 1,352 (0%) | 1mo | $242,000 | $179 | 99 |
| 8129 S Sprinkle Rd | 0.20mi | 3/1.0 | 1,426 (+6%) | 0mo | $241,000 | $169 | 79 |
| 4003 Biscayne Ave | 0.59mi | 3/1.5 | 1,310 (-3%) | 9mo | $241,000 | $184 | 60 |
| 8358 W Long Lake Dr | 0.50mi | 2/1.0 (-1) | 1,496 (+11%) | 3mo | $245,000 | $164 | 50 |
| 3832 Florinda Ave | 0.60mi | 4/1.5 (+1) | 1,240 (-8%) | 10mo | $245,000 | $198 | 45 |
| 8814 S Sprinkle Rd | 0.64mi | 3/1.0 | 1,176 (-13%) | 10mo | $200,000 | $170 | 38 |
| 4116 Tiffany Ave | 0.69mi | 2/2.0 (-1) | 1,237 (-8%) | 14mo | $175,000 | $141 | 35 |
| 4775 Tiffany Ave | 0.75mi | 3/2.0 | 1,482 (+10%) | 23mo | $320,000 | $216 | 28 |
Match score weights: distance 35% · size 25% · config 20% · recency 20%. Top-matched comps best support the ARV.
Projected returns pro-forma
-3.0% appreciation · 8.0% rent growth · sell at horizon
- IRR
- -14.1%
- Equity multiple
- 0.47×
- Total profit
- $-36,073
- Equity at exit
- $36,381
- IRR
- 1.0%
- Equity multiple
- 1.08×
- Total profit
- $5,785
- Equity at exit
- $21,097
Cash invested: $68,320 (down + closing). Projections, not guarantees.
Landlord ↔ Tenant lean methodology
- Overall (STATE)
- 62 Landlord-Friendly
- State Michigan
- 62 Landlord-Friendly · EVEN
- County
- — inherits STATE
- City
- — inherits STATE
ZIP-level market 49002
- Rents YoY
- 11.3%
- Active inventory
- 127
- Price-to-rent
- 10.7×
Monthly cashflow live
- Estimated rent
- $1,901 medium interval (Pro) →
- Mortgage (P&I)
- −$1,280
- Tax from tax record
- −$224 /mo · $2,685/yr
- Insurance
- −$102
- HOA
- −$0
- Vacancy / Maint / Mgmt
- −$399
- Net cashflow
- $-103
Break-even live
UW: 25.0% down · 7.5% · 30yr · 1.5% tax · 5.0% vac · 8.0% maint · 8.0% mgmt
Financing live
Cash to close
- Down payment
- $61,000
- Closing costs
- $7,320
- Reserves months
- —
- Total cash needed
- —
Loan-product check · same deal, 3 products live
Conventional
25% down · 7.5% · 30yr
- Down + closing
- —
- Monthly P&I
- —
- Monthly cashflow
- —
- DSCR
- —
- Eligible?
- —
Personal DTI + credit; lowest rate.
DSCR
20% down · 8.5% · 30yr
- Down + closing
- —
- Monthly P&I
- —
- Monthly cashflow
- —
- DSCR
- —
- Eligible?
- —
No personal income docs; deal must DSCR.
Hard money
10% down · 12.0% · 12mo
- Down + closing
- —
- Monthly P&I
- —
- Monthly cashflow
- —
- DSCR
- —
- Eligible?
- —
Short-term bridge; refi at stabilization.
Rent comps 1 comps
| Address | Beds | Baths | Sqft | Rent | $/sqft | DOM | Units | Dist |
|---|---|---|---|---|---|---|---|---|
| 2011 E Centre Ave Portage, MI | 2.0 | 1.5 | 1116 | $1,575 | $1.41 | 13d | 1 | 1.49mi |
Listing history 10 events
-
2026-05-01status Pending
Show marketing remark (57 chars)
Home was an unlisted sale. Newer mechanicals and updated.
-
2026-05-01$244,000 Active
Show marketing remark (57 chars)
Home was an unlisted sale. Newer mechanicals and updated.
-
2026-05-01historical 57-char remark
Show marketing remark (57 chars)
Home was an unlisted sale. Newer mechanicals and updated.
-
2026-05-01$244,000 57-char remark
Show marketing remark (57 chars)
Home was an unlisted sale. Newer mechanicals and updated.
-
2026-05-01$244,000 57-char remark
Show marketing remark (57 chars)
Home was an unlisted sale. Newer mechanicals and updated.
-
2026-05-01historical 57-char remark
Show marketing remark (57 chars)
Home was an unlisted sale. Newer mechanicals and updated.
-
1999-03-31soldstatus $89,000
-
1999-03-31soldstatus $89,000
-
1998-09-13$89,000
-
1998-09-13$89,000
ⓘ Source: listings_history table (triggers on properties + properties_extension) + one-shot
backfill from property_details.listing_events for pre-trigger history.
Tax reassessment forecast MI · Partial reset (capped growth)
- Current annual tax
- $2,685 · $224/mo
- Projected year-2 tax
- $3,221 · $268/mo
- Expected delta
- +$536/yr (+$45/mo · 20.0%)
ⓘ Screening estimate from a state-policy table — verify with the county assessor before closing.
Climate risk First Street
- Flood 1/10 Low FEMA zone X (unshaded) · 0% chance over 30 yrs
- Wildfire 1/10 Low
- Heat 2/10 Low 7 d/yr ≥98°F today · 16 d/yr by 30 yrs out
- Wind 2/10 Low
- Air quality 2/10 Low 1 unhealthy d/yr today · 2 by 30 yrs out
Nearby sold comps map
Loading sold comps map…
Walkable amenities ~0.75 mi
Loading nearby amenities…
Taxation est. · year 1
- Rental income
- $22,814
- − Mortgage interest
- −$13,668
- − Property taxes
- −$2,685
- − Insurance
- −$1,220
- − Repairs & maintenance
- −$1,825
- − Management
- −$1,825
- − Depreciation
- −$7,098
- Taxable loss
- −$5,507
- Est. tax savings @ 24.0%
- +$1,322
- After-tax cash flow
- $86/yr
For passive investors: Depreciation is non-cash, so a rental often shows a tax loss while cash-flowing — sheltering income. Rental losses are passive: they offset passive income freely, and up to $25,000/yr can offset ordinary (W-2) income if you actively participate and your MAGI is under $100k (phasing out to $0 by $150k); unused losses carry forward. On sale, claimed depreciation is recaptured at up to 25%, and gains may owe capital-gains tax (a 1031 exchange can defer both). Figures are a year-1 estimate at your 24.0% rate — not tax advice; consult a CPA.
Schools (NCES district)
- District
- Portage Public Schools
- NCES district ID
- 2628950
- Math proficiency
- 48% ▼ -9.00%
- Reading proficiency
- 63% ▼ -2.00%
- Median HH income
- $61,322
- Composite
- 48.37/100
- National rank
- #2142
- State rank
- #67 of 540 in MI
Livability — Portage
- Score
- 79/100
- State rank
- #90
- US rank
- #2044
Category grades
Schools grade is shown separately in the Schools card above.
Census & demographics
- Census place
- Portage, MI
- County
- Kalamazoo County · 224,317 people
- City population
- 50,560
- Metro
- Kalamazoo-Portage, MI
- Population (ZIP)
- 19,737
- Household income
- $73,647
- Rent vs Own
- Severe rent burden
- 462.0
Population outlook (Kalamazoo County) Hauer SSP2
- Today (2025)
- 280,982 people
- By 2030
- 292,068 · +3.9%
- By 2040
- 312,191 · +11.1%
- By 2050
- 331,196 · +17.9%
- By 2075
- 379,021 · +34.9%
- By 2100
- 396,579 · +41.1%
Race, ethnicity, and origin ACS 2023
- Neighborhood character
- Predominantly White (85%)
- Race & ethnicity
- White 85% Two or more races 8% Hispanic / Latino 5% Black 4%
- Common ancestry
- Iranian 9% Romanian 6% Portuguese 3%
- Foreign-born
- 4% · Canada
- Languages at home
- 95% English-only · Spanish 2% Russian/Polish/Slavic 1%
Political lean MEDSL · Kalamazoo
- 2024 margin
- D (+17.7) · D 58.0% · R 40.3% · Other 1.7%
- 2008→2024 swing
- -1.8pp toward R · 2008: 19.5pp · 2024: 17.7pp
- All cycles
- 2024: D+17.7 2020: D+18.7 2016: D+12.8 2012: D+13.3 2008: D+19.5
Not yet ingested
- Civics
- —
Market trends
- HPI YoY
- ▼ -319.17%
- Current HPI
- 219.4489
- Rent YoY
- ▲ 11.29%
- Metro
- Kalamazoo-Portage, MI
- State GDP YoY
- ▲ 1.37%
- F500 in state
- 28
Industry mix (Fortune 500 HQ in MI)
| Industry | F500 HQs | Revenue |
|---|---|---|
| Automotive Parts | 3 | $48B |
|
||
| Automotive | 2 | $372B |
|
||
| Chemicals | 1 | $45B |
|
||
| Automotive Retail | 1 | $29B |
|
||
| Healthcare / Medical Devices | 1 | $23B |
|
||
| Automotive Technology | 1 | $20B |
|
||
Price history
+174.2% since first listed10 events — show timeline
- 2026-05-01 Pending — SW Michigan MLS
- 2026-05-01 Listing Removed — REALCOMP
- 2026-05-01 Listed $244,000 REALCOMP
- 2026-05-01 Listed $244,000 MiRealSource-MiMLS
- 2026-05-01 Listing Removed — MiRealSource-MiMLS
- 2026-05-01 Listed $244,000 SW Michigan MLS
- 1999-03-31 Sold (MLS) $89,000 REALCOMP
- 1999-03-31 Sold (MLS) $89,000 SW Michigan MLS
- 1998-09-13 Listed $89,000 REALCOMP
- 1998-09-13 Listed $89,000 SW Michigan MLS
Property tax history
+54.0%/yrLatest (2025): $2,685 · +3.0% YoY. Source: county tax records.
Cash-flow waterfall
monthlySold comps — $/sqft
last 12 mo · ≤1 miLoading sold comps…