 Triplex
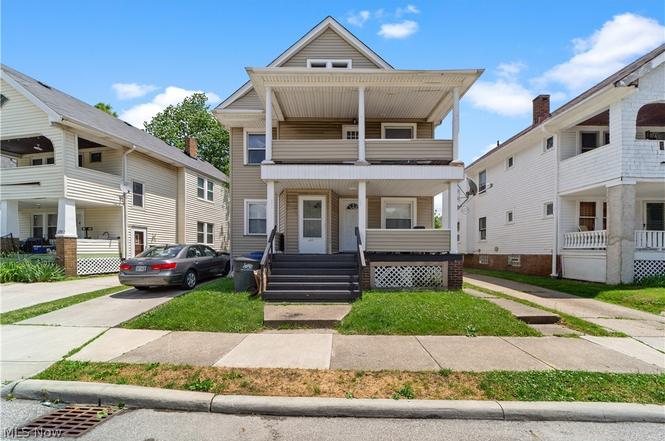
1279 Idlewood Ave · Lakewood, OH
Flood risk 5/10 · Moderate
- FEMA flood zone
- X (unshaded)
- Chance of flooding over 30 yrs
- 0.66%
- Est. flood insurance / yr
- $507 – $1,088
Fire risk 1/10 · Minimal
- Est. fire insurance / yr
- $713 – $1,323
Heat risk 3/10 · Minor
- Hot days now (above 94°F)
- 8 days/yr
- Hot days in 30 yrs
- 19 days/yr
Wind risk 1/10 · Minimal
- Chance of severe wind over 30 yrs
- —
Air-quality risk 3/10 · Minor
- Unhealthy air days now
- 4 days/yr
- Unhealthy air days in 30 yrs
- 4 days/yr
Risk factors via First Street. Map © Google.
Why this score? — see what drove the D+ grade
The composite is a weighted blend of 9 inputs, each scored 0–100. Each bar is that input's sub-score; the figure is the points it added to the 100-point composite (weight × sub-score).
- Cash flow +18.8/30.0
- DSCR +5.9/10.0
- 1% rule +5.5/10.0
- Schools +5.5/10.0
- Livability +4.4/5.0
- Rent growth +3.8/5.0
- Condition / age +2.5/5.0
- ARV discount +0.0/15.0
- Appreciation +0.0/10.0
$350,000
🖨 Deal sheet 📄 Offer letter ✓ Due diligence
Multi-family units
County records classify this as Multi-Family (2-4 Unit). Listing-text estimate: 3 units. confirmed
Listing remarks MLS
Multi family investment opportunity now available! Turnkey three unit building in Lakewood, located near Lucky's Market, Edgewater Beach and Starbucks. Updates include new flooring, interior and exterior paint, new windows in the living room and bedroom, multiple fixture updates throughout the house. Huge opportunity for owner occupy and appreciation!! Lakewood is one of the most sought after neighborhoods in Northeast Ohio with an average appreciation rate of 8% over the past 10 years. . Tenant pays gas and electric, owner covers water, sewer and trash. One unit is occupied currently. Property to be sold as-is. Unit 1 - 2 bed, 1 bath, 1100 monthly rent (occupied) Unit 2 - 2 bed, 1 bath, 1200 monthly rent Unit 3 - 1 bed, 1 bath, 700 monthly rent
Key facts
- Recent updates
- New flooring
- Turnkey investment
Tags
Property features AI
Finance
- Financial info: Annual taxes reported (2025)
Exterior
- Parking: Driveway
- Utilities: Public water; Public sewer
- Home design: 2-story property; Year built per public records
- Construction: Shingle roof
- Exterior features: Lot approximately 0.0714 acres
Interior
- Bathrooms: 3 full bathrooms
- Heating & cooling: Forced air heating; Heating present
- Interior features: Unfinished basement; Total of 13 rooms; Has basement
Neighborhood map
What this means for you Summary
Snapshot
- This is a 2×2.0bd/1.0ba + 1×1.0bd/1.0ba units multifamily listed at $350k.
Deal economics
- At list price, monthly cash flow is $350 ($4k/yr) — positive. Per door: $117/mo.
- The deal already cash-flows at list — no discount required.
- Meets the 1% rule at list price ($4k rent vs $350k).
- Cap rate 7.5% vs local median 2.5% in Lakewood — top-decile yield for the area; either an underpriced asset or a hidden risk that comps aren't pricing in. Stress-test before assuming the spread holds.
Location & tenants
- Location reads 88/100 on livability (#29 in OH, #249 nationally) — a professional / high-income tenant draw. Strengths: schools A+, amenities A+, cost of living A+; Watch: commute F.
- Lakewood City (suburban): math 60% / reading 71% proficiency, ranked #213 of 656 in OH (top 32%) — acceptable for families but not a draw, mixed tenant base, ~2y average lease.
- Market conditions: Rents rising fast (+5.4%/yr); 201 active listings in the ZIP; 6 comparable units currently listed for rent nearby; rentals at typical pace (median 15d on market — plan ~3-4 weeks tenant-placement turnaround); 1,441 units permitted in Cuyahoga County in 2024 (700 in 5+ unit buildings).
- At $3,685/mo this rent would consume 64% of the median local household income ($69k/yr) (locally 2271% of renters already pay >50% of income on rent) — very limited rent-growth headroom before tenants either downsize or default.
Forward outlook
- Local home prices are declining (-3.0%/yr); year-one equity from $2k of loan paydown is wiped out by about $10k of value loss. Plan a longer hold.
- Cuyahoga County population projected to shrink 8% by 2050 — rents likely to lag national; underwrite the cash flow, not the appreciation.
Negotiation context
- Only 3 days on market — expect competitive offers; lowballing is unlikely to land.
- 6 sale attempts since 7y ago with the ask held roughly flat each time — persistent listings suggest the price (not the market) is what's stuck; bring a comps-based counter.
Risks & watch-outs
- Watch-outs: built in 1916 — expect roof / HVAC / electrical / plumbing capex.
- Climate carrying-cost: moderate flood risk — expect insurance premiums to compound above CPI over the hold.
Questions for the listing agent
- Can we see the unit-by-unit rent roll, current vacancy, and any below-market leases? What's the average tenancy length?
- What capital expenditures (roof, boiler, parking lot, exteriors) have been made in the last 5 years, and what's planned in the next 2?
- Built in 1916 — when were the roof, HVAC, electrical panel, plumbing, and water heater last replaced?
- Is there a deadline driving the sale (1031 exchange, divorce, estate, relocation)? That informs how much negotiation room exists.
- Schools are A-rated — typically a magnet for longer-tenancy family renters. What's the average tenant stay here, and is there a school-zone premium baked into asking?
- The area grade is low — what's the realistic commute time and amenity access for the typical tenant pool here? Any planned neighborhood developments (good or bad) we should know about?
- What's the average days-on-market for RENTAL listings here right now (not sales)? A rising rental-DOM trend means longer vacancies and softer asking-rent achievability than the comps imply.
- What's the recent tenant-quality profile in this submarket — average credit score on applications, eviction rate, late-payment / NSF rate, and stable-employment percentage? A property-management company in the area should have these aggregated.
- How much new apartment / multifamily construction is in the pipeline within 1–3 miles? Heavy new supply (>2% of stock underway) typically softens rents 12–24 months out; light construction supports rent growth.
Investment metrics
- 1% rule
- 1.05% ✓
- Cap rate
- 7.49%
- Cash-on-cash
- 4.29%
- DSCR
- 1.19
- GRM
- 7.9
CMA / ARV
- ARV (on-the-fly)
- $274,040
- Comps found
- 7
Show comp detail 7 sales within ~0.75 mi
| Address | Dist | Beds/Ba | Sqft | Sold | Price | $/sf | Match |
|---|---|---|---|---|---|---|---|
| 1535 Lakewood Ave | 0.54mi | 4/2.5 (-1) | 1,740 (-2%) | 0mo | $420,000 | $241 | 65 |
| 1295 Fry Ave | 0.08mi | 4/2.0 (-1) | 1,934 (+9%) | 22mo | $371,000 | $192 | 53 |
| 1603 Ridgewood Ave | 0.64mi | 4/2.0 (-1) | 1,784 (+1%) | 9mo | $300,000 | $168 | 52 |
| 1557 Newman Ave | 0.54mi | 5/2.5 | 1,980 (+12%) | 8mo | $295,000 | $149 | 46 |
| 1618 Hopkins Ave | 0.66mi | 6/2.0 (+1) | 1,692 (-4%) | 10mo | $145,000 | $86 | 45 |
| 1518 Ridgewood Ave | 0.50mi | 4/2.0 (-1) | 1,868 (+6%) | 17mo | $290,000 | $155 | 44 |
| 1598 Alameda Ave | 0.69mi | 4/2.0 (-1) | 1,872 (+6%) | 7mo | $280,000 | $150 | 43 |
Match score weights: distance 35% · size 25% · config 20% · recency 20%. Top-matched comps best support the ARV.
Projected returns pro-forma
-3.0% appreciation · 5.39% rent growth · sell at horizon
- IRR
- -6.8%
- Equity multiple
- 0.74×
- Total profit
- $-25,188
- Equity at exit
- $52,186
- IRR
- 5.7%
- Equity multiple
- 1.47×
- Total profit
- $46,475
- Equity at exit
- $30,262
Cash invested: $98,000 (down + closing). Projections, not guarantees.
Landlord ↔ Tenant lean methodology
- Overall (STATE)
- 73 Landlord-Friendly
- State Ohio
- 73 Landlord-Friendly · R+6
- County
- — inherits STATE
- City
- — inherits STATE
ZIP-level market 44107
- Rents YoY
- 5.4%
- Active inventory
- 201
- Price-to-rent
- 22.9×
Monthly cashflow live
- Estimated rent
- $3,685 high interval (Pro) →
- Mortgage (P&I)
- −$1,835
- Tax from tax record
- −$580 /mo · $6,955/yr
- Insurance
- −$146
- HOA
- −$0
- Vacancy / Maint / Mgmt
- −$774
- Net cashflow
- $350
Break-even live
3-unit breakdown (identical units grouped — click to expand)
| Units | Beds | Baths | Est. rent |
|---|---|---|---|
| 2× units | 2.0 | 1 | $2,548 |
| #1 | 2.0 | 1 | $1,274 |
| #2 | 2.0 | 1 | $1,274 |
| 1× unit | 1.0 | 1 | $1,138 |
| Total (3 units) | $3,685 | ||
UW: 25.0% down · 7.5% · 30yr · 1.5% tax · 5.0% vac · 8.0% maint · 8.0% mgmt
Financing live
Cash to close
- Down payment
- $87,500
- Closing costs
- $10,500
- Reserves months
- —
- Total cash needed
- —
Loan-product check · same deal, 3 products live
Conventional
25% down · 7.5% · 30yr
- Down + closing
- —
- Monthly P&I
- —
- Monthly cashflow
- —
- DSCR
- —
- Eligible?
- —
Personal DTI + credit; lowest rate.
DSCR
20% down · 8.5% · 30yr
- Down + closing
- —
- Monthly P&I
- —
- Monthly cashflow
- —
- DSCR
- —
- Eligible?
- —
No personal income docs; deal must DSCR.
Hard money
10% down · 12.0% · 12mo
- Down + closing
- —
- Monthly P&I
- —
- Monthly cashflow
- —
- DSCR
- —
- Eligible?
- —
Short-term bridge; refi at stabilization.
Rent comps 6 comps
| Address | Beds | Baths | Sqft | Rent | $/sqft | DOM | Units | Dist |
|---|---|---|---|---|---|---|---|---|
| 1446 Hopkins Ave Lakewood, OH | 4.0 | 4.0 | 1880 | $1,950 | $1.04 | 43d | 1 | 0.32mi |
| 1574 Cohassett Ave Lakewood, OH | 4.0 | 1.5 | 1825 | $2,275 | $1.25 | 17d | 1 | 0.67mi |
| 2010 Chesterland Ave Unit 1496099P Lakewood, OH | 4.0 | 2.5 | 1463 | $7,556 | $5.16 | 12d | 1 | 1.01mi |
| 11021 Western Ave Cleveland, OH | 5.0 | 2.0 | 1776 | $1,950 | $1.10 | 1d | 1 | 1.22mi |
| 1962 W 96th St Cleveland, OH | 4.0 | 2.5 | 2534 | $4,500 | $1.78 | 3d | 1 | 1.26mi |
| 1265 Marlowe Ave Lakewood, OH | 4.0 | 1.0 | 1690 | $1,750 | $1.04 | 14d | 1 | 1.26mi |
Listing history 4 events
-
2026-06-18days on market $350,000 Active 3 DOM
-
2026-06-17days on market $350,000 Active 2 DOM
-
2026-06-15remarks 523-char remark
-
2026-06-15$350,000 Active 1 DOM
ⓘ Source: listings_history table (triggers on properties + properties_extension) + one-shot
backfill from property_details.listing_events for pre-trigger history.
Tax reassessment forecast OH · Partial reset (capped growth)
- Current annual tax
- $6,955 · $580/mo
- Projected year-2 tax
- $6,955 · $580/mo
- Expected delta
- $0/yr ($0/mo · 0.0%)
ⓘ Screening estimate from a state-policy table — verify with the county assessor before closing.
Climate risk First Street
- Flood 5/10 Major FEMA zone X (unshaded) · 66% chance over 30 yrs
- Wildfire 1/10 Low
- Heat 3/10 Moderate 8 d/yr ≥94°F today · 19 d/yr by 30 yrs out
- Wind 1/10 Low
- Air quality 3/10 Moderate 4 unhealthy d/yr today · 4 by 30 yrs out
Nearby sold comps map
Loading sold comps map…
Walkable amenities ~0.75 mi
Loading nearby amenities…
Taxation est. · year 1
- Rental income
- $44,220
- − Mortgage interest
- −$19,605
- − Property taxes
- −$6,955
- − Insurance
- −$1,750
- − Repairs & maintenance
- −$3,538
- − Management
- −$3,538
- − Depreciation
- −$10,182
- Taxable loss
- −$1,347
- Est. tax savings @ 24.0%
- +$323
- After-tax cash flow
- $4,527/yr
For passive investors: Depreciation is non-cash, so a rental often shows a tax loss while cash-flowing — sheltering income. Rental losses are passive: they offset passive income freely, and up to $25,000/yr can offset ordinary (W-2) income if you actively participate and your MAGI is under $100k (phasing out to $0 by $150k); unused losses carry forward. On sale, claimed depreciation is recaptured at up to 25%, and gains may owe capital-gains tax (a 1031 exchange can defer both). Figures are a year-1 estimate at your 24.0% rate — not tax advice; consult a CPA.
Schools (NCES district)
- District
- Lakewood City
- NCES district ID
- 3904419
- Math proficiency
- 60% ▼ -11.00%
- Reading proficiency
- 71% ▼ -3.00%
- Median HH income
- $45,181
- Composite
- 55.13/100
- National rank
- #1282
- State rank
- #213 of 656 in OH
Livability — Lakewood
- Score
- 88/100
- State rank
- #29
- US rank
- #249
Category grades
Schools grade is shown separately in the Schools card above.
Census & demographics
- Census place
- Lakewood, OH
- County
- Cuyahoga County · 1,090,369 people
- City population
- 50,018
- Metro
- Cleveland-Elyria, OH
- Population (ZIP)
- 50,018
- Household income
- $68,970
- Rent vs Own
- Severe rent burden
- 2271.0
Population outlook (Cuyahoga County) Hauer SSP2
- Today (2025)
- 1,244,621 people
- By 2030
- 1,230,093 · -1.2%
- By 2040
- 1,189,108 · -4.5%
- By 2050
- 1,145,706 · -7.9%
- By 2075
- 1,076,557 · -13.5%
- By 2100
- 978,987 · -21.3%
Race, ethnicity, and origin ACS 2023
- Neighborhood character
- Predominantly White (83%)
- Race & ethnicity
- White 83% Black 6% Two or more races 5% Hispanic / Latino 4% Asian 2%
- Common ancestry
- Romanian 8% Lithuanian 2% Slovak 2%
- Foreign-born
- 8% · Canada, China
- Languages at home
- 90% English-only · Arabic 3% Other Indo-European 2% Spanish 2%
Political lean MEDSL · Cuyahoga
- 2024 margin
- Solid D (+31.5) · D 65.4% · R 33.9%
- 2008→2024 swing
- -7.4pp toward R · 2008: 38.9pp · 2024: 31.5pp
- All cycles
- 2024: D+31.5 2020: D+34.1 2016: D+35.0 2012: D+38.7 2008: D+38.9
Not yet ingested
- Civics
- —
Market trends
- HPI YoY
- ▼ -347.35%
- Current HPI
- 266.5337
- Rent YoY
- ▲ 5.39%
- Metro
- Cleveland-Elyria, OH
- State GDP YoY
- ▲ 1.98%
- F500 in state
- 48
Industry mix (Fortune 500 HQ in OH)
| Industry | F500 HQs | Revenue |
|---|---|---|
| Insurance | 3 | $145B |
|
||
| Industrial Machinery | 3 | $49B |
|
||
| Financial Services | 3 | $24B |
|
||
| Consumer Goods | 2 | $93B |
|
||
| Aerospace / Defense | 2 | $47B |
|
||
| Utilities | 2 | $33B |
|
||
Price history
+438.5% since first listed20 events — show timeline
- 2026-06-15 Listed $350,000 MLSNOW
- 2024-04-16 Rental Removed $1,200 APPFOLIO
- 2024-04-10 Listed for Rent $1,200 APPFOLIO
- 2024-04-10 Rental Removed $1,200 APPFOLIO
- 2024-03-26 Price Changed $1,200 APPFOLIO
- 2024-03-13 Listed for Rent $1,250 APPFOLIO
- 2023-07-22 Rental Removed — APPFOLIO
- 2023-05-17 Sold (MLS) $305,000 MLSNOW
- 2023-04-05 Contingent — MLSNOW
- 2023-03-28 Price Changed $350,000 MLSNOW
- 2023-03-04 Relisted — MLSNOW
- 2023-03-02 Contingent — MLSNOW
- 2023-01-26 Listed $375,000 MLSNOW
- 2019-06-14 Sold (Public Records) $110,000 Public Records
- 2019-06-14 Sold (MLS) $110,000 MLSNOW
- 2019-06-13 Pending — MLSNOW
- 2019-06-08 Pending — MLSNOW
- 2019-06-06 Contingent — MLSNOW
- 2019-06-03 Listed $125,000 MLSNOW
- 1989-01-13 Sold (Public Records) $65,000 Public Records
Property tax history
+7.9%/yrLatest (2025): $6,955 · -0.2% YoY. Source: county tax records.
Cash-flow waterfall
monthlySold comps — $/sqft
last 12 mo · ≤1 miLoading sold comps…