5356 Cuthbert Ave · Baltimore, MD
Flood risk 1/10 · Minimal
- FEMA flood zone
- X (unshaded)
- Chance of flooding over 30 yrs
- 0.0%
- Est. flood insurance / yr
- $473 – $860
Fire risk 1/10 · Minimal
- Est. fire insurance / yr
- $755 – $1,403
Heat risk 7/10 · Major
- Hot days now (above 103°F)
- 7 days/yr
- Hot days in 30 yrs
- 15 days/yr
Wind risk 4/10 · Minor
- Chance of severe wind over 30 yrs
- 21.0%
Air-quality risk 3/10 · Minor
- Unhealthy air days now
- 3 days/yr
- Unhealthy air days in 30 yrs
- 4 days/yr
Risk factors via First Street. Map © Google.
Why this score? — see what drove the B+ grade
The composite is a weighted blend of 9 inputs, each scored 0–100. Each bar is that input's sub-score; the figure is the points it added to the 100-point composite (weight × sub-score).
- Cash flow +30.0/30.0
- ARV discount +15.0/15.0
- 1% rule +10.0/10.0
- DSCR +10.0/10.0
- Livability +3.8/5.0
- Rent growth +3.1/5.0
- Condition / age +2.5/5.0
- Schools +1.0/10.0
- Appreciation +0.0/10.0
$105,000
🖨 Deal sheet 📄 Offer letter ✓ Due diligence
Listing remarks MLS
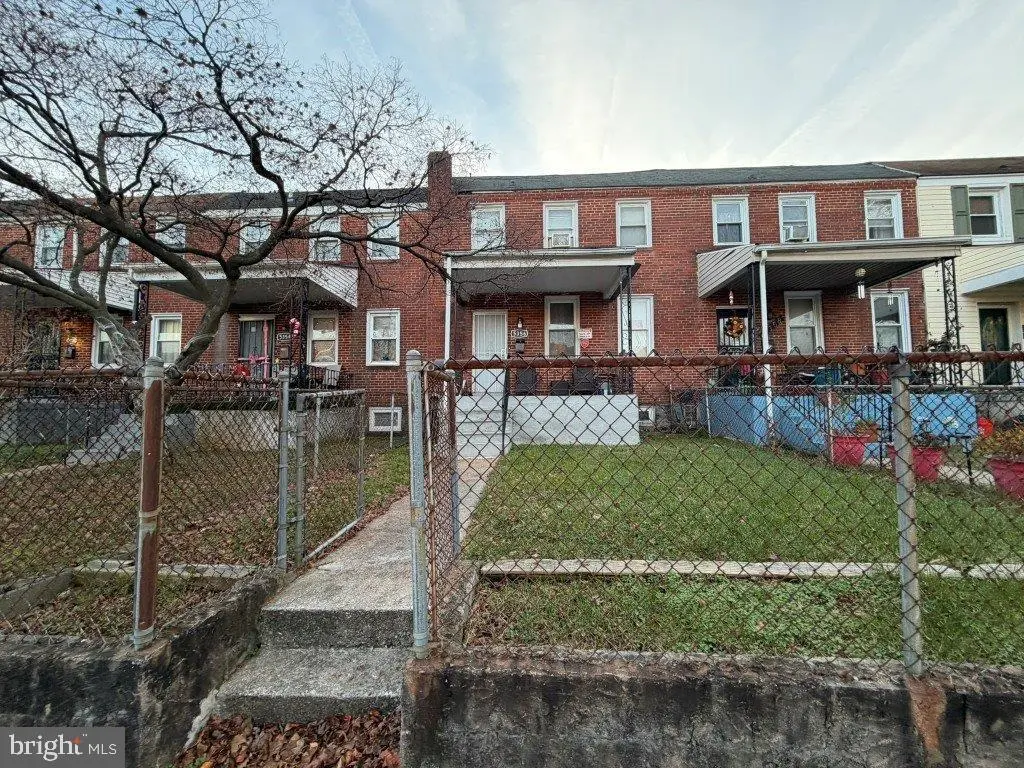
Two story porch front home located in the Arlington area of Baltimore City. This home is just minutes away from the famed Pimlico race track and is a great convenient location to get downtown - enjoy the nearby attractions such as Cylburn Arboretum, Reisterstown Road Plaza Shopping Mall & Cold Spring Park. Close by Sinai Hospital as well. AUCTION! Do not email any offers as the property is being sold via auction and all bids are to be submitted online during auction period. The sale will be subject to a 5% buyers premium pursuant to the Auction Terms & Conditions (minimums may apply). All auction bids will be processed subject to seller approval. Property information provided is estimated and not guaranteed (this includes condo fee/bedroom/bathroom count). Cash bids only as you cannot access the unit. BIDDING STARTS 03/01/2026. The buyer's agent is to pay a $200 plus sales tax offer management fee at closing of an accepted offer.
Key facts
- Porch front home
- Cylburn arboretum
- Cold spring park
Tags
Neighborhood map
What this means for you Summary
Snapshot
- This is a 3-bed/1.5-bath townhouse listed at $105k.
Deal economics
- At list price, monthly cash flow is $733 ($9k/yr) — positive.
- The deal already cash-flows at list — no discount required.
- Meets the 1% rule at list price ($2k rent vs $105k).
- Recommended offer: $96k (9.0% below list) — sets the bar for market timing.
- Cap rate 14.7% vs local median 6.0% in Baltimore — top-decile yield for the area; either an underpriced asset or a hidden risk that comps aren't pricing in. Stress-test before assuming the spread holds.
Location & tenants
- Location reads 76/100 on livability (#90 in MD, #3,396 nationally) — a middle-class / working-renter tenant base. Strengths: amenities A+, commute A+, housing A+; Watch: schools D, crime F.
- Baltimore City Public Schools (urban): math 7% / reading 16% proficiency, ranked #24 of 24 in MD (top 100%) — low school quality limits family demand, transient renter base, plan for 1-2y turnover; 79% free/reduced lunch — lower-income household profile, screen leases tightly.
- Market conditions: Rents rising (+2.4%/yr); 351 active listings in the ZIP; 9 comparable units currently listed for rent nearby; rentals at typical pace (median 24d on market — plan ~3-4 weeks tenant-placement turnaround); 1,273 units permitted in Baltimore city in 2024 (1,104 in 5+ unit buildings).
- This rent runs 43% of the median local income ($52k/yr) — at the standard rent-burdened threshold; future hikes will face affordability resistance.
Forward outlook
- Local home prices are declining (-3.0%/yr); year-one equity from $726 of loan paydown is wiped out by about $3k of value loss. Plan a longer hold.
- Baltimore County population projected to shrink 4% by 2050 — rents likely to lag national; underwrite the cash flow, not the appreciation.
- At projected returns (-3.0% appreciation + 2.4% rent growth), your $29k cash investment doubles in ~5 years — after that, you're playing with house money.
Negotiation context
- It's been on market 118 days — a 9% lower offer ($96k) is reasonable based on typical stale-listing flexibility.
- 3 sale attempts since 26y ago with the ask held roughly flat each time — persistent listings suggest the price (not the market) is what's stuck; bring a comps-based counter.
- Current owner paid $24k; list at $105k implies a 336% gain — meaningful room to come down on a strong offer.
Risks & watch-outs
- Watch-outs: built in 1940 — expect roof / HVAC / electrical / plumbing capex.
- Climate carrying-cost: extreme-heat days projected 7→15/yr by 2055 (HVAC capex compounding) — expect insurance premiums to compound above CPI over the hold.
Questions for the listing agent
- It's been on market 118 days. Have you received any prior offers? Is the seller open to a 9% concession, seller financing, or rate buy-down credit?
- Built in 1940 — when were the roof, HVAC, electrical panel, plumbing, and water heater last replaced?
- Why hasn't it sold? Are there any deal-killer items the seller is aware of (foundation, flood, title, zoning, code violations)?
- Is there a deadline driving the sale (1031 exchange, divorce, estate, relocation)? That informs how much negotiation room exists.
- Schools are D-rated, which usually means shorter tenancies and higher turnover. Who's the typical renter profile here, and what's been the actual vacancy rate?
- Crime grade is F in this area — have there been break-ins, vandalism, or insurance claims at this property in the last 3 years? What carrier currently insures it and at what premium?
- What's the average days-on-market for RENTAL listings here right now (not sales)? A rising rental-DOM trend means longer vacancies and softer asking-rent achievability than the comps imply.
- What's the recent tenant-quality profile in this submarket — average credit score on applications, eviction rate, late-payment / NSF rate, and stable-employment percentage? A property-management company in the area should have these aggregated.
- How much new for-sale + rental construction is in the pipeline within 1–3 miles? Heavy new supply typically softens prices + rents 12–24 months out; constrained supply supports both.
Investment metrics
- 1% rule
- 1.78% ✓
- Cap rate
- 14.67%
- Cash-on-cash
- 29.92%
- DSCR
- 2.33
- GRM
- 4.7
CMA / ARV
- ARV (median comp)
- $207,442
- List price
- $105,000
- Delta
- -49.38%
- Verdict
- UNDERPRICED
- Comps
- 20 within 1.0 mi
Show comp detail 12 sales within ~0.75 mi
| Address | Dist | Beds/Ba | Sqft | Sold | Price | $/sf | Match |
|---|---|---|---|---|---|---|---|
| 5410 Narcissus Ave | 0.06mi | 4/2.5 (+1) | 1,860 (+3%) | 3mo | $260,000 | $140 | 80 |
| 4040 Hayward Ave | 0.25mi | 3/0.5 | 1,783 (-1%) | 4mo | $67,500 | $38 | 79 |
| 3711 Spaulding Ave | 0.34mi | 3/2.0 | 1,800 (0%) | 7mo | $188,000 | $104 | 77 |
| 5422 Narcissus Ave | 0.08mi | 4/3.5 (+1) | 1,872 (+4%) | 4mo | $254,000 | $136 | 73 |
| 5404 Crismer Ave | 0.37mi | 3/2.0 | 1,667 (-7%) | 1mo | $239,900 | $144 | 67 |
| 5803 Jonquil Ave | 0.42mi | 4/2.0 (+1) | 1,816 (+1%) | 6mo | $260,000 | $143 | 67 |
| 5312 Gist Ave | 0.16mi | 4/2.5 (+1) | 1,620 (-10%) | 4mo | $240,000 | $148 | 63 |
| 3208 Ingleside Ave | 0.42mi | 3/1.5 | 1,620 (-10%) | 2mo | $225,000 | $139 | 62 |
| 3901 Mortimer Ave | 0.36mi | 3/2.0 | 1,664 (-8%) | 9mo | $151,000 | $91 | 61 |
| 5419 Lynview Ave | 0.43mi | 4/2.0 (+1) | 1,692 (-6%) | 7mo | $236,000 | $139 | 57 |
| 5806 Rubin Ave | 0.54mi | 3/2.5 | 1,884 (+5%) | 8mo | $200,000 | $106 | 57 |
| 3701 Manchester Ave | 0.58mi | 4/2.5 (+1) | 1,900 (+6%) | 4mo | $170,000 | $89 | 51 |
Match score weights: distance 35% · size 25% · config 20% · recency 20%. Top-matched comps best support the ARV.
Projected returns pro-forma
-3.0% appreciation · 2.41% rent growth · sell at horizon
- IRR
- 23.8%
- Equity multiple
- 1.97×
- Total profit
- $28,614
- Equity at exit
- $15,656
- IRR
- 31.3%
- Equity multiple
- 3.75×
- Total profit
- $80,727
- Equity at exit
- $9,078
Cash invested: $29,400 (down + closing). Projections, not guarantees.
Landlord ↔ Tenant lean methodology
- Overall (CITY)
- 12 Strongly Tenant-Friendly
- State Maryland
- 27 Tenant-Leaning · D+14
- County
- — inherits STATE
- City Baltimore
- 12 Strongly Tenant-Friendly · D+58
ZIP-level market 21215
- Rents YoY
- 2.4%
- Active inventory
- 351
- Price-to-rent
- 4.7×
Monthly cashflow live
- Estimated rent
- $1,867 high interval (Pro) →
- Mortgage (P&I)
- −$551
- Tax from tax record
- −$147 /mo · $1,766/yr
- Insurance
- −$44
- HOA
- −$0
- Vacancy / Maint / Mgmt
- −$392
- Net cashflow
- $733
Break-even live
UW: 25.0% down · 7.5% · 30yr · 1.5% tax · 5.0% vac · 8.0% maint · 8.0% mgmt
Financing live
Cash to close
- Down payment
- $26,250
- Closing costs
- $3,150
- Reserves months
- —
- Total cash needed
- —
Loan-product check · same deal, 3 products live
Conventional
25% down · 7.5% · 30yr
- Down + closing
- —
- Monthly P&I
- —
- Monthly cashflow
- —
- DSCR
- —
- Eligible?
- —
Personal DTI + credit; lowest rate.
DSCR
20% down · 8.5% · 30yr
- Down + closing
- —
- Monthly P&I
- —
- Monthly cashflow
- —
- DSCR
- —
- Eligible?
- —
No personal income docs; deal must DSCR.
Hard money
10% down · 12.0% · 12mo
- Down + closing
- —
- Monthly P&I
- —
- Monthly cashflow
- —
- DSCR
- —
- Eligible?
- —
Short-term bridge; refi at stabilization.
Rent comps 9 comps
| Address | Beds | Baths | Sqft | Rent | $/sqft | DOM | Units | Dist |
|---|---|---|---|---|---|---|---|---|
| 5807 Gist Ave Baltimore, MD | 2.0 | 1.5 | 2100 | $1,395 | $0.66 | 23d | 1 | 0.41mi |
| 3784 Columbus Dr Baltimore, MD | 4.0 | 2.0 | 1250 | $2,200 | $1.76 | 23d | 1 | 0.74mi |
| 4704 Pimlico Rd Baltimore, MD | 3.0 | 1.5 | 2006 | $1,800 | $0.90 | 23d | 1 | 0.85mi |
| 2805 Oakley Ave Baltimore, MD | 2.0 | 1.0 | 2400 | $1,500 | $0.62 | 14d | 1 | 0.95mi |
| 3709 Fords Ln Baltimore, MD | 4.0 | 3.5 | 2248 | $3,200 | $1.42 | 19d | 1 | 0.98mi |
| 4230 Towanda Ave Baltimore, MD | 3.0 | 2.0 | 1400 | $1,800 | $1.29 | 17d | 1 | 1.23mi |
| 3505 Clarks Ln Unit D2 Baltimore, MD | 3.0 | 2.0 | 1750 | $2,500 | $1.43 | 43d | 1 | 1.23mi |
| 2619 Loyola Northway Baltimore, MD | 3.0 | 2.0 | 1400 | $1,995 | $1.43 | 23d | 1 | 1.34mi |
| 3508 Grantley Rd Baltimore, MD | 2.0 | 1.0 | 1250 | $1,350 | $1.08 | 23d | 1 | 1.49mi |
Listing history 22 events
-
2026-06-18days on market $105,000 Active 118 DOM
-
2026-06-17days on market $105,000 Active 117 DOM
-
2026-06-16days on market $105,000 Active 116 DOM
-
2026-06-15days on market $105,000 Active 115 DOM
-
2026-06-13days on market $105,000 Active 113 DOM
-
2026-06-09days on market $105,000 Active 109 DOM
-
2026-06-08days on market $105,000 Active 108 DOM
-
2026-06-07days on market $105,000 Active 107 DOM
-
2026-06-04days on market $105,000 Active 104 DOM
-
2026-06-03days on market $105,000 Active 103 DOM
-
2026-06-02days on market $105,000 Active 102 DOM
-
2026-06-01days on market $105,000 Active 101 DOM
-
2026-05-31days on market $105,000 Active 100 DOM
-
2026-02-20$110,000 Active 955-char remark
Show marketing remark (955 chars)
Two story porch front home located in the Arlington area of Baltimore City. This home is just minutes away from the famed Pimlico race track and is a great convenient location to get downtown - enjoy the nearby attractions such as Cylburn Arboretum, Reisterstown Road Plaza Shopping Mall & Cold Spring Park. Close by Sinai Hospital as well. AUCTION! Do not email any offers as the property is being sold via auction and all bids are to be submitted online during auction period. The sale will be subject to a 5% buyers premium pursuant to the Auction Terms & Conditions (minimums may apply). All auction bids will be processed subject to seller approval. Property information provided is estimated and not guaranteed (this includes condo fee/bedroom/bathroom count). Cash bids only as you cannot access the unit. BIDDING STARTS 03/01/2026. The buyer's agent is to pay a $200 plus sales tax offer management fee at closing of an accepted offer.
-
2017-02-27soldstatus $24,100 93-char remark
Show marketing remark (93 chars)
Great potential in this brick townhome. Close to schools, shopping and public transportation.
-
2017-02-27soldstatus $24,100 Sold
Show marketing remark (93 chars)
Great potential in this brick townhome. Close to schools, shopping and public transportation.
-
2017-01-27status Contract
-
2017-01-04$20,000 Active
-
2001-03-15soldstatus $60,900
-
2001-03-14soldstatus $60,900
-
2000-12-15historical
-
2000-02-09$61,900
ⓘ Source: listings_history table (triggers on properties + properties_extension) + one-shot
backfill from property_details.listing_events for pre-trigger history.
Tax reassessment forecast MD · Partial reset (capped growth)
- Current annual tax
- $1,766 · $147/mo
- Projected year-2 tax
- $1,766 · $147/mo
- Expected delta
- $0/yr ($0/mo · 0.0%)
ⓘ Screening estimate from a state-policy table — verify with the county assessor before closing.
Climate risk First Street
- Flood 1/10 Low FEMA zone X (unshaded) · 0% chance over 30 yrs
- Wildfire 1/10 Low
- Heat 7/10 Severe 7 d/yr ≥103°F today · 15 d/yr by 30 yrs out
- Wind 4/10 Moderate 21% chance of damaging wind over 30 yrs
- Air quality 3/10 Moderate 3 unhealthy d/yr today · 4 by 30 yrs out
Nearby sold comps map
Loading sold comps map…
Walkable amenities ~0.75 mi
Loading nearby amenities…
Taxation est. · year 1
- Rental income
- $22,400
- − Mortgage interest
- −$5,882
- − Property taxes
- −$1,766
- − Insurance
- −$525
- − Repairs & maintenance
- −$1,792
- − Management
- −$1,792
- − Depreciation
- −$3,055
- Taxable income
- $7,589
- Est. tax owed @ 24.0%
- −$1,821
- After-tax cash flow
- $6,976/yr
For passive investors: Depreciation is non-cash, so a rental often shows a tax loss while cash-flowing — sheltering income. Rental losses are passive: they offset passive income freely, and up to $25,000/yr can offset ordinary (W-2) income if you actively participate and your MAGI is under $100k (phasing out to $0 by $150k); unused losses carry forward. On sale, claimed depreciation is recaptured at up to 25%, and gains may owe capital-gains tax (a 1031 exchange can defer both). Figures are a year-1 estimate at your 24.0% rate — not tax advice; consult a CPA.
Schools (NCES district)
- District
- Baltimore City Public Schools
- NCES district ID
- 2400090
- Math proficiency
- 7% ▼ -9.00%
- Reading proficiency
- 16% ▼ -5.00%
- Median HH income
- $42,108
- Composite
- 10.08/100
- National rank
- #9805
- State rank
- #24 of 24 in MD
Livability — Baltimore
- Score
- 76/100
- State rank
- #90
- US rank
- #3396
Category grades
Schools grade is shown separately in the Schools card above.
Census & demographics
- Census place
- Baltimore, MD
- County
- Baltimore City · 558,601 people
- City population
- 588,727
- Metro
- Baltimore-Columbia-Towson, MD
- Population (ZIP)
- 52,229
- Household income
- $51,587
- Rent vs Own
- Severe rent burden
- 3644.0
Population outlook (Baltimore County) Hauer SSP2
- Today (2025)
- 624,249 people
- By 2030
- 621,541 · -0.4%
- By 2040
- 609,756 · -2.3%
- By 2050
- 597,249 · -4.3%
- By 2075
- 552,236 · -11.5%
- By 2100
- 513,934 · -17.7%
Race, ethnicity, and origin ACS 2023
- Neighborhood character
- Predominantly Black (73%)
- Race & ethnicity
- Black 73% White 17% Hispanic / Latino 5% Two or more races 4% Asian 1%
- Common ancestry
- Scotch-Irish 2% Romanian 2% Italian 1%
- Foreign-born
- 9% · Canada, South Korea
- Languages at home
- 91% English-only · Spanish 4% French/Haitian/Cajun 1% Other Indo-European 1%
Political lean MEDSL · Baltimore
- 2024 margin
- Solid D (+73.0) · D 85.2% · R 12.2% · Other 2.6%
- 2008→2024 swing
- -2.5pp toward R · 2008: 75.5pp · 2024: 73.0pp
- All cycles
- 2024: D+73.0 2020: D+76.6 2016: D+74.6 2012: D+76.4 2008: D+75.5
Not yet ingested
- Civics
- —
Market trends
- HPI YoY
- ▼ -318.58%
- Current HPI
- 291.4926
- Rent YoY
- ▲ 2.41%
- Metro
- Baltimore-Columbia-Towson, MD
- State GDP YoY
- ▲ 2.97%
- F500 in state
- 12
Industry mix (Fortune 500 HQ in MD)
| Industry | F500 HQs | Revenue |
|---|---|---|
| Aerospace / Defense | 1 | $71B |
|
||
| Utilities | 1 | $25B |
|
||
| Hotels | 1 | $24B |
|
||
| Consumer Goods | 1 | $7B |
|
||
| Real Estate | 1 | $6B |
|
||
| Chemicals | 1 | $2B |
|
||
Price history
+77.7% since first listed9 events — show timeline
- 2026-02-20 Listed $110,000 BRIGHT MLS
- 2017-02-27 Sold (MLS) $24,100 MRIS
- 2017-02-27 Sold (MLS) $24,100 BRIGHT MLS
- 2017-01-27 Pending — MRIS
- 2017-01-04 Listed $20,000 MRIS
- 2001-03-15 Sold (MLS) $60,900 MRIS
- 2001-03-14 Sold (Public Records) $60,900 Public Records
- 2000-12-15 Delisted — MRIS
- 2000-02-09 Listed $61,900 MRIS
Property tax history
+0.4%/yrLatest (2025): $1,766 · +7.1% YoY. Source: county tax records.
Cash-flow waterfall
monthlySold comps — $/sqft
last 12 mo · ≤1 miLoading sold comps…