 Duplex
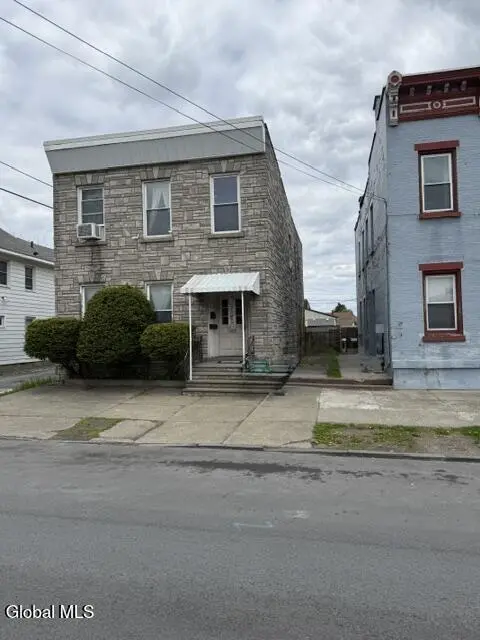
215 23rd St · Watervliet, NY
Flood risk 6/10 · Moderate
- FEMA flood zone
- X (unshaded)
- Chance of flooding over 30 yrs
- 0.66%
- Est. flood insurance / yr
- $473 – $860
Fire risk 3/10 · Minor
- Est. fire insurance / yr
- $691 – $1,283
Heat risk 4/10 · Minor
- Hot days now (above 96°F)
- 7 days/yr
- Hot days in 30 yrs
- 17 days/yr
Wind risk 3/10 · Minor
- Chance of severe wind over 30 yrs
- 6.0%
Air-quality risk 2/10 · Minimal
- Unhealthy air days now
- 0 days/yr
- Unhealthy air days in 30 yrs
- 1 days/yr
Risk factors via First Street. Map © Google.
Why this score? — see what drove the B+ grade
The composite is a weighted blend of 9 inputs, each scored 0–100. Each bar is that input's sub-score; the figure is the points it added to the 100-point composite (weight × sub-score).
- Cash flow +30.0/30.0
- ARV discount +15.0/15.0
- 1% rule +10.0/10.0
- DSCR +10.0/10.0
- Rent growth +4.2/5.0
- Livability +4.2/5.0
- Schools +3.4/10.0
- Condition / age +2.5/5.0
- Appreciation +0.0/10.0
$220,000
🖨 Deal sheet 📄 Offer letter ✓ Due diligence
Multi-family units
County records classify this as Multi-Family (2-4 Unit). Listing-text estimate: 2 units. confirmed
Listing remarks MLS
Great owner occupied. Needs a little TLC. This is an estate..sold 'as is' condition. Good Condition
Key facts
- Two-family home
- Convenient location
- Laundry hookups
Tags
Property features AI
Finance
- Other: Annual property tax listed
- Financial info: Two-unit property; Tenants pay hot water, heat, electricity, and gas; Owner pays water
Exterior
- Utilities: Public water; Public sewer
- Home design: Duplex; Living area approximately 2,592
- Construction: Stone construction; Rubber roof
- Exterior features: Back yard fencing; Lot approximately 0.06 acres
Interior
- Bedrooms: Unit 1: 2 bedrooms; Unit 2: 4 bedrooms
- Bathrooms: 2 full bathrooms total (one full bath on the 1st level, one full bath on the 2nd level); Unit 1: 1 full bath; Unit 2: 1 full bath
- Heating & cooling: Heating available; Electric and natural gas heating
- Interior features: Full unfinished basement
- Laundry & utility: Laundry closet
Neighborhood map
What this means for you Summary
Snapshot
- This is a 2 × 3-bed/1.0-bath units multifamily listed at $220k.
Deal economics
- At list price, monthly cash flow is $1k ($15k/yr) — positive. Per door: $634/mo.
- The deal already cash-flows at list — no discount required.
- Meets the 1% rule at list price ($4k rent vs $220k).
- Recommended offer: $213k (3.0% below list) — sets the bar for market timing.
- Cap rate 13.2% vs local median 5.9% in Watervliet — top-decile yield for the area; either an underpriced asset or a hidden risk that comps aren't pricing in. Stress-test before assuming the spread holds.
Location & tenants
- Location reads 84/100 on livability (#51 in NY, #786 nationally) — a professional / high-income tenant draw. Strengths: amenities A+, housing A+, health & safety A+; Watch: crime D+, schools D.
- Watervliet City School District (suburban): math 36% / reading 45% proficiency, ranked #524 of 590 in NY (top 89%) — families likely to look elsewhere, expect single-tenant / working-renter base with shorter leases.
- Market conditions: Rents rising fast (+6.6%/yr); 72 active listings in the ZIP; 4 comparable units currently listed for rent nearby; rentals at typical pace (median 19d on market — plan ~3-4 weeks tenant-placement turnaround); 675 units permitted in Albany County in 2024 (451 in 5+ unit buildings).
- At $3,654/mo this rent would consume 67% of the median local household income ($65k/yr) (locally 1224% of renters already pay >50% of income on rent) — very limited rent-growth headroom before tenants either downsize or default.
Forward outlook
- Local home prices are declining (-3.0%/yr); year-one equity from $2k of loan paydown is wiped out by about $7k of value loss. Plan a longer hold.
- Albany County population projected at +9% by 2050 — modest demand growth; plan on rents tracking national, not racing it.
- At projected returns (-3.0% appreciation + 6.6% rent growth), your $62k cash investment doubles in ~5 years — after that, you're playing with house money.
Negotiation context
- It's been on market 37 days — a 3% lower offer ($213k) is reasonable based on typical stale-listing flexibility.
- 2 sale attempts since 9y ago; this cycle's ask has dropped $50k (19%) from the opening price — seller is motivated, your offer sets the floor, not the list.
- Current owner paid $147k; 50% above their basis — modest negotiation headroom, anchor on the comps not their cost.
Risks & watch-outs
- Watch-outs: built in 1910 — expect roof / HVAC / electrical / plumbing capex.
- Climate carrying-cost: major flood risk — expect insurance premiums to compound above CPI over the hold.
Questions for the listing agent
- It's been on market 37 days. Have you received any prior offers? Is the seller open to a 3% concession, seller financing, or rate buy-down credit?
- Can we see the unit-by-unit rent roll, current vacancy, and any below-market leases? What's the average tenancy length?
- What capital expenditures (roof, boiler, parking lot, exteriors) have been made in the last 5 years, and what's planned in the next 2?
- Built in 1910 — when were the roof, HVAC, electrical panel, plumbing, and water heater last replaced?
- Is there a deadline driving the sale (1031 exchange, divorce, estate, relocation)? That informs how much negotiation room exists.
- Schools are D-rated, which usually means shorter tenancies and higher turnover. Who's the typical renter profile here, and what's been the actual vacancy rate?
- Crime grade is D in this area — have there been break-ins, vandalism, or insurance claims at this property in the last 3 years? What carrier currently insures it and at what premium?
- What's the average days-on-market for RENTAL listings here right now (not sales)? A rising rental-DOM trend means longer vacancies and softer asking-rent achievability than the comps imply.
- What's the recent tenant-quality profile in this submarket — average credit score on applications, eviction rate, late-payment / NSF rate, and stable-employment percentage? A property-management company in the area should have these aggregated.
- How much new apartment / multifamily construction is in the pipeline within 1–3 miles? Heavy new supply (>2% of stock underway) typically softens rents 12–24 months out; light construction supports rent growth.
Investment metrics
- 1% rule
- 1.66% ✓
- Cap rate
- 13.21%
- Cash-on-cash
- 24.70%
- DSCR
- 2.10
- GRM
- 5.0
CMA / ARV
- ARV (median comp)
- $417,345
- List price
- $220,000
- Delta
- -47.29%
- Verdict
- UNDERPRICED
- Comps
- 20 within 1.0 mi
Show comp detail 12 sales within ~0.75 mi
| Address | Dist | Beds/Ba | Sqft | Sold | Price | $/sf | Match |
|---|---|---|---|---|---|---|---|
| 2344 Broadway | 0.13mi | 6/2.0 (+1) | 2,582 (-0%) | 5mo | $215,000 | $83 | 84 |
| 610 23rd St | 0.21mi | 4/2.0 (-1) | 2,620 (+1%) | 8mo | $292,000 | $111 | 77 |
| 1834 6th Ave | 0.26mi | 6/2.0 (+1) | 2,680 (+3%) | 3mo | $250,000 | $93 | 75 |
| 2315 3rd Ave | 0.05mi | 6/2.0 (+1) | 2,334 (-10%) | 6mo | $221,100 | $95 | 71 |
| 902 19th St | 0.39mi | 6/2.5 (+1) | 2,560 (-1%) | 2mo | $250,000 | $98 | 71 |
| 1525 6th Ave | 0.44mi | 5/2.0 | 2,464 (-5%) | 2mo | $240,000 | $97 | 70 |
| 804 25th St | 0.35mi | 6/3.5 (+1) | 2,688 (+4%) | 6mo | $308,455 | $115 | 62 |
| 153 2nd St | 0.66mi | 5/2.0 | 2,640 (+2%) | 7mo | $350,000 | $133 | 60 |
| 1624 3rd Ave | 0.28mi | 5/3.0 | 2,957 (+14%) | 2mo | $330,000 | $112 | 57 |
| 1316 5th Ave | 0.64mi | 5/2.0 | 2,346 (-10%) | 5mo | $280,000 | $119 | 50 |
| 1801 9th Ave | 0.46mi | 6/3.0 (+1) | 2,244 (-13%) | 2mo | $340,000 | $152 | 46 |
| 1235 5th Ave | 0.70mi | 4/3.0 (-1) | 2,328 (-10%) | 6mo | $290,000 | $125 | 36 |
Match score weights: distance 35% · size 25% · config 20% · recency 20%. Top-matched comps best support the ARV.
Projected returns pro-forma
-3.0% appreciation · 6.61% rent growth · sell at horizon
- IRR
- 22.3%
- Equity multiple
- 1.96×
- Total profit
- $58,984
- Equity at exit
- $32,803
- IRR
- 32.7%
- Equity multiple
- 4.52×
- Total profit
- $216,621
- Equity at exit
- $19,022
Cash invested: $61,600 (down + closing). Projections, not guarantees.
Landlord ↔ Tenant lean methodology
- Overall (STATE)
- 15 Strongly Tenant-Friendly
- State New York
- 15 Strongly Tenant-Friendly · D+10
- County
- — inherits STATE
- City
- — inherits STATE
ZIP-level market 12189
- Home prices YoY
- -28.7%
- Rents YoY
- 6.6%
- Active inventory
- 72
- Price-to-rent
- 10.0×
Monthly cashflow live
- Estimated rent
- $3,654 high interval (Pro) →
- Mortgage (P&I)
- −$1,154
- Tax from tax record
- −$373 /mo · $4,478/yr
- Insurance
- −$92
- HOA
- −$0
- Vacancy / Maint / Mgmt
- −$767
- Net cashflow
- $1,268
Break-even live
2-unit breakdown (identical units grouped — click to expand)
| Units | Beds | Baths | Est. rent |
|---|---|---|---|
| 2× units | 3 | 1 | $3,654 |
| #1 | 3 | 1 | $1,827 |
| #2 | 3 | 1 | $1,827 |
| Total (2 units) | $3,654 | ||
UW: 25.0% down · 7.5% · 30yr · 1.5% tax · 5.0% vac · 8.0% maint · 8.0% mgmt
Financing live
Cash to close
- Down payment
- $55,000
- Closing costs
- $6,600
- Reserves months
- —
- Total cash needed
- —
Loan-product check · same deal, 3 products live
Conventional
25% down · 7.5% · 30yr
- Down + closing
- —
- Monthly P&I
- —
- Monthly cashflow
- —
- DSCR
- —
- Eligible?
- —
Personal DTI + credit; lowest rate.
DSCR
20% down · 8.5% · 30yr
- Down + closing
- —
- Monthly P&I
- —
- Monthly cashflow
- —
- DSCR
- —
- Eligible?
- —
No personal income docs; deal must DSCR.
Hard money
10% down · 12.0% · 12mo
- Down + closing
- —
- Monthly P&I
- —
- Monthly cashflow
- —
- DSCR
- —
- Eligible?
- —
Short-term bridge; refi at stabilization.
Rent comps 4 comps
| Address | Beds | Baths | Sqft | Rent | $/sqft | DOM | Units | Dist |
|---|---|---|---|---|---|---|---|---|
| 17 State St Troy, NY | 4.0 | 1.0–1.5 | 1810 | $3,635 | $2.01 | 14d | 7 | 0.54mi |
| 150 2nd St Troy, NY | 4.0 | 1.5 | 2442 | $3,000 | $1.23 | 21d | 1 | 0.69mi |
| 904 Peoples Ave Troy, NY | 4.0 | 1.0 | 1800 | $645 | $0.36 | 19d | 1 | 1.03mi |
| 51 14th St Unit 2 Troy, NY | 4.0 | 2.0 | 2000 | $725 | $0.36 | 19d | 1 | 1.25mi |
Listing history 19 events
-
2026-06-15status $220,000 Pending 37 DOM
-
2026-06-15days on market $220,000 Active 37 DOM
-
2026-06-14days on market $220,000 Active 35 DOM
-
2026-06-10days on market $220,000 Active 32 DOM
-
2026-06-09days on market $220,000 Active 31 DOM
-
2026-06-08days on market $220,000 Active 30 DOM
-
2026-06-07days on market $220,000 Active 29 DOM
-
2026-06-05days on market $220,000 Active 26 DOM
-
2026-06-03days on market $220,000 Active 25 DOM
-
2026-06-02days on market $220,000 Active 24 DOM
-
2026-06-01days on market $220,000 Active 23 DOM
-
2026-06-01price $220,000 Active 22 DOM
-
2026-05-31days on market $250,000 Active 22 DOM
-
2026-05-31days on market $250,000 Active 21 DOM
-
2026-05-17price $250,000 662-char remark
-
2026-05-09$270,000 Active 662-char remark
-
2017-06-12soldstatus $147,000 Closed (Final Sale) 100-char remark
Show marketing remark (100 chars)
Great owner occupied. Needs a little TLC. This is an estate..sold 'as is' condition. Good Condition
-
2017-03-30status Pend (Under Cntr) 100-char remark
Show marketing remark (100 chars)
Great owner occupied. Needs a little TLC. This is an estate..sold 'as is' condition. Good Condition
-
2017-03-27$159,000 New 100-char remark
Show marketing remark (100 chars)
Great owner occupied. Needs a little TLC. This is an estate..sold 'as is' condition. Good Condition
ⓘ Source: listings_history table (triggers on properties + properties_extension) + one-shot
backfill from property_details.listing_events for pre-trigger history.
Tax reassessment forecast NY · Partial reset (capped growth)
- Current annual tax
- $4,478 · $373/mo
- Projected year-2 tax
- $4,478 · $373/mo
- Expected delta
- $0/yr ($0/mo · 0.0%)
ⓘ Screening estimate from a state-policy table — verify with the county assessor before closing.
Climate risk First Street
- Flood 6/10 Major FEMA zone X (unshaded) · 66% chance over 30 yrs
- Wildfire 3/10 Moderate
- Heat 4/10 Moderate 7 d/yr ≥96°F today · 17 d/yr by 30 yrs out
- Wind 3/10 Moderate 6% chance of damaging wind over 30 yrs
- Air quality 2/10 Low 0 unhealthy d/yr today · 1 by 30 yrs out
Nearby sold comps map
Loading sold comps map…
Walkable amenities ~0.75 mi
Loading nearby amenities…
Taxation est. · year 1
- Rental income
- $43,848
- − Mortgage interest
- −$12,323
- − Property taxes
- −$4,478
- − Insurance
- −$1,100
- − Repairs & maintenance
- −$3,508
- − Management
- −$3,508
- − Depreciation
- −$6,400
- Taxable income
- $12,531
- Est. tax owed @ 24.0%
- −$3,007
- After-tax cash flow
- $12,210/yr
For passive investors: Depreciation is non-cash, so a rental often shows a tax loss while cash-flowing — sheltering income. Rental losses are passive: they offset passive income freely, and up to $25,000/yr can offset ordinary (W-2) income if you actively participate and your MAGI is under $100k (phasing out to $0 by $150k); unused losses carry forward. On sale, claimed depreciation is recaptured at up to 25%, and gains may owe capital-gains tax (a 1031 exchange can defer both). Figures are a year-1 estimate at your 24.0% rate — not tax advice; consult a CPA.
Schools (NCES district)
- District
- Watervliet City School District
- NCES district ID
- 3630210
- Math proficiency
- 36% ▼ -2.00%
- Reading proficiency
- 45% ▬ 0.00%
- Median HH income
- $43,276
- Composite
- 34.23/100
- National rank
- #5261
- State rank
- #524 of 590 in NY
Livability — Watervliet
- Score
- 84/100
- State rank
- #51
- US rank
- #786
Category grades
Schools grade is shown separately in the Schools card above.
Census & demographics
- Census place
- Watervliet, NY
- County
- Albany County · 196,626 people
- City population
- 18,656
- Metro
- Albany-Schenectady-Troy, NY
- Population (ZIP)
- 18,656
- Household income
- $65,276
- Rent vs Own
- Severe rent burden
- 1224.0
Population outlook (Albany County) Hauer SSP2
- Today (2025)
- 320,794 people
- By 2030
- 327,401 · +2.1%
- By 2040
- 338,218 · +5.4%
- By 2050
- 348,467 · +8.6%
- By 2075
- 381,693 · +19.0%
- By 2100
- 393,809 · +22.8%
Race, ethnicity, and origin ACS 2023
- Neighborhood character
- Predominantly White (72%)
- Race & ethnicity
- White 72% Two or more races 8% Asian 8% Black 8% Hispanic / Latino 6%
- Hispanic origin (detail)
- Mexican 2% Puerto Rican 2% Dominican 1%
- Common ancestry
- Lithuanian 6% Romanian 5% Scotch-Irish 4%
- Foreign-born
- 11% · Canada, China, South Korea
- Languages at home
- 88% English-only · Other Indo-European 4% Spanish 2% Other Asian/Pacific 2%
Political lean MEDSL · Albany
- 2024 margin
- Strong D (+25.8) · D 62.9% · R 37.1%
- 2008→2024 swing
- -3.6pp toward R · 2008: 29.4pp · 2024: 25.8pp
- All cycles
- 2024: D+25.8 2020: D+31.4 2016: D+24.3 2012: D+31.0 2008: D+29.4
Not yet ingested
- Civics
- —
Market trends
- HPI YoY
- ▼ -110.16%
- Current HPI
- 273.8109
- Rent YoY
- ▲ 6.61%
- Metro
- Albany-Schenectady-Troy, NY
- State GDP YoY
- ▲ 2.60%
- F500 in state
- 92
Industry mix (Fortune 500 HQ in NY)
| Industry | F500 HQs | Revenue |
|---|---|---|
| Financial Services | 10 | $950B |
|
||
| Consumer Goods | 9 | $162B |
|
||
| Insurance | 4 | $225B |
|
||
| Telecommunications | 2 | $144B |
|
||
| Pharmaceuticals | 2 | $112B |
|
||
| Media / Entertainment | 2 | $69B |
|
||
Price history
+38.4% since first listed7 events — show timeline
- 2026-06-15 Pending — Global MLS
- 2026-05-31 Price Changed $220,000 Global MLS
- 2026-05-17 Price Changed $250,000 Global MLS
- 2026-05-09 Listed $270,000 Global MLS
- 2017-06-12 Sold (MLS) $147,000 Global MLS
- 2017-03-30 Pending — Global MLS
- 2017-03-27 Listed $159,000 Global MLS
Property tax history
+15.4%/yrLatest (2025): $4,478 · +2.8% YoY. Source: county tax records.
Cash-flow waterfall
monthlySold comps — $/sqft
last 12 mo · ≤1 miLoading sold comps…