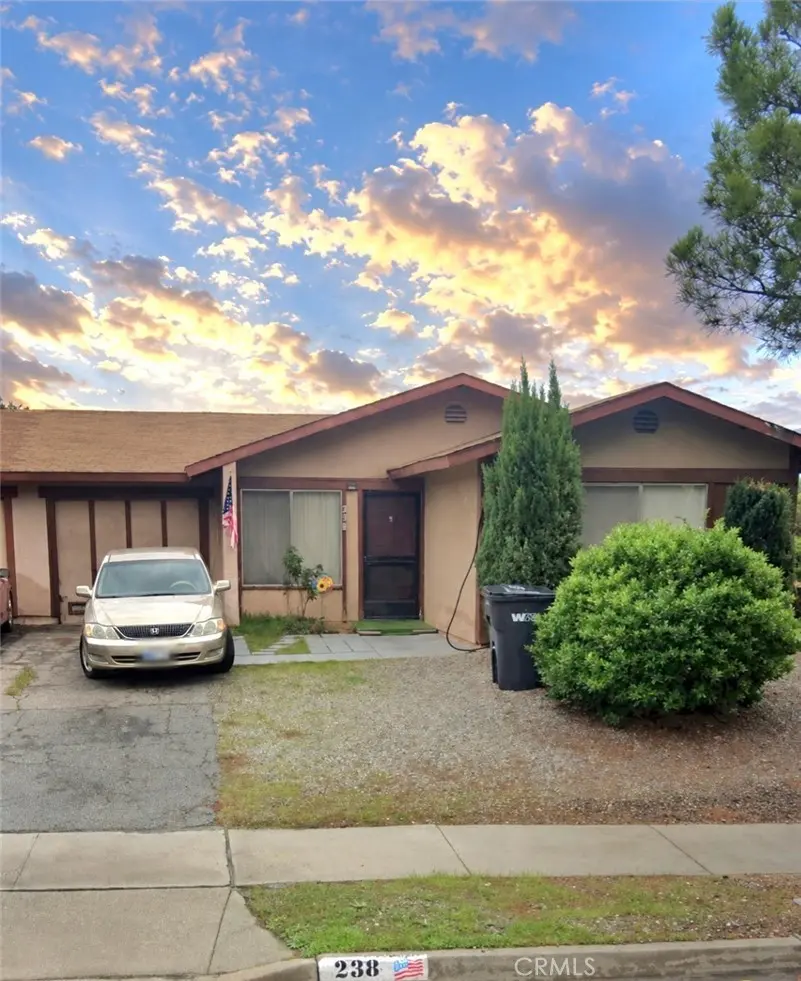
238 Dawn Way · Banning, CA
Flood risk 1/10 · Minimal
- FEMA flood zone
- X (unshaded)
- Chance of flooding over 30 yrs
- 0.0%
- Est. flood insurance / yr
- $507 – $1,088
Fire risk 10/10 · Severe
- Est. fire insurance / yr
- $659 – $1,223
Heat risk 6/10 · Moderate
- Hot days now (above 101°F)
- 7 days/yr
- Hot days in 30 yrs
- 20 days/yr
Wind risk 1/10 · Minimal
- Chance of severe wind over 30 yrs
- —
Air-quality risk 8/10 · Major
- Unhealthy air days now
- 18 days/yr
- Unhealthy air days in 30 yrs
- 23 days/yr
Risk factors via First Street. Map © Google.
Why this score? — see what drove the D grade
The composite is a weighted blend of 9 inputs, each scored 0–100. Each bar is that input's sub-score; the figure is the points it added to the 100-point composite (weight × sub-score).
- Cash flow +14.0/30.0
- ARV discount +10.5/15.0
- DSCR +4.2/10.0
- Schools +4.0/10.0
- Rent growth +3.4/5.0
- 1% rule +2.8/10.0
- Condition / age +2.5/5.0
- Livability +2.4/5.0
- Appreciation +0.0/10.0
$249,000
🖨 Deal sheet 📄 Offer letter ✓ Due diligence
Listing remarks
Delightful home in a quiet peaceful neighborhood for residents aged 55 and over! Excellent location near stores, restaurants, medical offices and hospital. Fenced backyard. Occupied by a long-time Sec 8 tenant, monthly rental income $790 a month.
Key facts
- Fenced backyard
- 4,356 sq ft lot
- Garage
Tags
Property features AI
Finance
- HOA & community: Part of Peacock Valley homeowners association; Annual association fee of $108; Senior community; Community has street lighting
Exterior
- Parking: Attached garage with 1 garage space (1 total parking space)
- Utilities: Public sewer; District/Public water
- Home design: House; Single-story; Attached property; No ADU
- Construction: Year built from assessor; 1 total unit
- Exterior features: Front and back yard; Level/flat lot; No pool
Interior
- Kitchen: Kitchen (details not specified)
- Bedrooms: 2 bedrooms on the main level; Primary bedroom
- Bathrooms: 1 full bathroom
- Heating & cooling: Central furnace; Cooling available (see remarks)
- Interior features: One-level home; Main-level entry; Has a view; One common wall (attached property)
- Laundry & utility: Laundry inside the unit
Neighborhood map
What this means for you Summary
Snapshot
- This is a 2-bed/1.0-bath single-family listed at $249k.
Deal economics
- At list price, monthly cash flow is $30 ($356/yr) — positive.
- The deal already cash-flows at list — no discount required.
- To meet the 1% rule (rent ≥ 1% of price), the offer needs to be $194k (22.0% below list).
- Recommended offer: $194k (22.0% below list) — sets the bar for 1% rule.
- Cap rate 6.4% vs local median 3.0% in Banning — top-decile yield for the area; either an underpriced asset or a hidden risk that comps aren't pricing in. Stress-test before assuming the spread holds.
Location & tenants
- Location reads 48/100 on livability (#1,192 in CA) — a working-class tenant base; expect higher turnover. Strengths: housing B+; Watch: crime C-, schools F, amenities F.
- Beaumont Unified (suburban): math 32% / reading 60% proficiency, ranked #168 of 517 in CA (top 32%) — families likely to look elsewhere, expect single-tenant / working-renter base with shorter leases.
- Market conditions: Rents rising (+3.6%/yr); 312 active listings in the ZIP; 9 comparable units currently listed for rent nearby; rentals at typical pace (median 15d on market — plan ~3-4 weeks tenant-placement turnaround); 9,195 units permitted in Riverside County in 2024 (1,512 in 5+ unit buildings).
- This rent runs 37% of the median local income ($63k/yr) — at the standard rent-burdened threshold; future hikes will face affordability resistance.
Forward outlook
- Local home prices are declining (-3.0%/yr); year-one equity from $2k of loan paydown is wiped out by about $7k of value loss. Plan a longer hold.
- Riverside County population projected at +22% by 2050 — long-run rental-demand tailwind backs the buy-and-hold thesis.
Negotiation context
- It's been on market 19 days — a 2% lower offer ($245k) is reasonable based on typical stale-listing flexibility.
- 2 sale attempts since 22y ago with the ask held roughly flat each time — persistent listings suggest the price (not the market) is what's stuck; bring a comps-based counter.
- Current owner paid $70k; list at $249k implies a 256% gain — meaningful room to come down on a strong offer.
Risks & watch-outs
- Climate carrying-cost: severe wildfire risk; extreme-heat days projected 7→20/yr by 2055 (HVAC capex compounding) — expect insurance premiums to compound above CPI over the hold.
Questions for the listing agent
- What does the HOA fee cover, when was the last increase, and are there any pending special assessments or reserve-fund shortfalls?
- Is there a deadline driving the sale (1031 exchange, divorce, estate, relocation)? That informs how much negotiation room exists.
- Schools are F-rated, which usually means shorter tenancies and higher turnover. Who's the typical renter profile here, and what's been the actual vacancy rate?
- The area grade is low — what's the realistic commute time and amenity access for the typical tenant pool here? Any planned neighborhood developments (good or bad) we should know about?
- What's the average days-on-market for RENTAL listings here right now (not sales)? A rising rental-DOM trend means longer vacancies and softer asking-rent achievability than the comps imply.
- What's the recent tenant-quality profile in this submarket — average credit score on applications, eviction rate, late-payment / NSF rate, and stable-employment percentage? A property-management company in the area should have these aggregated.
- How much new for-sale + rental construction is in the pipeline within 1–3 miles? Heavy new supply typically softens prices + rents 12–24 months out; constrained supply supports both.
Investment metrics
- 1% rule
- 0.78% ✗
- Cap rate
- 6.44%
- Cash-on-cash
- 0.51%
- DSCR
- 1.02
- GRM
- 10.7
CMA / ARV
- ARV (on-the-fly)
- $266,500
- Comps found
- 12
Show comp detail 12 sales within ~0.75 mi
| Address | Dist | Beds/Ba | Sqft | Sold | Price | $/sf | Match |
|---|---|---|---|---|---|---|---|
| 233 Janan Ct | 0.02mi | 2/1.0 | 820 (0%) | 8mo | $283,000 | $345 | 93 |
| 158 Beverly | 0.11mi | 2/1.0 | 831 (+1%) | 0mo | $270,000 | $325 | 92 |
| 5464 Evelyn Dr | 0.04mi | 2/1.0 | 851 (+4%) | 2mo | $275,000 | $323 | 90 |
| 204 Beverly Dr | 0.10mi | 2/1.0 | 820 (0%) | 8mo | $270,000 | $329 | 88 |
| 5360 Evelyn Dr | 0.09mi | 2/1.0 | 832 (+2%) | 7mo | $275,000 | $331 | 88 |
| 178 Clair Ct | 0.15mi | 2/1.0 | 820 (0%) | 9mo | $295,000 | $360 | 86 |
| 5406 Ellen Way | 0.07mi | 2/1.0 | 831 (+1%) | 11mo | $290,000 | $349 | 85 |
| 217 Beverly | 0.07mi | 2/1.0 | 891 (+9%) | 1mo | $270,000 | $303 | 81 |
| 377 Marian Way | 0.11mi | 2/1.0 | 820 (0%) | 18mo | $245,000 | $299 | 80 |
| 178 Janan Ct | 0.06mi | 2/1.0 | 891 (+9%) | 7mo | $250,000 | $281 | 77 |
| 234 Beverly Dr | 0.10mi | 2/1.0 | 891 (+9%) | 8mo | $270,000 | $303 | 74 |
| 181 Leslie Ct | 0.17mi | 2/1.0 | 891 (+9%) | 11mo | $270,000 | $303 | 69 |
Match score weights: distance 35% · size 25% · config 20% · recency 20%. Top-matched comps best support the ARV.
Projected returns pro-forma
-3.0% appreciation · 3.58% rent growth · sell at horizon
- IRR
- -15.0%
- Equity multiple
- 0.46×
- Total profit
- $-37,422
- Equity at exit
- $37,127
- IRR
- -5.6%
- Equity multiple
- 0.63×
- Total profit
- $-25,842
- Equity at exit
- $21,529
Cash invested: $69,720 (down + closing). Projections, not guarantees.
Landlord ↔ Tenant lean methodology
- Overall (STATE)
- 18 Strongly Tenant-Friendly
- State California
- 18 Strongly Tenant-Friendly · D+13
- County
- — inherits STATE
- City
- — inherits STATE
ZIP-level market 92220
- Rents YoY
- 3.6%
- Active inventory
- 312
- Price-to-rent
- 10.7×
Monthly cashflow live
- Estimated rent
- $1,941 high interval (Pro) →
- Mortgage (P&I)
- −$1,306
- Tax from tax record
- −$85 /mo · $1,025/yr
- Insurance
- −$104
- HOA
- −$9
- Vacancy / Maint / Mgmt
- −$408
- Net cashflow
- $30
Break-even live
UW: 25.0% down · 7.5% · 30yr · 1.5% tax · 5.0% vac · 8.0% maint · 8.0% mgmt
Financing live
Cash to close
- Down payment
- $62,250
- Closing costs
- $7,470
- Reserves months
- —
- Total cash needed
- —
Loan-product check · same deal, 3 products live
Conventional
25% down · 7.5% · 30yr
- Down + closing
- —
- Monthly P&I
- —
- Monthly cashflow
- —
- DSCR
- —
- Eligible?
- —
Personal DTI + credit; lowest rate.
DSCR
20% down · 8.5% · 30yr
- Down + closing
- —
- Monthly P&I
- —
- Monthly cashflow
- —
- DSCR
- —
- Eligible?
- —
No personal income docs; deal must DSCR.
Hard money
10% down · 12.0% · 12mo
- Down + closing
- —
- Monthly P&I
- —
- Monthly cashflow
- —
- DSCR
- —
- Eligible?
- —
Short-term bridge; refi at stabilization.
Rent comps 9 comps
| Address | Beds | Baths | Sqft | Rent | $/sqft | DOM | Units | Dist |
|---|---|---|---|---|---|---|---|---|
| 5464 Evelyn Dr Banning, CA | 2.0 | 1.0 | 851 | $1,900 | $2.23 | 43d | 1 | 0.02mi |
| 5464 Evelyn Dr Banning, CA | 2.0 | 1.0 | 851 | $1,900 | $2.23 | 15d | 1 | 0.02mi |
| 228 Janan Ct Banning, CA | 2.0 | 1.0 | 1100 | $2,100 | $1.91 | 1d | 1 | 0.07mi |
| 5001 W Wilson St Unit 103 Banning, CA | 1.0 | 1.0 | 751 | $1,600 | $2.13 | 1d | 1 | 0.37mi |
| 5001 W Wilson St Unit 227 Banning, CA | 2.0 | 1.0 | 833 | $1,700 | $2.04 | 2d | 1 | 0.37mi |
| 3911 W Ramsey St Unit 204 Banning, CA | 2.0 | 1.0 | 800 | $1,650 | $2.06 | 5d | 1 | 1.03mi |
| 1498 E 6th St Unit 4 Beaumont, CA | 1.0 | 1.0 | 675 | $1,500 | $2.22 | 18d | 1 | 1.05mi |
| 3880 W Jacinto View Rd Unit A Banning, CA | 2.0 | 2.0 | 780 | $1,395 | $1.79 | 24d | 1 | 1.05mi |
| 3860 W Jacinto View Rd Unit R Banning, CA | 1.0 | 1.0 | 594 | $1,100 | $1.85 | 43d | 1 | 1.08mi |
HOA detail
- Monthly dues
- $9 · $108/yr
Listing history 15 events
-
2026-06-18days on market $249,000 Active 19 DOM
-
2026-06-17days on market $249,000 Active 18 DOM
-
2026-06-16days on market $249,000 Active 17 DOM
-
2026-06-15days on market $249,000 Active 16 DOM
-
2026-06-13days on market $249,000 Active 14 DOM
-
2026-06-13pricedays on market $249,000 Active 13 DOM
-
2026-06-09days on market $254,000 Active 10 DOM
-
2026-06-08days on market $254,000 Active 9 DOM
-
2026-06-07days on market $254,000 Active 8 DOM
-
2026-06-04pricedays on market $254,000 Active 5 DOM
-
2026-06-03days on market $259,000 Active 4 DOM
-
2026-06-02days on market $259,000 Active 3 DOM
-
2026-06-01days on market $259,000 Active 2 DOM
-
2026-05-31remarks 247-char remark
-
2026-05-31$259,000 Active 1 DOM
ⓘ Source: listings_history table (triggers on properties + properties_extension) + one-shot
backfill from property_details.listing_events for pre-trigger history.
Tax reassessment forecast CA · Resets to sale price
- Current annual tax
- $1,025 · $85/mo
- Projected year-2 tax
- $1,892 · $158/mo
- Expected delta
- +$868/yr (+$72/mo · 84.6%)
ⓘ Screening estimate from a state-policy table — verify with the county assessor before closing.
Climate risk First Street
- Flood 1/10 Low FEMA zone X (unshaded) · 0% chance over 30 yrs
- Wildfire 10/10 Extreme
- Heat 6/10 Major 7 d/yr ≥101°F today · 20 d/yr by 30 yrs out
- Wind 1/10 Low
- Air quality 8/10 Severe 18 unhealthy d/yr today · 23 by 30 yrs out
Nearby sold comps map
Loading sold comps map…
Walkable amenities ~0.75 mi
Loading nearby amenities…
Taxation est. · year 1
- Rental income
- $23,296
- − Mortgage interest
- −$13,948
- − Property taxes
- −$1,025
- − Insurance
- −$1,245
- − Repairs & maintenance
- −$1,864
- − Management
- −$1,864
- − HOA
- −$108
- − Depreciation
- −$7,244
- Taxable loss
- −$4,001
- Est. tax savings @ 24.0%
- +$960
- After-tax cash flow
- $1,317/yr
For passive investors: Depreciation is non-cash, so a rental often shows a tax loss while cash-flowing — sheltering income. Rental losses are passive: they offset passive income freely, and up to $25,000/yr can offset ordinary (W-2) income if you actively participate and your MAGI is under $100k (phasing out to $0 by $150k); unused losses carry forward. On sale, claimed depreciation is recaptured at up to 25%, and gains may owe capital-gains tax (a 1031 exchange can defer both). Figures are a year-1 estimate at your 24.0% rate — not tax advice; consult a CPA.
Schools (NCES district)
- District
- Beaumont Unified
- NCES district ID
- 0604290
- Math proficiency
- 32% ▼ -4.00%
- Reading proficiency
- 60% ▲ 11.00%
- Median HH income
- $60,635
- Composite
- 40.37/100
- National rank
- #3736
- State rank
- #168 of 517 in CA
Livability — Banning
- Score
- 48/100
- State rank
- #1192
- US rank
- #26047
Category grades
Schools grade is shown separately in the Schools card above.
Census & demographics
- Census place
- Banning, CA
- County
- Riverside County · 2,287,001 people
- City population
- 33,755
- Metro
- Riverside-San Bernardino-Ontario, CA
- Population (ZIP)
- 33,755
- Household income
- $62,599
- Rent vs Own
- Severe rent burden
- 1146.0
Population outlook (Riverside County) Hauer SSP2
- Today (2025)
- 2,664,475 people
- By 2030
- 2,802,692 · +5.2%
- By 2040
- 3,050,904 · +14.5%
- By 2050
- 3,256,783 · +22.2%
- By 2075
- 3,655,058 · +37.2%
- By 2100
- 3,766,594 · +41.4%
Race, ethnicity, and origin ACS 2023
- Neighborhood character
- Diverse neighborhood (Simpson 0.64)
- Race & ethnicity
- Hispanic / Latino 48% White 35% Two or more races 21% Black 6% Asian 5% Native American 4%
- Hispanic origin (detail)
- Mexican 44%
- Common ancestry
- Italian 1% Romanian 1% Portuguese 1%
- Foreign-born
- 17% · Canada, South Korea, China
- Languages at home
- 65% English-only · Spanish 29% Tagalog/Filipino 1% Other Indo-European 1%
Political lean MEDSL · Riverside
- 2024 margin
- Toss-up / Even · D 48.0% · R 49.3% · Other 2.6%
- 2008→2024 swing
- -3.6pp toward R · 2008: 2.3pp · 2024: -1.3pp
- All cycles
- 2024: R+1.3 2020: D+8.0 2016: D+4.3 2012: R+0.4 2008: D+2.3
Not yet ingested
- Civics
- —
Market trends
- HPI YoY
- ▼ -343.32%
- Current HPI
- 342.4268
- Rent YoY
- ▲ 3.58%
- Metro
- Riverside-San Bernardino-Ontario, CA
- State GDP YoY
- ▲ 3.21%
- F500 in state
- 116
Industry mix (Fortune 500 HQ in CA)
| Industry | F500 HQs | Revenue |
|---|---|---|
| Technology | 27 | $1,492B |
|
||
| Financial Services | 3 | $174B |
|
||
| Retail | 3 | $44B |
|
||
| Insurance | 3 | $26B |
|
||
| Media / Entertainment | 2 | $115B |
|
||
| Pharmaceuticals / Biotech | 2 | $62B |
|
||
Price history
-69.9% since first listed16 events — show timeline
- 2026-05-30 Listed $259,000 CRMLS
- 2004-12-25 Listing Removed — CRMLS
- 2004-11-30 Listed $120,000 CRMLS
- 2003-09-26 Sold (Public Records) $70,000 Public Records
- 1991-12-13 Sold (Public Records) $1,000 Public Records
- 1991-10-29 Sold (Public Records) $20,000 Public Records
- 1991-10-29 Sold (Public Records) $3,500 Public Records
- 1991-10-22 Sold (Public Records) $40,500 Public Records
- 1989-06-23 Sold (Public Records) $75,900 Public Records
- 1989-05-26 Sold (Public Records) $36,500 Public Records
- 1989-01-06 Sold (Public Records) $36,500 Public Records
- 1988-10-04 Sold (Public Records) $36,500 Public Records
- 1988-08-29 Sold (Public Records) $19,680 Public Records
- 1988-08-02 Sold (Public Records) $22,500 Public Records
- 1988-06-23 Sold (Public Records) $75,500 Public Records
- 1988-05-27 Sold (Public Records) $860,000 Public Records
Property tax history
+0.3%/yrLatest (2025): $1,025 · +2.3% YoY. Source: county tax records.
Cash-flow waterfall
monthlySold comps — $/sqft
last 12 mo · ≤1 miLoading sold comps…