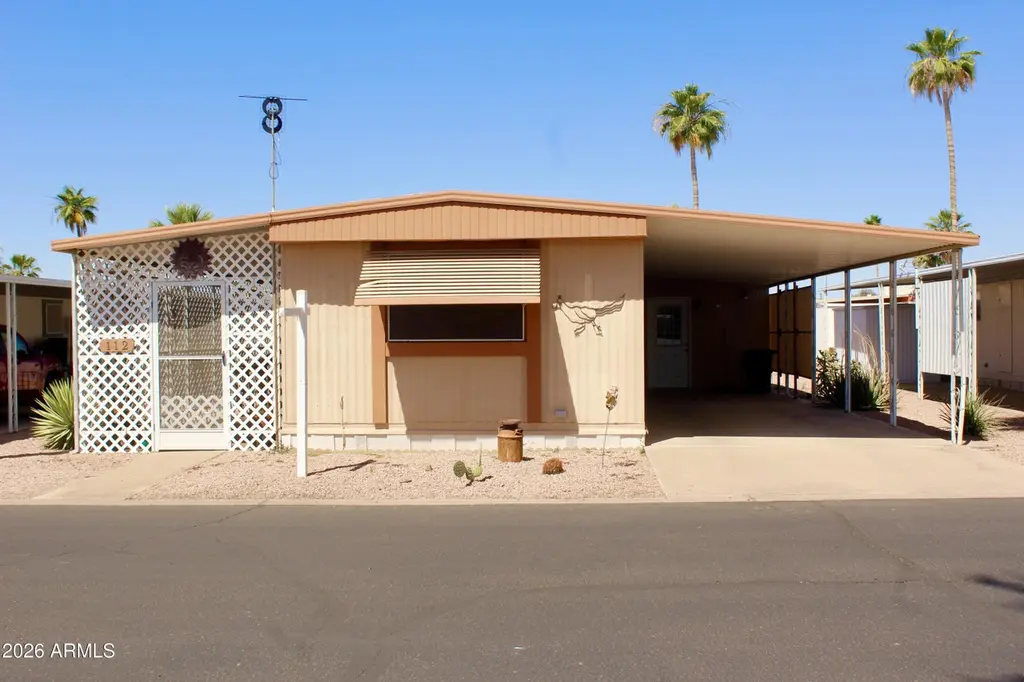
2605 S Tomahawk Rd #112 · Apache Junction, AZ
Flood risk 1/10 · Minimal
- FEMA flood zone
- X (unshaded)
- Chance of flooding over 30 yrs
- 0.0%
- Est. flood insurance / yr
- $507 – $1,088
Fire risk 5/10 · Moderate
- Est. fire insurance / yr
- $610 – $1,132
Heat risk 8/10 · Major
- Hot days now (above 111°F)
- 3 days/yr
- Hot days in 30 yrs
- 9 days/yr
Wind risk 1/10 · Minimal
- Chance of severe wind over 30 yrs
- —
Air-quality risk 3/10 · Minor
- Unhealthy air days now
- 3 days/yr
- Unhealthy air days in 30 yrs
- 4 days/yr
Risk factors via First Street. Map © Google.
Why this score? — see what drove the C grade
The composite is a weighted blend of 9 inputs, each scored 0–100. Each bar is that input's sub-score; the figure is the points it added to the 100-point composite (weight × sub-score).
- Cash flow +30.0/30.0
- 1% rule +10.0/10.0
- DSCR +10.0/10.0
- Livability +3.3/5.0
- Rent growth +2.9/5.0
- Condition / age +2.2/5.0
- Schools +1.5/10.0
- ARV discount +0.0/15.0
- Appreciation +0.0/10.0
$35,000
🖨 Deal sheet 📄 Offer letter ✓ Due diligence
Listing remarks
Take in the breathtaking views of the Superstition Mountains from this well-located 1-bedroom, 1-bath furnished home in the highly desirable Raindance Mobile Home Park. Designed for comfortable living, the home features an additional versatile room--perfect as a second bedroom, guest space, or potential rental opportunity. You'll also find a convenient shed, ideal for hobbies, extra storage, or even a private retreat. Enjoy an active, resort-style lifestyle with community amenities that include a sparkling pool, fitness center, pickleball courts, billiards room, and more. Perfect for those seeking scenic surroundings, functionality, and a vibrant community--all in one place.
Key facts
- 2 parking spots
- Community pool
- Built 1979
Property features AI
Finance
- Other: No visible trucks/trailers/RVs/boats allowed (association rule)
- HOA & community: Land lease (monthly); Land lease payment: $795 monthly; Association covers grounds maintenance, street maintenance, trash and water; Community amenities: pool, community spa (heated), pickleball courts, fitness center
Exterior
- Parking: 1 covered parking space; 1 open parking space; 1 carport space
- Security: Gated community
- Utilities: City water; Public sewer
- Home design: Manufactured/mobile home; Leasehold ownership; Mountain view; Asphalt road; Private maintained road
- Construction: Vinyl siding; Painted exterior; Foam roof
- Exterior features: Private streets; Screened-in patio; Partial fencing; Gravel/stone front and back; Desert front and back; East/West exposure; Storage (shed)
Interior
- Kitchen: Laminate counters; Pantry; Refrigerator
- Bedrooms: 1 possible bedroom
- Flooring: Laminate
- Bathrooms: 1 full bathroom
- Heating & cooling: Electric heating; Central air; Ceiling fan(s)
- Interior features: Eat-in kitchen; Furnished (see remarks); Pantry; Full bathroom in main bedroom; Accessible approach with ramp; Storage shed
- Laundry & utility: Community laundry (coin-op)
Neighborhood map
What this means for you Summary
Snapshot
- This is a 1-bed/1.0-bath manufactured listed at $35k. Condition is rated fair.
Deal economics
- At list price, monthly cash flow is $699 ($8k/yr) — positive.
- The deal already cash-flows at list — no discount required.
- Meets the 1% rule at list price ($1k rent vs $35k).
- Recommended offer: $34k (1.5% below list) — sets the bar for market timing.
- Cap rate 30.3% vs local median 3.5% in Apache Junction — top-decile yield for the area; either an underpriced asset or a hidden risk that comps aren't pricing in. Stress-test before assuming the spread holds.
Location & tenants
- Location reads 66/100 on livability (#70 in AZ) — a middle-class / working-renter tenant base. Strengths: cost of living A+, housing A+; Watch: crime D+, schools F, amenities F.
- Apache Junction Unified District (4443) (suburban): math 15% / reading 20% proficiency, ranked #195 of 249 in AZ (top 78%) — low school quality limits family demand, transient renter base, plan for 1-2y turnover.
- Market conditions: Rents rising (+1.6%/yr); 354 active listings in the ZIP; 8 comparable units currently listed for rent nearby; rentals leasing fast (median 5d on market — plan ~1-2 weeks tenant-placement turnaround); 9,504 units permitted in Pinal County in 2024 (776 in 5+ unit buildings).
Forward outlook
- Local home prices are declining (-3.0%/yr); year-one equity from $242 of loan paydown is wiped out by about $1k of value loss. Plan a longer hold.
- At projected returns (-3.0% appreciation + 1.6% rent growth), your $10k cash investment doubles in ~2 years — after that, you're playing with house money.
Negotiation context
- It's been on market 28 days — a 2% lower offer ($34k) is reasonable based on typical stale-listing flexibility.
Risks & watch-outs
- Climate carrying-cost: moderate wildfire risk; extreme-heat days projected 3→9/yr by 2055 (HVAC capex compounding) — expect insurance premiums to compound above CPI over the hold.
Questions for the listing agent
- Have any recent inspections been done? Can we get a copy of the seller's disclosures and any deferred-maintenance estimates?
- Built in 1979 — when were the roof, HVAC, electrical panel, plumbing, and water heater last replaced?
- Is there a deadline driving the sale (1031 exchange, divorce, estate, relocation)? That informs how much negotiation room exists.
- Schools are F-rated, which usually means shorter tenancies and higher turnover. Who's the typical renter profile here, and what's been the actual vacancy rate?
- Crime grade is D in this area — have there been break-ins, vandalism, or insurance claims at this property in the last 3 years? What carrier currently insures it and at what premium?
- What's the average days-on-market for RENTAL listings here right now (not sales)? A rising rental-DOM trend means longer vacancies and softer asking-rent achievability than the comps imply.
- What's the recent tenant-quality profile in this submarket — average credit score on applications, eviction rate, late-payment / NSF rate, and stable-employment percentage? A property-management company in the area should have these aggregated.
- How much new for-sale + rental construction is in the pipeline within 1–3 miles? Heavy new supply typically softens prices + rents 12–24 months out; constrained supply supports both.
Investment metrics
- 1% rule
- 3.40% ✓
- Cap rate
- 30.27%
- Cash-on-cash
- 85.65%
- DSCR
- 4.81
- GRM
- 2.4
CMA / ARV
- ARV (on-the-fly)
- $28,224
- Comps found
- 10
Show comp detail 10 sales within ~0.75 mi
| Address | Dist | Beds/Ba | Sqft | Sold | Price | $/sf | Match |
|---|---|---|---|---|---|---|---|
| 1517 E 22nd Ave | 0.29mi | 2/1.0 (+1) | 780 (-0%) | 4mo | $160,000 | $205 | 78 |
| 2605 S Tomahawk Rd #28 | 0.05mi | 1/1.0 | 728 (-7%) | 17mo | $26,500 | $36 | 72 |
| 2605 S Tomahawk Rd #99 | 0.00mi | 2/1.5 (+1) | 896 (+14%) | 3mo | $28,700 | $32 | 66 |
| 2348 S Pomo Ave | 0.34mi | 1/1.5 | 750 (-4%) | 16mo | $239,000 | $319 | 62 |
| 1524 E 23rd Ave | 0.28mi | 2/1.0 (+1) | 841 (+7%) | 13mo | $224,000 | $266 | 59 |
| 2605 S Tomahawk Rd #8 | 0.05mi | 2/2.0 (+1) | 896 (+14%) | 13mo | $26,500 | $30 | 54 |
| 1563 E 23rd Ave | 0.23mi | 1/1.0 | 705 (-10%) | 24mo | $198,000 | $281 | 53 |
| 1617 S Cortez Rd #26 | 0.68mi | 1/1.0 | 756 (-4%) | 17mo | $17,000 | $22 | 48 |
| 3405 S Tomahawk Rd #14 | 0.48mi | 2/2.0 (+1) | 896 (+14%) | 10mo | $15,000 | $17 | 37 |
| 3405 S Tomahawk Rd #111 | 0.48mi | 2/1.0 (+1) | 896 (+14%) | 15mo | $30,000 | $33 | 36 |
Match score weights: distance 35% · size 25% · config 20% · recency 20%. Top-matched comps best support the ARV.
Projected returns pro-forma
-3.0% appreciation · 1.57% rent growth · sell at horizon
- IRR
- 84.5%
- Equity multiple
- 4.80×
- Total profit
- $37,206
- Equity at exit
- $5,219
- IRR
- 87.4%
- Equity multiple
- 9.48×
- Total profit
- $83,096
- Equity at exit
- $3,026
Cash invested: $9,800 (down + closing). Projections, not guarantees.
Landlord ↔ Tenant lean methodology
- Overall (STATE)
- 87 Strongly Landlord-Friendly
- State Arizona
- 87 Strongly Landlord-Friendly · R+3
- County
- — inherits STATE
- City
- — inherits STATE
ZIP-level market 85119
- Home prices YoY
- -33.5%
- Rents YoY
- 1.6%
- Active inventory
- 354
- Price-to-rent
- 2.4×
Monthly cashflow live
- Estimated rent
- $1,192 high interval (Pro) →
- Mortgage (P&I)
- −$184
- Tax est. 1.5%
- −$44 /mo · $525/yr
- Insurance
- −$15
- HOA
- −$0
- Vacancy / Maint / Mgmt
- −$250
- Net cashflow
- $699
Break-even live
UW: 25.0% down · 7.5% · 30yr · 1.5% tax · 5.0% vac · 8.0% maint · 8.0% mgmt
Financing live
Cash to close
- Down payment
- $8,750
- Closing costs
- $1,050
- Reserves months
- —
- Total cash needed
- —
Loan-product check · same deal, 3 products live
Conventional
25% down · 7.5% · 30yr
- Down + closing
- —
- Monthly P&I
- —
- Monthly cashflow
- —
- DSCR
- —
- Eligible?
- —
Personal DTI + credit; lowest rate.
DSCR
20% down · 8.5% · 30yr
- Down + closing
- —
- Monthly P&I
- —
- Monthly cashflow
- —
- DSCR
- —
- Eligible?
- —
No personal income docs; deal must DSCR.
Hard money
10% down · 12.0% · 12mo
- Down + closing
- —
- Monthly P&I
- —
- Monthly cashflow
- —
- DSCR
- —
- Eligible?
- —
Short-term bridge; refi at stabilization.
Rent comps 8 comps
| Address | Beds | Baths | Sqft | Rent | $/sqft | DOM | Units | Dist |
|---|---|---|---|---|---|---|---|---|
| 1540 E 25th Ave Apache Junction, AZ | 2.0 | 1.0 | 850 | $995 | $1.17 | 12d | 1 | 0.15mi |
| 501 E Quail Ave Apache Junction, AZ | 2.0 | 1.0 | 720 | $1,150 | $1.60 | 3d | 1 | 0.80mi |
| 501 E Quail Ave Apache Junction, AZ | 2.0 | 1.0 | 720 | $1,150 | $1.60 | 5d | 1 | 0.80mi |
| 403 E Quail Ave Apache Junction, AZ | 2.0 | 1.0 | 800 | $1,350 | $1.69 | 4d | 1 | 0.85mi |
| 1297 E Broadway Ave Apache Junction, AZ | 1.0–3.0 | 1.0–2.0 | 954 | $1,524 | $1.60 | 1d | 29 | 1.03mi |
| 975 S Royal Palm Rd Apache Junction, AZ | 2.0–3.0 | 2.0 | 1000 | $1,325 | $1.32 | 2d | 13 | 1.14mi |
| 452 E 10th Ave Unit 104 Apache Junction, AZ | 2.0 | 1.0 | 783 | $1,000 | $1.28 | 22d | 1 | 1.26mi |
| 2061 S Apache Dr Unit 1 Apache Junction, AZ | 2.0 | 1.0 | 800 | $1,095 | $1.37 | 5d | 1 | 1.27mi |
Listing history 14 events
-
2026-06-18days on market $35,000 Active 28 DOM
-
2026-06-17days on market $35,000 Active 27 DOM
-
2026-06-16days on market $35,000 Active 26 DOM
-
2026-06-15days on market $35,000 Active 25 DOM
-
2026-06-13days on market $35,000 Active 23 DOM
-
2026-06-09days on market $35,000 Active 19 DOM
-
2026-06-08days on market $35,000 Active 18 DOM
-
2026-06-07days on market $35,000 Active 17 DOM
-
2026-06-04days on market $35,000 Active 14 DOM
-
2026-06-03pricedays on market $35,000 Active 13 DOM
-
2026-06-02days on market $40,000 Active 12 DOM
-
2026-06-01days on market $40,000 Active 11 DOM
-
2026-05-31days on market $40,000 Active 10 DOM
-
2026-05-22$40,000 Active
ⓘ Source: listings_history table (triggers on properties + properties_extension) + one-shot
backfill from property_details.listing_events for pre-trigger history.
Climate risk First Street
- Flood 1/10 Low FEMA zone X (unshaded) · 0% chance over 30 yrs
- Wildfire 5/10 Major
- Heat 8/10 Severe 3 d/yr ≥111°F today · 9 d/yr by 30 yrs out
- Wind 1/10 Low
- Air quality 3/10 Moderate 3 unhealthy d/yr today · 4 by 30 yrs out
Nearby sold comps map
Loading sold comps map…
Walkable amenities ~0.75 mi
Loading nearby amenities…
Taxation est. · year 1
- Rental income
- $14,299
- − Mortgage interest
- −$1,961
- − Property taxes
- −$525
- − Insurance
- −$175
- − Repairs & maintenance
- −$1,144
- − Management
- −$1,144
- − Depreciation
- −$1,018
- Taxable income
- $8,332
- Est. tax owed @ 24.0%
- −$2,000
- After-tax cash flow
- $6,394/yr
For passive investors: Depreciation is non-cash, so a rental often shows a tax loss while cash-flowing — sheltering income. Rental losses are passive: they offset passive income freely, and up to $25,000/yr can offset ordinary (W-2) income if you actively participate and your MAGI is under $100k (phasing out to $0 by $150k); unused losses carry forward. On sale, claimed depreciation is recaptured at up to 25%, and gains may owe capital-gains tax (a 1031 exchange can defer both). Figures are a year-1 estimate at your 24.0% rate — not tax advice; consult a CPA.
Condition & rehab AI · 12 photos
This manufactured home requires moderate repairs and maintenance to improve its condition and value. Key areas for improvement include the kitchen cabinets, bathroom fixtures, and exterior siding. Paint and window treatments can significantly enhance the home's curb appeal and interior aesthetics.
Repairs flagged
- Moderate Kitchen cabinets — Worn and dated appearance
- Moderate Bathroom fixtures — Visible wear and tear
- Minor Exterior siding — Weathered appearance
Value-add opportunities
- Both Paint interior walls — Fresh paint enhances curb appeal and interior aesthetics
- Both Replace worn blinds and curtains — Fresh window treatments improve curb appeal and interior aesthetics
- Both Landscaping and curb appeal improvements — Enhances curb appeal and makes the property more inviting
Renovation cost estimate screening
| Repair item | Severity | Est. cost |
|---|---|---|
| Kitchen cabinets · Worn and dated appearance | Moderate | $3,000–15,000 |
| Bathroom fixtures · Visible wear and tear | Moderate | $3,000–15,000 |
| Exterior siding · Weathered appearance | Minor | $500–3,000 |
| Total estimated repair cost · 3 items | $6,500–33,000 |
Value-add ROI direction
- Both Paint interior walls — Fresh paint enhances curb appeal and interior aesthetics ↑
- Both Replace worn blinds and curtains — Fresh window treatments improve curb appeal and interior aesthetics ↑
- Both Landscaping and curb appeal improvements — Enhances curb appeal and makes the property more inviting ↑
ⓘ Cost ranges are severity-bucket heuristics (US national rule-of-thumb). Get contractor quotes + a written scope before underwriting a rehab budget.
Schools (NCES district)
- District
- Apache Junction Unified District (4443)
- NCES district ID
- 0400790
- Math proficiency
- 15% ▼ -17.00%
- Reading proficiency
- 20% ▼ -13.00%
- Median HH income
- $44,930
- Composite
- 15.34/100
- National rank
- #9325
- State rank
- #195 of 249 in AZ
Livability — Apache Junction
- Score
- 66/100
- State rank
- #70
- US rank
- #11242
Category grades
Schools grade is shown separately in the Schools card above.
Census & demographics
- County
- Pinal County · 399,947 people
- City population
- 56,611
- Metro
- Phoenix-Mesa-Chandler, AZ
- Population (ZIP)
- 25,420
- Household income
- $71,585
- Rent vs Own
- Severe rent burden
- 305.0
Population outlook (Pinal County) Hauer SSP2
- Today (2025)
- 437,574 people
- By 2030
- 446,903 · +2.1%
- By 2040
- 452,589 · +3.4%
- By 2050
- 444,126 · +1.5%
- By 2075
- 430,300 · -1.7%
- By 2100
- 393,536 · -10.1%
Race, ethnicity, and origin ACS 2023
- Neighborhood character
- Predominantly White (74%)
- Race & ethnicity
- White 74% Hispanic / Latino 19% Two or more races 12% Black 2% Asian 1%
- Hispanic origin (detail)
- Mexican 17%
- Common ancestry
- Slovak 5% Portuguese 3% Lithuanian 3%
- Foreign-born
- 8% · Canada
- Languages at home
- 87% English-only · Spanish 11%
Political lean MEDSL · Pinal
- 2024 margin
- Strong R (+22.1) · D 38.5% · R 60.6%
- 2008→2024 swing
- -7.6pp toward R · 2008: -14.5pp · 2024: -22.1pp
- All cycles
- 2024: R+22.1 2020: R+17.3 2016: R+19.3 2012: R+17.1 2008: R+14.5
Not yet ingested
- Civics
- —
Market trends
- HPI YoY
- ▼ -138.19%
- Current HPI
- 274.3808
- Rent YoY
- ▲ 1.57%
- Metro
- Phoenix-Mesa-Chandler, AZ
- State GDP YoY
- ▲ 4.54%
- F500 in state
- 20
Industry mix (Fortune 500 HQ in AZ)
| Industry | F500 HQs | Revenue |
|---|---|---|
| Technology | 2 | $13B |
|
||
| Mining / Metals | 1 | $23B |
|
||
| Environmental Services | 1 | $16B |
|
||
| Metals / Steel | 1 | $14B |
|
||
| Technology Distribution | 1 | $9B |
|
||
| Homebuilding | 1 | $8B |
|
||
Price history
1 event — show timeline
- 2026-05-22 Listed $40,000 ARMLS
Cash-flow waterfall
monthlySold comps — $/sqft
last 12 mo · ≤1 miLoading sold comps…