32533 Rainy Ln · Killian, LA
Flood risk 9/10 · Severe
- FEMA flood zone
- X (shaded)
- Chance of flooding over 30 yrs
- 0.99%
- Est. flood insurance / yr
- $507 – $1,088
Fire risk 2/10 · Minimal
- Est. fire insurance / yr
- $1,269 – $2,357
Heat risk 8/10 · Major
- Hot days now (above 108°F)
- 7 days/yr
- Hot days in 30 yrs
- 21 days/yr
Wind risk 9/10 · Severe
- Chance of severe wind over 30 yrs
- 99.0%
Air-quality risk 2/10 · Minimal
- Unhealthy air days now
- 0 days/yr
- Unhealthy air days in 30 yrs
- 1 days/yr
Risk factors via First Street. Map © Google.
Why this score? — see what drove the D grade
The composite is a weighted blend of 9 inputs, each scored 0–100. Each bar is that input's sub-score; the figure is the points it added to the 100-point composite (weight × sub-score).
- Appreciation +10.0/10.0
- Cash flow +8.9/30.0
- ARV discount +7.5/15.0
- Schools +4.0/10.0
- Livability +2.9/5.0
- Rent growth +2.5/5.0
- Condition / age +2.5/5.0
- DSCR +2.4/10.0
- 1% rule +1.6/10.0
$199,000
🖨 Deal sheet (PDF) 📄 Offer letter ✓ Due diligence
Listing remarks MLS
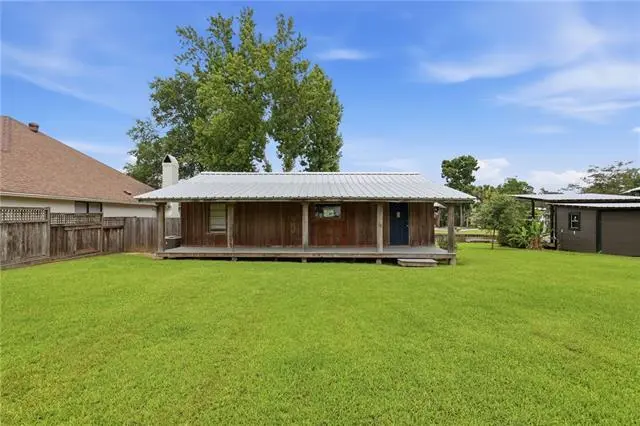
Located at 32533 Rainy Lane in Springfield, this beautifully updated, turn-key waterfront cottage offers the ultimate river lifestyle with seamless access by boat or automobile. Situated on a deep, navigable canal just moments from popular riverfront bars and restaurants, this inviting property features a bright, open-concept living area highlighted by a stunning modern kitchen with updated cabinetry, a breakfast bar, and rustic exposed wood beams. Large double French doors transition seamlessly to an expansive, covered patio perfect for catching canal breezes, enjoying evening sunsets, and entertaining. Complete with a spacious, manicured lawn and private bulkheaded water frontage, this move-in ready retreat perfectly balances contemporary indoor comfort with classic, laid-back Louisiana waterfront living.
Key facts
- Navigable canal
- Covered patio
- Modern kitchen
Tags
Property features AI
Finance
- Other: Listing is marked as human-modified
- Financial info: No financial details provided
- HOA & community: No HOA or community fee information provided
Exterior
- Parking: Driveway
- Security: No security features provided
- Utilities: Public water; Public sewer
- Home design: Single-story home; Raised foundation; Wood siding exterior; Metal roof; Rectangular lot located outside city limits; Lot dimensions approximately 40 x 139 x 90 x 124 (0.25 acre)
- Construction: Built with wood siding; Metal roof; Raised foundation
- Exterior features: Covered porch; Dock; Canal access waterfront
Interior
- Kitchen: No kitchen appliance details provided
- Bedrooms: Information about specific bedroom count or levels not provided
- Flooring: No flooring information provided
- Bathrooms: One full bathroom
- Heating & cooling: Central heating; Central air conditioning
- Interior features: Six total rooms; Very good condition
- Laundry & utility: No laundry or utility appliance details provided
Neighborhood map
What this means for you Summary
Snapshot
- This is a 2-bed/1.0-bath single-family listed at $199k.
Deal economics
- At list price, monthly cash flow is $-228 ($-3k/yr) — negative.
- To cash-flow at today's rent, offer at most $159k (20.3% below list).
- To meet the 1% rule (rent ≥ 1% of price), the offer needs to be $131k (34.0% below list).
- Recommended offer: $131k (34.0% below list) — sets the bar for 1% rule.
- Cap rate 5.3% vs local median 2.2% in Killian — top-decile yield for the area; either an underpriced asset or a hidden risk that comps aren't pricing in. Stress-test before assuming the spread holds.
Location & tenants
- Location reads 57/100 on livability (#333 in LA) — a working-class tenant base; expect higher turnover. Strengths: crime A+, cost of living A+; Watch: health & safety C-, schools F, amenities F.
- Livingston Parish (suburban): math 40% / reading 52% proficiency, ranked #13 of 98 in LA (top 13%) — families likely to look elsewhere, expect single-tenant / working-renter base with shorter leases.
- Market conditions: 214 active listings in the ZIP; 794 units permitted in Livingston Parish in 2024 (99 in 5+ unit buildings).
Forward outlook
- In year one you build about $21k of equity ($1k loan paydown + $20k appreciation (10.0% local appreciation)).
- Livingston County population projected at +27% by 2050 — long-run rental-demand tailwind backs the buy-and-hold thesis.
- By year 2, paydown + projected appreciation supports a ~$34k cash-out refi (75% LTV) — recoverable capital for the next deal without selling this one.
Negotiation context
- Only 9 days on market — expect competitive offers; lowballing is unlikely to land.
- 7 sale attempts since 2y ago with the ask held roughly flat each time — persistent listings suggest the price (not the market) is what's stuck; bring a comps-based counter.
Risks & watch-outs
- Watch-outs: flood insurance adds $66/mo.
- Climate carrying-cost: severe flood risk; severe wind risk, 99% chance of damaging wind over 30y; extreme-heat days projected 7→21/yr by 2055 (HVAC capex compounding) — expect insurance premiums to compound above CPI over the hold.
Questions for the listing agent
- What do current leases actually rent for vs. the listed asking? Can we see a recent rent roll and the last 12 months of T-12 income?
- What's the actual annual flood-insurance premium (NFIP or private), and is the property in a SFHA with mandatory coverage?
- Is there a deadline driving the sale (1031 exchange, divorce, estate, relocation)? That informs how much negotiation room exists.
- Schools are F-rated, which usually means shorter tenancies and higher turnover. Who's the typical renter profile here, and what's been the actual vacancy rate?
- The area grade is low — what's the realistic commute time and amenity access for the typical tenant pool here? Any planned neighborhood developments (good or bad) we should know about?
- What's the average days-on-market for RENTAL listings here right now (not sales)? A rising rental-DOM trend means longer vacancies and softer asking-rent achievability than the comps imply.
- What's the recent tenant-quality profile in this submarket — average credit score on applications, eviction rate, late-payment / NSF rate, and stable-employment percentage? A property-management company in the area should have these aggregated.
- How much new for-sale + rental construction is in the pipeline within 1–3 miles? Heavy new supply typically softens prices + rents 12–24 months out; constrained supply supports both.
Investment metrics
- 1% rule
- 0.66% ✗
- Cap rate
- 5.32%
- Cash-on-cash
- -3.49%
- DSCR
- 0.84
- GRM
- 12.6
CMA / ARV
- ARV (on-the-fly)
- $103,960
- Comps found
- 3
Show comp detail 3 sales within ~0.75 mi
| Address | Dist | Beds/Ba | Sqft | Sold | Price | $/sf | Match |
|---|---|---|---|---|---|---|---|
| 20566 Carpenter Rd | 0.25mi | 2/1.0 | 1,000 (+9%) | 23mo | $160,000 | $160 | 55 |
| 32894 Lower Rome Rd | 0.50mi | 2/1.0 | 999 (+9%) | 15mo | $57,000 | $57 | 50 |
| 32906 Lower Rome Rd | 0.50mi | 2/2.0 | 977 (+6%) | 17mo | $110,000 | $113 | 48 |
Match score weights: distance 35% · size 25% · config 20% · recency 20%. Top-matched comps best support the ARV.
Projected returns pro-forma
10.0% appreciation · 3.0% rent growth · sell at horizon
- IRR
- 20.8%
- Equity multiple
- 2.68×
- Total profit
- $93,782
- Equity at exit
- $179,275
- IRR
- 18.9%
- Equity multiple
- 6.16×
- Total profit
- $287,523
- Equity at exit
- $386,613
Cash invested: $55,720 (down + closing). Projections, not guarantees.
Landlord ↔ Tenant lean methodology
- Overall (STATE)
- 90 Strongly Landlord-Friendly
- State Louisiana
- 90 Strongly Landlord-Friendly · R+12
- County
- — inherits STATE
- City
- — inherits STATE
ZIP-level market 70462
- Active inventory
- 214
- Price-to-rent
- 12.6×
Monthly cashflow live
- Estimated rent
- $1,314 medium interval (Pro) →
- Mortgage (P&I)
- −$1,044
- Tax from tax record
- −$74 /mo · $884/yr
- Insurance
- −$83
- Flood insurance flood zone
- −$66 /mo · $798/yr
- HOA
- −$0
- Vacancy / Maint / Mgmt
- −$276
- Net cashflow
- $-228
Break-even live
Sensitivity live
| Price | -10% $-116 | -5% $-172 | +0% $-228 | +5% $-285 | +10% $-341 |
|---|---|---|---|---|---|
| Rent | -10% $-332 | -5% $-280 | +0% $-228 | +5% $-177 | +10% $-125 |
| Rate | -1.0pp $-128 | -0.5pp $-178 | base $-228 | +0.5pp $-280 | +1.0pp $-332 |
UW: 25.0% down · 7.5% · 30yr · 1.5% tax · 5.0% vac · 8.0% maint · 8.0% mgmt
Financing live
Cash to close
- Down payment
- $49,750
- Closing costs
- $5,970
- Reserves months
- —
- Total cash needed
- —
Loan-product check · same deal, 3 products live
Conventional
25% down · 7.5% · 30yr
- Down + closing
- —
- Monthly P&I
- —
- Monthly cashflow
- —
- DSCR
- —
- Eligible?
- —
Personal DTI + credit; lowest rate.
DSCR
20% down · 8.5% · 30yr
- Down + closing
- —
- Monthly P&I
- —
- Monthly cashflow
- —
- DSCR
- —
- Eligible?
- —
No personal income docs; deal must DSCR.
Hard money
10% down · 12.0% · 12mo
- Down + closing
- —
- Monthly P&I
- —
- Monthly cashflow
- —
- DSCR
- —
- Eligible?
- —
Short-term bridge; refi at stabilization.
Listing history 8 events
-
2026-06-18days on market $199,000 Active 9 DOM
-
2026-06-17days on market $199,000 Active 8 DOM
-
2026-06-16days on market $199,000 Active 7 DOM
-
2026-06-15days on market $199,000 Active 6 DOM
-
2026-06-14days on market $199,000 Active 4 DOM
-
2026-06-13days on market $199,000 Active 3 DOM
-
2026-06-10remarks 699-char remark
-
2026-06-10$199,000 Active 1 DOM
ⓘ Source: listings_history table (triggers on properties + properties_extension) + one-shot
backfill from property_details.listing_events for pre-trigger history.
Tax reassessment forecast LA · Resets to sale price
- Current annual tax
- $884 · $74/mo
- Projected year-2 tax
- $1,094 · $91/mo
- Expected delta
- +$211/yr (+$18/mo · 23.8%)
ⓘ Screening estimate from a state-policy table — verify with the county assessor before closing.
Climate risk First Street
- Flood 9/10 Extreme FEMA zone X (shaded) · 99% chance over 30 yrs
- Wildfire 2/10 Low
- Heat 8/10 Severe 7 d/yr ≥108°F today · 21 d/yr by 30 yrs out
- Wind 9/10 Extreme 99% chance of damaging wind over 30 yrs
- Air quality 2/10 Low 0 unhealthy d/yr today · 1 by 30 yrs out
Nearby sold comps map
Loading sold comps map…
Walkable amenities ~0.75 mi
Loading nearby amenities…
Taxation est. · year 1
- Rental income
- $15,769
- − Mortgage interest
- −$11,147
- − Property taxes
- −$884
- − Insurance
- −$1,792
- − Repairs & maintenance
- −$1,262
- − Management
- −$1,262
- − Depreciation
- −$5,789
- Taxable loss
- −$6,366
- Est. tax savings @ 24.0%
- +$1,528
- After-tax cash flow
- $-1,214/yr
For passive investors: Depreciation is non-cash, so a rental often shows a tax loss while cash-flowing — sheltering income. Rental losses are passive: they offset passive income freely, and up to $25,000/yr can offset ordinary (W-2) income if you actively participate and your MAGI is under $100k (phasing out to $0 by $150k); unused losses carry forward. On sale, claimed depreciation is recaptured at up to 25%, and gains may owe capital-gains tax (a 1031 exchange can defer both). Figures are a year-1 estimate at your 24.0% rate — not tax advice; consult a CPA.
Schools (NCES district)
- District
- Livingston Parish
- NCES district ID
- 2201020
- Math proficiency
- 40% ▼ -38.00%
- Reading proficiency
- 52% ▼ -32.00%
- Median HH income
- $56,755
- Composite
- 40.07/100
- National rank
- #3811
- State rank
- #13 of 98 in LA
Livability — Killian
- Score
- 57/100
- State rank
- #333
- US rank
- #22333
Category grades
Schools grade is shown separately in the Schools card above.
Census & demographics
- Census place
- Killian, LA
- Population (ZIP)
- 5,428
Population outlook (Livingston County) Hauer SSP2
- Today (2025)
- 158,511 people
- By 2030
- 168,241 · +6.1%
- By 2040
- 186,252 · +17.5%
- By 2050
- 201,516 · +27.1%
- By 2075
- 231,217 · +45.9%
- By 2100
- 241,697 · +52.5%
Race, ethnicity, and origin ACS 2023
- Neighborhood character
- Predominantly White (83%)
- Race & ethnicity
- White 83% Black 9% Two or more races 4% Hispanic / Latino 3% Asian 2%
- Common ancestry
- Lithuanian 15% Slovak 2%
- Foreign-born
- 1% · Canada
- Languages at home
- 98% English-only · Spanish 2%
Political lean MEDSL · Livingston
- 2024 margin
- Solid R (+68.5) · D 15.1% · R 83.6% · Other 1.3%
- 2008→2024 swing
- +3.4pp toward D · 2008: -71.9pp · 2024: -68.5pp
- All cycles
- 2024: R+68.5 2020: R+70.0 2016: R+72.5 2012: R+70.4 2008: R+71.9
Not yet ingested
- Civics
- —
Market trends
- HPI YoY
- ▲ 115.93%
- Current HPI
- 389.85
- Rent YoY
- —
- Metro
- —
- State GDP YoY
- ▲ 3.29%
- F500 in state
- 10
Industry mix (Fortune 500 HQ in LA)
| Industry | F500 HQs | Revenue |
|---|---|---|
| Telecommunications | 2 | $23B |
|
||
| Utilities | 1 | $12B |
|
||
| Wholesale / Distribution | 1 | $5B |
|
||
| Advertising | 1 | $2B |
|
||
Price history
-9.5% since first listed10 events — show timeline
- 2026-06-09 Listed $199,000 GSREIN
- 2026-06-09 Listed $199,000 AcadianaMLS
- 2025-06-10 Relisted — GBRMLS
- 2025-05-29 Pending — GBRMLS
- 2025-04-11 Listed $215,000 GBRMLS
- 2025-04-11 Listed $215,000 AcadianaMLS
- 2024-08-31 Delisted — GBRMLS
- 2024-02-16 Listed $225,000 AcadianaMLS
- 2024-02-16 Listed $225,000 GBRMLS
- 2020-09-10 Sold (Public Records) $220,000 Public Records
Property tax history
-2.0%/yrLatest (2024): $884 · +20.2% YoY. Source: county tax records.
Cash-flow waterfall
monthlySold comps — $/sqft
last 12 mo · ≤1 miLoading sold comps…