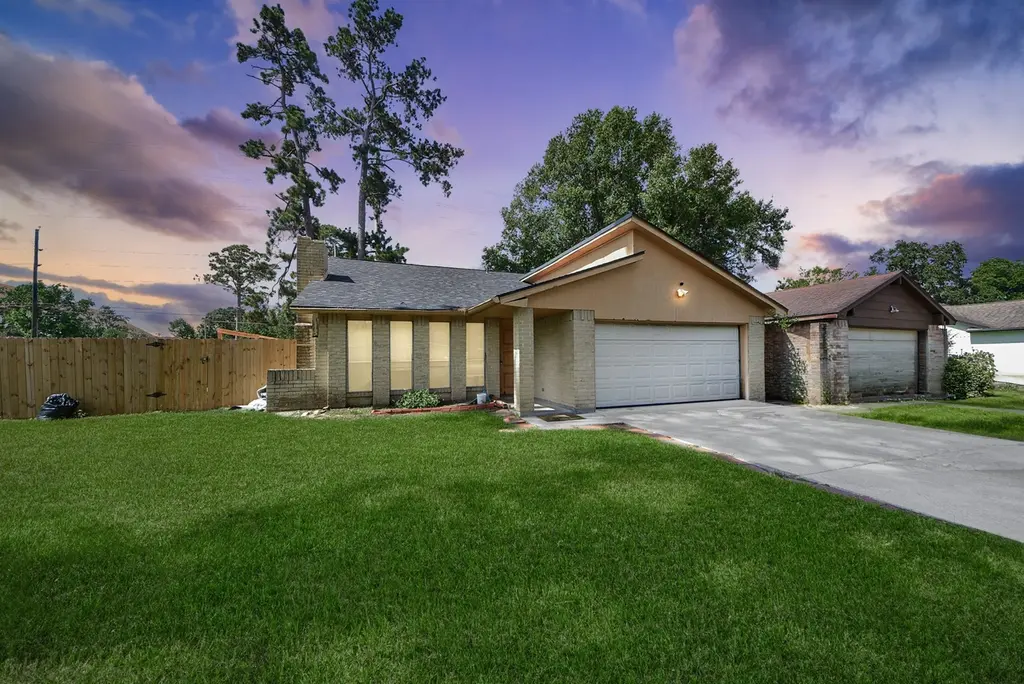
6952 Foxwaithe Ln · Houston, TX
Flood risk 3/10 · Minor
- FEMA flood zone
- X (unshaded)
- Chance of flooding over 30 yrs
- 0.2%
- Est. flood insurance / yr
- $507 – $1,088
Fire risk 3/10 · Minor
- Est. fire insurance / yr
- $1,222 – $2,270
Heat risk 9/10 · Severe
- Hot days now (above 110°F)
- 7 days/yr
- Hot days in 30 yrs
- 24 days/yr
Wind risk 9/10 · Severe
- Chance of severe wind over 30 yrs
- 99.0%
Air-quality risk 3/10 · Minor
- Unhealthy air days now
- 3 days/yr
- Unhealthy air days in 30 yrs
- 3 days/yr
Risk factors via First Street. Map © Google.
Why this score? — see what drove the F grade
The composite is a weighted blend of 9 inputs, each scored 0–100. Each bar is that input's sub-score; the figure is the points it added to the 100-point composite (weight × sub-score).
- Cash flow +8.1/30.0
- ARV discount +4.7/15.0
- Appreciation +4.6/10.0
- Livability +3.7/5.0
- 1% rule +3.4/10.0
- Rent growth +3.0/5.0
- Condition / age +2.5/5.0
- DSCR +2.1/10.0
- Schools +1.5/10.0
$209,000
🖨 Deal sheet 📄 Offer letter ✓ Due diligence
Listing remarks
Opportunity awaits! Situated on a desirable corner lot just steps from the community pool, shopping, dining, and convenient access to FM 1960, this home offers incredible potential for investors or buyers looking to add their personal touch. Major updates have already been completed, including a new roof (2025), new A/C system (2025), and a fully replaced fence, providing peace of mind and reducing major upfront expenses. With cosmetic updates to the kitchen and primary suite, this property presents an excellent opportunity to build equity and create a space tailored to your vision. Don’t miss this chance to invest in a 3 bedroom 2 bathroom well-located home with solid fundamentals an
Key facts
- New a/c system
- Fully replaced fence
- Community pool
Tags
Property features AI
Finance
- HOA & community: Foxwood HOA (annual fee $350)
Exterior
- Parking: Attached garage with 2 spaces
- Utilities: Public water; Public sewer
- Home design: Residential property; Built in 1979; Slab foundation; Composition roof
- Construction: Brick and wood siding construction
- Exterior features: Fully fenced private yard; Back yard fencing; Cleared corner lot in a subdivision; Community pool
Interior
- Kitchen: Dishwasher; Electric cooktop; Free-standing range; Garbage disposal; Refrigerator
- Flooring: Carpet; Tile
- Bathrooms: 2 full bathrooms
- Heating & cooling: Central heating (electric); Central air (electric)
- Interior features: Pots & pan drawers; Tub with shower; Kitchen/dining combo; Wood-burning fireplace (1)
- Laundry & utility: Washer hookup; Electric dryer hookup
Neighborhood map
What this means for you Summary
Snapshot
- This is a 3-bed/2.0-bath single-family listed at $209k.
Deal economics
- At list price, monthly cash flow is $-203 ($-2k/yr) — negative.
- To cash-flow at today's rent, offer at most $173k (17.1% below list).
- To meet the 1% rule (rent ≥ 1% of price), the offer needs to be $175k (16.2% below list).
- Recommended offer: $173k (17.1% below list) — sets the bar for cash-flow.
- Cap rate 5.1% vs local median 3.2% in Houston — top-decile yield for the area; either an underpriced asset or a hidden risk that comps aren't pricing in. Stress-test before assuming the spread holds.
Location & tenants
- Location reads 74/100 on livability (#184 in TX, #4,771 nationally) — a middle-class / working-renter tenant base. Strengths: amenities A+, cost of living A+, housing A+; Watch: crime F.
- Aldine ISD (suburban): math 16% / reading 21% proficiency, ranked #790 of 826 in TX (top 96%) — low school quality limits family demand, transient renter base, plan for 1-2y turnover; 79% free/reduced lunch — lower-income household profile, screen leases tightly.
- Zoned schools: Cypresswood El (math 17% / reading 20%, grade F, #3,759 of 4,322 statewide, top 88%, 767 students, 88% FRL); Jones Middle (math 16% / reading 24%, grade F, #1,428 of 1,662 statewide, top 87%, 1,348 students, 86% FRL); Nimitz H S (math 17% / reading 25%, grade F, #1,385 of 1,632 statewide, top 85%, 2,772 students, 85% FRL).
- Market conditions: Rents rising (+2.2%/yr); 306 active listings in the ZIP; 19 comparable units currently listed for rent nearby; rentals at typical pace (median 24d on market — plan ~3-4 weeks tenant-placement turnaround); 42% of comp listings sitting > 30 days — soft ceiling on asking rent; 29,883 units permitted in Harris County in 2024 (8,621 in 5+ unit buildings).
- This rent runs 32% of the median local income ($65k/yr) — at the standard rent-burdened threshold; future hikes will face affordability resistance.
Forward outlook
- Local home prices are declining (-0.8%/yr); year-one equity from $1k of loan paydown is wiped out by about $2k of value loss. Plan a longer hold.
- Harris County population projected at +47% by 2050 — long-run rental-demand tailwind backs the buy-and-hold thesis.
Negotiation context
- Only 2 days on market — expect competitive offers; lowballing is unlikely to land.
Risks & watch-outs
- Climate carrying-cost: severe wind risk, 99% chance of damaging wind over 30y; extreme-heat days projected 7→24/yr by 2055 (HVAC capex compounding) — expect insurance premiums to compound above CPI over the hold.
Questions for the listing agent
- What do current leases actually rent for vs. the listed asking? Can we see a recent rent roll and the last 12 months of T-12 income?
- Built in 1979 — when were the roof, HVAC, electrical panel, plumbing, and water heater last replaced?
- What does the HOA fee cover, when was the last increase, and are there any pending special assessments or reserve-fund shortfalls?
- Is there a deadline driving the sale (1031 exchange, divorce, estate, relocation)? That informs how much negotiation room exists.
- Schools are D-rated, which usually means shorter tenancies and higher turnover. Who's the typical renter profile here, and what's been the actual vacancy rate?
- Crime grade is F in this area — have there been break-ins, vandalism, or insurance claims at this property in the last 3 years? What carrier currently insures it and at what premium?
- The area grade is low — what's the realistic commute time and amenity access for the typical tenant pool here? Any planned neighborhood developments (good or bad) we should know about?
- What's the average days-on-market for RENTAL listings here right now (not sales)? A rising rental-DOM trend means longer vacancies and softer asking-rent achievability than the comps imply.
- What's the recent tenant-quality profile in this submarket — average credit score on applications, eviction rate, late-payment / NSF rate, and stable-employment percentage? A property-management company in the area should have these aggregated.
- How much new for-sale + rental construction is in the pipeline within 1–3 miles? Heavy new supply typically softens prices + rents 12–24 months out; constrained supply supports both.
Investment metrics
- 1% rule
- 0.84% ✗
- Cap rate
- 5.13%
- Cash-on-cash
- -4.16%
- DSCR
- 0.81
- GRM
- 9.9
CMA / ARV
- ARV (on-the-fly)
- $196,658
- Comps found
- 12
Show comp detail 12 sales within ~0.75 mi
| Address | Dist | Beds/Ba | Sqft | Sold | Price | $/sf | Match |
|---|---|---|---|---|---|---|---|
| 7035 Foxfield Ln | 0.22mi | 3/2.0 | 1,297 (+2%) | 1mo | $149,900 | $116 | 86 |
| 6935 Foxbrook Dr | 0.19mi | 3/1.0 | 1,254 (-2%) | 4mo | $159,900 | $128 | 81 |
| 6910 Foxwick Ln | 0.31mi | 3/2.0 | 1,311 (+3%) | 5mo | $189,000 | $144 | 77 |
| 7018 Foxmar Ln | 0.40mi | 3/2.0 | 1,235 (-3%) | 3mo | $142,800 | $116 | 73 |
| 6940 Fox Mesa Ln | 0.26mi | 3/2.0 | 1,155 (-10%) | 9mo | $199,900 | $173 | 65 |
| 21234 Grand Linden Ct | 0.57mi | 3/2.0 | 1,300 (+2%) | 9mo | $195,000 | $150 | 63 |
| 21247 Linden House Ct | 0.60mi | 3/2.0 | 1,296 (+2%) | 8mo | $199,900 | $154 | 63 |
| 21115 Field House Ct | 0.62mi | 3/2.0 | 1,318 (+3%) | 5mo | $185,000 | $140 | 62 |
| 21130 Grandin Wood Ct | 0.61mi | 3/2.0 | 1,178 (-8%) | 1mo | $209,000 | $177 | 58 |
| 6619 Old Cypress Landing Ln | 0.41mi | 3/2.0 | 1,450 (+14%) | 3mo | $285,990 | $197 | 56 |
| 6519 Old Cypress Landing Ln | 0.50mi | 3/2.0 | 1,450 (+14%) | 1mo | $273,180 | $188 | 54 |
| 6626 Old Cypress Landing Ln | 0.41mi | 3/2.0 | 1,450 (+14%) | 8mo | $283,450 | $195 | 52 |
Match score weights: distance 35% · size 25% · config 20% · recency 20%. Top-matched comps best support the ARV.
Projected returns pro-forma
-0.77% appreciation · 2.17% rent growth · sell at horizon
- IRR
- -10.9%
- Equity multiple
- 0.52×
- Total profit
- $-27,864
- Equity at exit
- $52,718
- IRR
- -5.0%
- Equity multiple
- 0.54×
- Total profit
- $-27,051
- Equity at exit
- $57,314
Cash invested: $58,520 (down + closing). Projections, not guarantees.
Landlord ↔ Tenant lean methodology
- Overall (STATE)
- 87 Strongly Landlord-Friendly
- State Texas
- 87 Strongly Landlord-Friendly · R+5
- County
- — inherits STATE
- City
- — inherits STATE
ZIP-level market 77338
- Home prices YoY
- -0.3%
- Rents YoY
- 2.2%
- Active inventory
- 306
- Price-to-rent
- 9.9×
Monthly cashflow live
- Estimated rent
- $1,752 high interval (Pro) →
- Mortgage (P&I)
- −$1,096
- Tax from tax record
- −$375 /mo · $4,500/yr
- Insurance
- −$87
- HOA
- −$29
- Vacancy / Maint / Mgmt
- −$368
- Net cashflow
- $-203
Break-even live
UW: 25.0% down · 7.5% · 30yr · 1.5% tax · 5.0% vac · 8.0% maint · 8.0% mgmt
Financing live
Cash to close
- Down payment
- $52,250
- Closing costs
- $6,270
- Reserves months
- —
- Total cash needed
- —
Loan-product check · same deal, 3 products live
Conventional
25% down · 7.5% · 30yr
- Down + closing
- —
- Monthly P&I
- —
- Monthly cashflow
- —
- DSCR
- —
- Eligible?
- —
Personal DTI + credit; lowest rate.
DSCR
20% down · 8.5% · 30yr
- Down + closing
- —
- Monthly P&I
- —
- Monthly cashflow
- —
- DSCR
- —
- Eligible?
- —
No personal income docs; deal must DSCR.
Hard money
10% down · 12.0% · 12mo
- Down + closing
- —
- Monthly P&I
- —
- Monthly cashflow
- —
- DSCR
- —
- Eligible?
- —
Short-term bridge; refi at stabilization.
Rent comps 19 comps
| Address | Beds | Baths | Sqft | Rent | $/sqft | DOM | Units | Dist |
|---|---|---|---|---|---|---|---|---|
| 7010 Foxmont Ln Humble, TX | 3.0 | 2.0 | 1722 | $1,735 | $1.01 | 44d | 1 | 0.15mi |
| 7214 Foxbend Ln Humble, TX | 3.0 | 2.0 | 1591 | $1,995 | $1.25 | 2d | 1 | 0.25mi |
| 7010 Foxmar Ln Humble, TX | 2.0 | 2.0 | 1330 | $1,750 | $1.32 | 43d | 1 | 0.37mi |
| 7160 Foxbrick Ln Unit LANE14103 Humble, TX | 2.0 | 1.0 | 942 | $1,450 | $1.54 | 43d | 1 | 0.50mi |
| 19920 Foxwood Forest Blvd Unit 19977 Humble, TX | 2.0 | 2.0 | 921 | $1,237 | $1.34 | 2d | 1 | 0.51mi |
| 19920 Foxwood Forest Blvd Unit 422 Humble, TX | 2.0 | 2.0 | 921 | $1,245 | $1.35 | 7d | 1 | 0.51mi |
| 19920 Foxwood Forest Blvd Unit 424 Humble, TX | 2.0 | 2.0 | 921 | $1,245 | $1.35 | 5d | 1 | 0.51mi |
| 7318 Foxway Ln Humble, TX | 3.0 | 2.0 | 1750 | $1,759 | $1.01 | 24d | 1 | 0.52mi |
| 7150 Foxbrick Ln Humble, TX | 1.0–2.0 | 1.0–2.0 | 872 | $1,625 | $1.86 | 43d | 4 | 0.61mi |
| 7160 Foxbrick Ln Humble, TX | 2.0 | 1.0–2.0 | 976 | $1,438 | $1.47 | 5d | 1 | 0.62mi |
| 7507 Kennemer Dr Humble, TX | 3.0 | 2.5 | 1596 | $1,766 | $1.11 | 11d | 1 | 0.68mi |
| 21235 Grand Field Ct Humble, TX | 4.0 | 3.0 | 1750 | $1,800 | $1.03 | 43d | 1 | 0.80mi |
| 7810 Birchbark Dr Humble, TX | 3.0 | 2.0 | 1663 | $1,899 | $1.14 | 24d | 1 | 0.84mi |
| 20211 Cottonglade Ln Humble, TX | 3.0 | 2.0 | 1348 | $1,699 | $1.26 | 43d | 1 | 0.97mi |
| 20126 Chipplegate Ln Humble, TX | 3.0 | 2.0 | 1348 | $1,800 | $1.34 | 43d | 1 | 1.05mi |
| 19902 Bishops Gate Ln Humble, TX | 3.0 | 2.0 | 1570 | $1,825 | $1.16 | 24d | 1 | 1.22mi |
| 19815 Kenswick Dr Humble, TX | 1.0–2.0 | 1.0–2.0 | 935 | $1,756 | $1.88 | 3d | 62 | 1.39mi |
| 19806 Kenswick Dr Humble, TX | 2.0 | 2.0 | 934 | $1,281 | $1.37 | 43d | 1 | 1.48mi |
| 20327 Bridgedale Ln Humble, TX | 3.0 | 2.0 | 1226 | $1,786 | $1.46 | 7d | 1 | 1.50mi |
HOA detail
- Monthly dues
- $29 · $348/yr
- Likely covers
- pool
Listing history 3 events
-
2026-06-18days on market $209,000 Active 2 DOM
-
2026-06-17remarks 693-char remark
-
2026-06-17$209,000 Active 1 DOM
ⓘ Source: listings_history table (triggers on properties + properties_extension) + one-shot
backfill from property_details.listing_events for pre-trigger history.
Tax reassessment forecast TX · Resets to sale price
- Current annual tax
- $4,500 · $375/mo
- Projected year-2 tax
- $4,500 · $375/mo
- Expected delta
- $0/yr ($0/mo · 0.0%)
ⓘ Screening estimate from a state-policy table — verify with the county assessor before closing.
Climate risk First Street
- Flood 3/10 Moderate FEMA zone X (unshaded) · 20% chance over 30 yrs
- Wildfire 3/10 Moderate
- Heat 9/10 Extreme 7 d/yr ≥110°F today · 24 d/yr by 30 yrs out
- Wind 9/10 Extreme 99% chance of damaging wind over 30 yrs
- Air quality 3/10 Moderate 3 unhealthy d/yr today · 3 by 30 yrs out
Nearby sold comps map
Loading sold comps map…
Walkable amenities ~0.75 mi
Loading nearby amenities…
Taxation est. · year 1
- Rental income
- $21,026
- − Mortgage interest
- −$11,707
- − Property taxes
- −$4,500
- − Insurance
- −$1,045
- − Repairs & maintenance
- −$1,682
- − Management
- −$1,682
- − HOA
- −$348
- − Depreciation
- −$6,080
- Taxable loss
- −$6,018
- Est. tax savings @ 24.0%
- +$1,444
- After-tax cash flow
- $-990/yr
For passive investors: Depreciation is non-cash, so a rental often shows a tax loss while cash-flowing — sheltering income. Rental losses are passive: they offset passive income freely, and up to $25,000/yr can offset ordinary (W-2) income if you actively participate and your MAGI is under $100k (phasing out to $0 by $150k); unused losses carry forward. On sale, claimed depreciation is recaptured at up to 25%, and gains may owe capital-gains tax (a 1031 exchange can defer both). Figures are a year-1 estimate at your 24.0% rate — not tax advice; consult a CPA.
Schools (NCES district)
- District
- Aldine ISD
- NCES district ID
- 4807710
- Math proficiency
- 16% ▼ -23.00%
- Reading proficiency
- 21% ▼ -11.00%
- Median HH income
- $37,081
- Composite
- 15.42/100
- National rank
- #9317
- State rank
- #790 of 826 in TX
Livability — Houston
- Score
- 74/100
- State rank
- #184
- US rank
- #4771
Category grades
Schools grade is shown separately in the Schools card above.
Census & demographics
- County
- Harris County · 4,702,590 people
- City population
- 3,226,434
- Metro
- Houston-The Woodlands-Sugar Land, TX
- Population (ZIP)
- 48,031
- Household income
- $64,755
- Rent vs Own
- Severe rent burden
- 2620.0
Population outlook (Harris County) Hauer SSP2
- Today (2025)
- 5,571,493 people
- By 2030
- 6,089,821 · +9.3%
- By 2040
- 7,142,806 · +28.2%
- By 2050
- 8,185,864 · +46.9%
- By 2075
- 10,574,329 · +89.8%
- By 2100
- 12,109,958 · +117.4%
Race, ethnicity, and origin ACS 2023
- Neighborhood character
- Diverse neighborhood (Simpson 0.69)
- Race & ethnicity
- Hispanic / Latino 41% Black 34% Two or more races 18% White 16% Asian 3%
- Hispanic origin (detail)
- Mexican 29% Puerto Rican 1%
- Common ancestry
- Lithuanian 4% Armenian 1% Serbian 1%
- Foreign-born
- 17% · Canada, Jamaica
- Languages at home
- 60% English-only · Spanish 35% Arabic 1% Other Indo-European 1%
Political lean MEDSL · Harris
- 2024 margin
- Lean D (+5.5) · D 52.0% · R 46.4% · Other 1.6%
- 2008→2024 swing
- +3.9pp toward D · 2008: 1.6pp · 2024: 5.5pp
- All cycles
- 2024: D+5.5 2020: D+13.3 2016: D+12.4 2012: D+0.1 2008: D+1.6
Not yet ingested
- Civics
- —
Market trends
- HPI YoY
- ▼ -0.77%
- Current HPI
- 245.7087
- Rent YoY
- ▲ 2.17%
- Metro
- Houston-The Woodlands-Sugar Land, TX
- State GDP YoY
- ▲ 3.95%
- F500 in state
- 110
Industry mix (Fortune 500 HQ in TX)
| Industry | F500 HQs | Revenue |
|---|---|---|
| Energy | 16 | $1,198B |
|
||
| Technology | 5 | $198B |
|
||
| Engineering / Construction | 4 | $72B |
|
||
| Energy Services | 3 | $60B |
|
||
| Utilities | 3 | $41B |
|
||
| Healthcare | 2 | $330B |
|
||
Price history
5 events — show timeline
- 2026-06-16 Listed $209,000 HARMLS
- 2022-04-27 Sold (Public Records) — Public Records
- 2007-05-15 Sold (Public Records) — Public Records
- 2003-07-29 Sold (Public Records) — Public Records
- 1988-01-02 Sold (Public Records) — Public Records
Property tax history
+3.6%/yrLatest (2025): $4,500 · +0.4% YoY. Source: county tax records.
Cash-flow waterfall
monthlySold comps — $/sqft
last 12 mo · ≤1 miLoading sold comps…