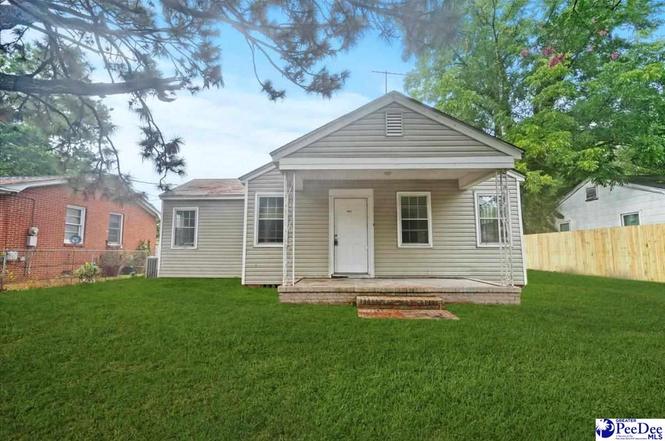
904 Waverly Ave · Florence, SC
Flood risk 4/10 · Minor
- FEMA flood zone
- X (unshaded)
- Chance of flooding over 30 yrs
- 0.22%
- Est. flood insurance / yr
- $507 – $1,088
Fire risk 4/10 · Minor
- Est. fire insurance / yr
- $783 – $1,453
Heat risk 7/10 · Major
- Hot days now (above 107°F)
- 7 days/yr
- Hot days in 30 yrs
- 16 days/yr
Wind risk 8/10 · Major
- Chance of severe wind over 30 yrs
- 80.0%
Air-quality risk 1/10 · Minimal
- Unhealthy air days now
- 0 days/yr
- Unhealthy air days in 30 yrs
- 0 days/yr
Risk factors via First Street. Map © Google.
Why this score? — see what drove the B+ grade
The composite is a weighted blend of 9 inputs, each scored 0–100. Each bar is that input's sub-score; the figure is the points it added to the 100-point composite (weight × sub-score).
- Cash flow +30.0/30.0
- ARV discount +15.0/15.0
- 1% rule +10.0/10.0
- DSCR +10.0/10.0
- Rent growth +3.7/5.0
- Schools +3.2/10.0
- Livability +3.1/5.0
- Condition / age +2.5/5.0
- Appreciation +0.0/10.0
$89,500
🖨 Deal sheet 📄 Offer letter ✓ Due diligence
Listing remarks MLS
Great Starter Home or Investment Property - Interior Recently Refreshed - Unit Less Than 5YO - Termite Bond - Large Yard - Close to Everything in Downtown Florence
Key facts
- Spacious yard
- Near schools
- Near shopping
Tags
Property features AI
Finance
- Other: Lot about 0.21 acres; Located in the CITY subdivision
Exterior
- Utilities: Public water; Public sewer
- Home design: Single-family residence; Residential property; Approximately 928 above-grade finished area
- Construction: Vinyl siding; Built on crawl space
- Exterior features: Front porch; Shingle roof
Interior
- Kitchen: Range
- Flooring: Wood
- Bathrooms: 1 full bathroom
- Heating & cooling: Heat pump heating; Ceiling fan cooling
- Interior features: Range; Wood flooring; Crawl space basement
Neighborhood map
What this means for you Summary
Snapshot
- This is a 3-bed/1.0-bath single-family listed at $90k.
Deal economics
- At list price, monthly cash flow is $573 ($7k/yr) — positive.
- The deal already cash-flows at list — no discount required.
- Meets the 1% rule at list price ($1k rent vs $90k).
- Recommended offer: $79k (12.0% below list) — sets the bar for market timing.
- Cap rate 14.0% vs local median 3.5% in Florence — top-decile yield for the area; either an underpriced asset or a hidden risk that comps aren't pricing in. Stress-test before assuming the spread holds.
Location & tenants
- Location reads 62/100 on livability (#196 in SC) — a middle-class / working-renter tenant base. Strengths: cost of living A+, housing A+, health & safety B+; Watch: employment C-, crime F, amenities F.
- Florence 01 (urban): math 29% / reading 47% proficiency, ranked #34 of 80 in SC (top 42%) — families likely to look elsewhere, expect single-tenant / working-renter base with shorter leases.
- Zoned schools: Briggs Elementary (math 37% / reading 48%, grade F, #252 of 597 statewide, top 43%, 434 students, 73% FRL); Williams Middle (math 23% / reading 46%, grade F, #107 of 229 statewide, top 47%, 836 students, 100% FRL); Wilson High (math 52% / reading 75%, grade B-, #95 of 196 statewide, top 49%, 1,365 students, 100% FRL) — zoned schools average 91% FRL vs 57% district-wide (34 pts higher); higher-poverty schools than district average — tighter screening recommended.
- Market conditions: Rents rising fast (+4.7%/yr); 328 active listings in the ZIP; 657 units permitted in Florence County in 2024 (40 in 5+ unit buildings).
Forward outlook
- Local home prices are declining (-3.0%/yr); year-one equity from $619 of loan paydown is wiped out by about $3k of value loss. Plan a longer hold.
- At projected returns (-3.0% appreciation + 4.7% rent growth), your $25k cash investment doubles in ~5 years — after that, you're playing with house money.
Negotiation context
- It's been on market 309 days — a 12% lower offer ($79k) is reasonable based on typical stale-listing flexibility.
- 3 sale attempts since 11y ago; this cycle's ask has dropped $26k (22%) from the opening price — seller is motivated, your offer sets the floor, not the list.
- Current owner paid $54k; list at $90k implies a 67% gain — meaningful room to come down on a strong offer.
Risks & watch-outs
- Watch-outs: built in 1947 — expect roof / HVAC / electrical / plumbing capex.
- Climate carrying-cost: severe wind risk, 80% chance of damaging wind over 30y; extreme-heat days projected 7→16/yr by 2055 (HVAC capex compounding) — expect insurance premiums to compound above CPI over the hold.
Questions for the listing agent
- It's been on market 309 days. Have you received any prior offers? Is the seller open to a 12% concession, seller financing, or rate buy-down credit?
- Built in 1947 — when were the roof, HVAC, electrical panel, plumbing, and water heater last replaced?
- Why hasn't it sold? Are there any deal-killer items the seller is aware of (foundation, flood, title, zoning, code violations)?
- Is there a deadline driving the sale (1031 exchange, divorce, estate, relocation)? That informs how much negotiation room exists.
- Crime grade is F in this area — have there been break-ins, vandalism, or insurance claims at this property in the last 3 years? What carrier currently insures it and at what premium?
- What's the average days-on-market for RENTAL listings here right now (not sales)? A rising rental-DOM trend means longer vacancies and softer asking-rent achievability than the comps imply.
- What's the recent tenant-quality profile in this submarket — average credit score on applications, eviction rate, late-payment / NSF rate, and stable-employment percentage? A property-management company in the area should have these aggregated.
- How much new for-sale + rental construction is in the pipeline within 1–3 miles? Heavy new supply typically softens prices + rents 12–24 months out; constrained supply supports both.
Investment metrics
- 1% rule
- 1.60% ✓
- Cap rate
- 13.98%
- Cash-on-cash
- 27.46%
- DSCR
- 2.22
- GRM
- 5.2
CMA / ARV
- ARV (on-the-fly)
- $137,344
- Comps found
- 10
Show comp detail 10 sales within ~0.75 mi
| Address | Dist | Beds/Ba | Sqft | Sold | Price | $/sf | Match |
|---|---|---|---|---|---|---|---|
| 320 N Schofield St | 0.55mi | 3/1.0 | 1,000 (+8%) | 8mo | $165,000 | $165 | 54 |
| 1306 W Palmetto St | 0.56mi | 2/1.0 (-1) | 979 (+6%) | 7mo | $168,000 | $172 | 54 |
| 506 Sanborn St | 0.66mi | 3/2.0 | 950 (+2%) | 13mo | $115,000 | $121 | 50 |
| 805 W Cedar St | 0.66mi | 2/1.0 (-1) | 927 (-0%) | 18mo | $159,000 | $172 | 50 |
| 424 Manor Cir | 0.68mi | 2/1.0 (-1) | 870 (-6%) | 4mo | $128,900 | $148 | 49 |
| 913 Chestnut St | 0.55mi | 2/1.0 (-1) | 1,003 (+8%) | 16mo | $105,000 | $105 | 42 |
| 921 Ingram St | 0.68mi | 2/1.0 (-1) | 945 (+2%) | 23mo | $50,000 | $53 | 41 |
| 911 Chestnut St | 0.55mi | 2/2.0 (-1) | 840 (-10%) | 15mo | $75,000 | $89 | 37 |
| 517 N Mcqueen St | 0.75mi | 2/1.0 (-1) | 832 (-10%) | 22mo | $85,000 | $102 | 25 |
| 423 Park Ave | 0.59mi | 2/2.0 (-1) | 1,050 (+13%) | 24mo | $170,500 | $162 | 22 |
Match score weights: distance 35% · size 25% · config 20% · recency 20%. Top-matched comps best support the ARV.
Projected returns pro-forma
-3.0% appreciation · 4.7% rent growth · sell at horizon
- IRR
- 23.3%
- Equity multiple
- 1.98×
- Total profit
- $24,498
- Equity at exit
- $13,345
- IRR
- 32.2%
- Equity multiple
- 4.15×
- Total profit
- $78,904
- Equity at exit
- $7,738
Cash invested: $25,060 (down + closing). Projections, not guarantees.
Landlord ↔ Tenant lean methodology
- Overall (STATE)
- 90 Strongly Landlord-Friendly
- State South Carolina
- 90 Strongly Landlord-Friendly · R+6
- County
- — inherits STATE
- City
- — inherits STATE
ZIP-level market 29501
- Rents YoY
- 4.7%
- Active inventory
- 328
- Price-to-rent
- 5.2×
Monthly cashflow live
- Estimated rent
- $1,435 medium interval (Pro) →
- Mortgage (P&I)
- −$469
- Tax from tax record
- −$54 /mo · $643/yr
- Insurance
- −$37
- HOA
- −$0
- Vacancy / Maint / Mgmt
- −$301
- Net cashflow
- $573
Break-even live
UW: 25.0% down · 7.5% · 30yr · 1.5% tax · 5.0% vac · 8.0% maint · 8.0% mgmt
Financing live
Cash to close
- Down payment
- $22,375
- Closing costs
- $2,685
- Reserves months
- —
- Total cash needed
- —
Loan-product check · same deal, 3 products live
Conventional
25% down · 7.5% · 30yr
- Down + closing
- —
- Monthly P&I
- —
- Monthly cashflow
- —
- DSCR
- —
- Eligible?
- —
Personal DTI + credit; lowest rate.
DSCR
20% down · 8.5% · 30yr
- Down + closing
- —
- Monthly P&I
- —
- Monthly cashflow
- —
- DSCR
- —
- Eligible?
- —
No personal income docs; deal must DSCR.
Hard money
10% down · 12.0% · 12mo
- Down + closing
- —
- Monthly P&I
- —
- Monthly cashflow
- —
- DSCR
- —
- Eligible?
- —
Short-term bridge; refi at stabilization.
Listing history 26 events
-
2026-06-19days on market $89,500 Active 309 DOM
-
2026-06-18days on market $89,500 Active 308 DOM
-
2026-06-17days on market $89,500 Active 307 DOM
-
2026-06-16days on market $89,500 Active 306 DOM
-
2026-06-15days on market $89,500 Active 305 DOM
-
2026-06-14days on market $89,500 Active 303 DOM
-
2026-06-13days on market $89,500 Active 302 DOM
-
2026-06-10days on market $89,500 Active 300 DOM
-
2026-06-09days on market $89,500 Active 299 DOM
-
2026-06-08days on market $89,500 Active 298 DOM
-
2026-06-07pricedays on market $89,500 Active 297 DOM
-
2026-06-05days on market $94,000 Active 294 DOM
-
2026-06-02days on market $94,000 Active 292 DOM
-
2026-06-01days on market $94,000 Active 291 DOM
-
2026-05-31days on market $94,000 Active 290 DOM
-
2026-05-30days on market $94,000 Active 289 DOM
-
2026-02-11price $94,000
-
2025-11-14status Active
-
2025-09-22historical Active Under Contract
-
2025-09-04price $99,000
-
2025-08-14$115,000 Active
-
2019-06-13soldstatus $53,500
-
2015-09-03soldstatus $28,000
-
2015-09-01soldstatus 163-char remark
Show marketing remark (163 chars)
Great Starter Home or Investment Property - Interior Recently Refreshed - Unit Less Than 5YO - Termite Bond - Large Yard - Close to Everything in Downtown Florence
-
2015-06-09$37,500 163-char remark
Show marketing remark (163 chars)
Great Starter Home or Investment Property - Interior Recently Refreshed - Unit Less Than 5YO - Termite Bond - Large Yard - Close to Everything in Downtown Florence
-
1998-10-31soldstatus $24,000
ⓘ Source: listings_history table (triggers on properties + properties_extension) + one-shot
backfill from property_details.listing_events for pre-trigger history.
Tax reassessment forecast SC · Resets to sale price
- Current annual tax
- $643 · $54/mo
- Projected year-2 tax
- $643 · $54/mo
- Expected delta
- $0/yr ($0/mo · 0.0%)
ⓘ Screening estimate from a state-policy table — verify with the county assessor before closing.
Climate risk First Street
- Flood 4/10 Moderate FEMA zone X (unshaded) · 22% chance over 30 yrs
- Wildfire 4/10 Moderate
- Heat 7/10 Severe 7 d/yr ≥107°F today · 16 d/yr by 30 yrs out
- Wind 8/10 Severe 80% chance of damaging wind over 30 yrs
- Air quality 1/10 Low 0 unhealthy d/yr today · 0 by 30 yrs out
Nearby sold comps map
Loading sold comps map…
Walkable amenities ~0.75 mi
Loading nearby amenities…
Taxation est. · year 1
- Rental income
- $17,220
- − Mortgage interest
- −$5,013
- − Property taxes
- −$643
- − Insurance
- −$448
- − Repairs & maintenance
- −$1,378
- − Management
- −$1,378
- − Depreciation
- −$2,604
- Taxable income
- $5,757
- Est. tax owed @ 24.0%
- −$1,382
- After-tax cash flow
- $5,499/yr
For passive investors: Depreciation is non-cash, so a rental often shows a tax loss while cash-flowing — sheltering income. Rental losses are passive: they offset passive income freely, and up to $25,000/yr can offset ordinary (W-2) income if you actively participate and your MAGI is under $100k (phasing out to $0 by $150k); unused losses carry forward. On sale, claimed depreciation is recaptured at up to 25%, and gains may owe capital-gains tax (a 1031 exchange can defer both). Figures are a year-1 estimate at your 24.0% rate — not tax advice; consult a CPA.
Schools (NCES district)
- District
- Florence 01
- NCES district ID
- 4502130
- Math proficiency
- 29% ▼ -10.00%
- Reading proficiency
- 47% ▬ 0.00%
- Median HH income
- $45,782
- Composite
- 32.36/100
- National rank
- #5737
- State rank
- #34 of 80 in SC
Livability — Florence
- Score
- 62/100
- State rank
- #196
- US rank
- #17076
Category grades
Schools grade is shown separately in the Schools card above.
Census & demographics
- Census place
- Florence, SC
- County
- Florence County · 93,345 people
- City population
- 93,345
- Metro
- Florence, SC
- Population (ZIP)
- 48,673
- Household income
- $71,671
- Rent vs Own
- Severe rent burden
- 1792.0
Population outlook (Florence County) Hauer SSP2
- Today (2025)
- 141,714 people
- By 2030
- 142,121 · +0.3%
- By 2040
- 141,344 · -0.3%
- By 2050
- 139,478 · -1.6%
- By 2075
- 132,275 · -6.7%
- By 2100
- 118,374 · -16.5%
Race, ethnicity, and origin ACS 2023
- Neighborhood character
- Diverse neighborhood (Simpson 0.56)
- Race & ethnicity
- White 56% Black 35% Asian 3% Hispanic / Latino 3% Two or more races 3%
- Common ancestry
- Serbian 2% Slovak 2% Lithuanian 1%
- Foreign-born
- 4% · Canada, China
- Languages at home
- 93% English-only · Spanish 3% Other Indo-European 1% Russian/Polish/Slavic 1%
Political lean MEDSL · Florence
- 2024 margin
- Lean R (+8.0) · D 45.3% · R 53.3% · Other 1.3%
- 2008→2024 swing
- -4.8pp toward R · 2008: -3.2pp · 2024: -8.0pp
- All cycles
- 2024: R+8.0 2020: R+2.3 2016: R+5.0 2012: R+0.5 2008: R+3.2
Not yet ingested
- Civics
- —
Market trends
- HPI YoY
- ▼ -181.85%
- Current HPI
- 171.4154
- Rent YoY
- ▲ 4.70%
- Metro
- Florence, SC
- State GDP YoY
- ▲ 4.51%
- F500 in state
- 2
Industry mix (Fortune 500 HQ in SC)
| Industry | F500 HQs | Revenue |
|---|---|---|
| Packaging | 1 | $7B |
|
||
Price history
+291.7% since first listed10 events — show timeline
- 2026-02-11 Price Changed $94,000 RAGPD
- 2025-11-14 Relisted — RAGPD
- 2025-09-22 Contingent — RAGPD
- 2025-09-04 Price Changed $99,000 RAGPD
- 2025-08-14 Listed $115,000 RAGPD
- 2019-06-13 Sold (Public Records) $53,500 Public Records
- 2015-09-03 Sold (Public Records) $28,000 Public Records
- 2015-09-01 Sold (MLS) — RAGPD
- 2015-06-09 Listed $37,500 RAGPD
- 1998-10-31 Sold (Public Records) $24,000 Public Records
Property tax history
+0.1%/yrLatest (2025): $643 · +6.2% YoY. Source: county tax records.
Cash-flow waterfall
monthlySold comps — $/sqft
last 12 mo · ≤1 miLoading sold comps…