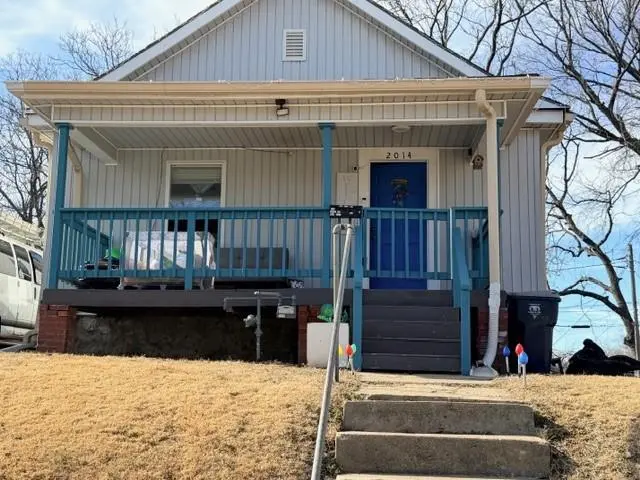
2014 Spruce Ave · Kansas City, MO
Flood risk 1/10 · Minimal
- FEMA flood zone
- X (unshaded)
- Chance of flooding over 30 yrs
- 0.0%
- Est. flood insurance / yr
- $473 – $860
Fire risk 1/10 · Minimal
- Est. fire insurance / yr
- $1,054 – $1,958
Heat risk 4/10 · Minor
- Hot days now (above 106°F)
- 7 days/yr
- Hot days in 30 yrs
- 16 days/yr
Wind risk 2/10 · Minimal
- Chance of severe wind over 30 yrs
- —
Air-quality risk 3/10 · Minor
- Unhealthy air days now
- 2 days/yr
- Unhealthy air days in 30 yrs
- 3 days/yr
Risk factors via First Street. Map © Google.
Why this score? — see what drove the B- grade
The composite is a weighted blend of 9 inputs, each scored 0–100. Each bar is that input's sub-score; the figure is the points it added to the 100-point composite (weight × sub-score).
- Cash flow +25.6/30.0
- ARV discount +15.0/15.0
- DSCR +8.5/10.0
- 1% rule +5.5/10.0
- Livability +3.9/5.0
- Rent growth +2.7/5.0
- Condition / age +2.5/5.0
- Schools +1.5/10.0
- Appreciation +1.1/10.0
$110,000
🖨 Deal sheet 📄 Offer letter ✓ Due diligence
Listing remarks
Charming 3 bedroom, 2 bathroom residential home conveniently located just minutes from Downtown Kansas City with easy access to I-670 and US-71. Functional layout. Ideal for owner-occupants or investors alike. Close to major highways, employment centers, and city amenities. Don’t miss this opportunity schedule your showing today.
Key facts
- 4,559 sq ft lot
- Built 1910
- Listed 33 days
Property features AI
Finance
- Other: Property age: 101 years or more
- Financial info: Annual tax amount listed
Exterior
- Parking: Basement parking access
- Utilities: Public water; Public sewer
- Home design: Single-family residential property; Approximately 1,528 total living area (public records indicate 792 above grade and 736 below grade)
- Construction: Vinyl siding exterior; Composition roof
- Exterior features: Vinyl siding
Interior
- Bedrooms: Three bedrooms on the main level
- Flooring: Ceramic tile in one bathroom
- Bathrooms: Two full bathrooms (one on main level with ceramic tile, one in the basement)
- Heating & cooling: Natural gas heating; Electric cooling
- Interior features: Finished full basement; Total of 8 rooms; Not in a flood plain
Neighborhood map
What this means for you Summary
Snapshot
- This is a 2-bed/1.0-bath single-family listed at $110k.
Deal economics
- At list price, monthly cash flow is $259 ($3k/yr) — positive.
- The deal already cash-flows at list — no discount required.
- Meets the 1% rule at list price ($1k rent vs $110k).
- Recommended offer: $107k (3.0% below list) — sets the bar for market timing.
- Cap rate 9.1% vs local median 3.9% in Kansas City — top-decile yield for the area; either an underpriced asset or a hidden risk that comps aren't pricing in. Stress-test before assuming the spread holds.
Location & tenants
- Location reads 78/100 on livability (#28 in MO, #2,671 nationally) — a middle-class / working-renter tenant base. Strengths: amenities A+, commute A+, cost of living A+; Watch: schools C-, crime F.
- Kansas City 33 (urban): math 12% / reading 24% proficiency, ranked #308 of 324 in MO (top 95%) — low school quality limits family demand, transient renter base, plan for 1-2y turnover; 75% free/reduced lunch — lower-income household profile, screen leases tightly.
- Market conditions: Rents flat; 108 active listings in the ZIP; 27 comparable units currently listed for rent nearby; rentals at typical pace (median 17d on market — plan ~3-4 weeks tenant-placement turnaround); lower-income renter base — watch delinquency; 4,002 units permitted in Jackson County in 2024 (2,271 in 5+ unit buildings).
- This rent runs 42% of the median local income ($33k/yr) — at the standard rent-burdened threshold; future hikes will face affordability resistance.
Forward outlook
- Local home prices are declining (-3.0%/yr); year-one equity from $761 of loan paydown is wiped out by about $3k of value loss. Plan a longer hold.
- Jackson County population projected at +4% by 2050 — modest demand growth; plan on rents tracking national, not racing it.
Negotiation context
- It's been on market 34 days — a 3% lower offer ($107k) is reasonable based on typical stale-listing flexibility.
- 3 sale attempts with the ask held roughly flat each time — persistent listings suggest the price (not the market) is what's stuck; bring a comps-based counter.
Risks & watch-outs
- Watch-outs: built in 1910 — expect roof / HVAC / electrical / plumbing capex.
Questions for the listing agent
- It's been on market 34 days. Have you received any prior offers? Is the seller open to a 3% concession, seller financing, or rate buy-down credit?
- Built in 1910 — when were the roof, HVAC, electrical panel, plumbing, and water heater last replaced?
- Is there a deadline driving the sale (1031 exchange, divorce, estate, relocation)? That informs how much negotiation room exists.
- Crime grade is F in this area — have there been break-ins, vandalism, or insurance claims at this property in the last 3 years? What carrier currently insures it and at what premium?
- What's the average days-on-market for RENTAL listings here right now (not sales)? A rising rental-DOM trend means longer vacancies and softer asking-rent achievability than the comps imply.
- What's the recent tenant-quality profile in this submarket — average credit score on applications, eviction rate, late-payment / NSF rate, and stable-employment percentage? A property-management company in the area should have these aggregated.
- How much new for-sale + rental construction is in the pipeline within 1–3 miles? Heavy new supply typically softens prices + rents 12–24 months out; constrained supply supports both.
Investment metrics
- 1% rule
- 1.05% ✓
- Cap rate
- 9.12%
- Cash-on-cash
- 10.09%
- DSCR
- 1.45
- GRM
- 8.0
CMA / ARV
- ARV (median comp)
- $155,614
- List price
- $110,000
- Delta
- -29.31%
- Verdict
- UNDERPRICED
- Comps
- 20 within 1.0 mi
Show comp detail 12 sales within ~0.75 mi
| Address | Dist | Beds/Ba | Sqft | Sold | Price | $/sf | Match |
|---|---|---|---|---|---|---|---|
| 1621 Cypress Ave | 0.38mi | 2/1.0 | 866 (-2%) | 16mo | $67,500 | $78 | 66 |
| 2410 Myrtle Ave | 0.39mi | 3/1.5 (+1) | 837 (-5%) | 1mo | $134,900 | $161 | 66 |
| 2021 Spruce Ave | 0.03mi | 3/1.0 (+1) | 1,000 (+14%) | 8mo | $63,000 | $63 | 64 |
| 3902 E 24th St | 0.37mi | 2/1.0 | 800 (-9%) | 6mo | $140,000 | $175 | 63 |
| 2011 Poplar Ave | 0.41mi | 2/1.0 | 836 (-5%) | 12mo | $82,500 | $99 | 63 |
| 1916 Monroe | 0.38mi | 2/1.0 | 986 (+12%) | 0mo | $79,900 | $81 | 62 |
| 2531 Jackson Ave | 0.54mi | 2/2.0 | 944 (+7%) | 8mo | $135,000 | $143 | 52 |
| 3104 E 23rd St | 0.73mi | 2/1.5 | 808 (-8%) | 1mo | $60,000 | $74 | 50 |
| 2508 Bales Ave | 0.69mi | 3/1.0 (+1) | 836 (-5%) | 8mo | $75,000 | $90 | 48 |
| 2524 Askew Ave | 0.67mi | 3/1.0 (+1) | 924 (+5%) | 10mo | $84,900 | $92 | 47 |
| 1825 Askew Ave | 0.43mi | 3/2.0 (+1) | 752 (-14%) | 14mo | $125,000 | $166 | 35 |
| 2534 Lawn Ave | 0.59mi | 3/1.0 (+1) | 996 (+13%) | 14mo | $135,000 | $136 | 34 |
Match score weights: distance 35% · size 25% · config 20% · recency 20%. Top-matched comps best support the ARV.
Projected returns pro-forma
-3.0% appreciation · 0.94% rent growth · sell at horizon
- IRR
- -3.3%
- Equity multiple
- 0.88×
- Total profit
- $-3,727
- Equity at exit
- $16,401
- IRR
- 4.2%
- Equity multiple
- 1.28×
- Total profit
- $8,573
- Equity at exit
- $9,511
Cash invested: $30,800 (down + closing). Projections, not guarantees.
Landlord ↔ Tenant lean methodology
- Overall (STATE)
- 81 Strongly Landlord-Friendly
- State Missouri
- 81 Strongly Landlord-Friendly · R+10
- County
- — inherits STATE
- City
- — inherits STATE
ZIP-level market 64127
- Home prices YoY
- -2.6%
- Rents YoY
- 0.9%
- Active inventory
- 108
- Price-to-rent
- 8.0×
Monthly cashflow live
- Estimated rent
- $1,151 high interval (Pro) →
- Mortgage (P&I)
- −$577
- Tax from tax record
- −$28 /mo · $337/yr
- Insurance
- −$46
- HOA
- −$0
- Vacancy / Maint / Mgmt
- −$242
- Net cashflow
- $259
Break-even live
UW: 25.0% down · 7.5% · 30yr · 1.5% tax · 5.0% vac · 8.0% maint · 8.0% mgmt
Financing live
Cash to close
- Down payment
- $27,500
- Closing costs
- $3,300
- Reserves months
- —
- Total cash needed
- —
Loan-product check · same deal, 3 products live
Conventional
25% down · 7.5% · 30yr
- Down + closing
- —
- Monthly P&I
- —
- Monthly cashflow
- —
- DSCR
- —
- Eligible?
- —
Personal DTI + credit; lowest rate.
DSCR
20% down · 8.5% · 30yr
- Down + closing
- —
- Monthly P&I
- —
- Monthly cashflow
- —
- DSCR
- —
- Eligible?
- —
No personal income docs; deal must DSCR.
Hard money
10% down · 12.0% · 12mo
- Down + closing
- —
- Monthly P&I
- —
- Monthly cashflow
- —
- DSCR
- —
- Eligible?
- —
Short-term bridge; refi at stabilization.
Rent comps 27 comps
| Address | Beds | Baths | Sqft | Rent | $/sqft | DOM | Units | Dist |
|---|---|---|---|---|---|---|---|---|
| 2424 Norton Ave Unit B Kansas City, MO | 3.0 | 1.0 | 982 | $1,150 | $1.17 | 16d | 1 | 0.41mi |
| 2213 Askew Ave Kansas City, MO | 2.0 | 1.0 | 865 | $1,002 | $1.16 | 20d | 1 | 0.43mi |
| 1603 Elmwood Ave Kansas City, MO | 2.0 | 1.0 | 1064 | $1,031 | $0.97 | 12d | 1 | 0.43mi |
| 2225 Askew Ave Kansas City, MO | 2.0 | 1.0 | 864 | $1,050 | $1.22 | 43d | 1 | 0.44mi |
| 2447 Norton Ave Kansas City, MO | 2.0 | 1.0 | 800 | $976 | $1.22 | 16d | 1 | 0.47mi |
| 2454 Cypress Ave Kansas City, MO | 3.0 | 1.0 | 800 | $1,300 | $1.62 | 4d | 1 | 0.48mi |
| 2419 Bales Ave Kansas City, MO | 3.0 | 1.5 | 1116 | $1,500 | $1.34 | 3d | 1 | 0.57mi |
| 3201 E 20th St Kansas City, MO | 2.0 | 1.0 | 900 | $1,050 | $1.17 | 23d | 1 | 0.67mi |
| 2413 College Ave Kansas City, MO | 2.0 | 2.0 | 1022 | $1,225 | $1.20 | 23d | 1 | 0.68mi |
| 1616 Hardesty Ave Unit 1-108 Kansas City, MO | 1.0 | 1.0 | 634 | $1,150 | $1.81 | 21d | 1 | 0.81mi |
| 2900 E 21st St Kansas City, MO | 3.0 | 1.5 | 897 | $1,650 | $1.84 | 16d | 1 | 0.83mi |
| 2454 Benton Blvd Unit 2456-1 Kansas City, MO | 1.0 | 1.0 | 750 | $1,000 | $1.33 | 17d | 1 | 0.96mi |
| 2454 Benton Blvd Unit 2460-3 Kansas City, MO | 1.0 | 1.0 | 750 | $1,100 | $1.47 | 17d | 1 | 0.96mi |
| 2454 Benton Blvd Unit 2458-2 Kansas City, MO | 1.0 | 1.0 | 750 | $1,000 | $1.33 | 7d | 1 | 0.97mi |
| 2701 Benton Blvd Unit 2703-2 Kansas City, MO | 2.0 | 1.0 | 800 | $1,200 | $1.50 | 2d | 1 | 1.10mi |
| 2701 Benton Blvd Unit 2705-3 Kansas City, MO | 2.0 | 1.0 | 800 | $1,200 | $1.50 | 7d | 1 | 1.10mi |
| 901 Benton Blvd Unit 7 Kansas City, MO | 2.0 | 1.0 | 1100 | $1,202 | $1.09 | 43d | 1 | 1.20mi |
| 3032 Elmwood Ave Kansas City, MO | 3.0 | 1.0 | 1027 | $1,275 | $1.24 | 7d | 1 | 1.20mi |
| 2855 Van Brunt Blvd Unit A Kansas City, MO | 2.0 | 1.0 | 744 | $1,080 | $1.45 | 43d | 1 | 1.20mi |
| 5108 E 30th St Kansas City, MO | 3.0 | 1.0 | 960 | $1,400 | $1.46 | 3d | 1 | 1.22mi |
| 3435 E 7th St Kansas City, MO | 2.0 | 1.0 | 970 | $949 | $0.98 | 7d | 1 | 1.23mi |
| 2834 E 10th St Kansas City, MO | 2.0 | 1.5 | 1020 | $1,250 | $1.23 | 43d | 1 | 1.29mi |
| 2826 E 10th St Kansas City, MO | 2.0 | 1.5 | 1020 | $1,250 | $1.23 | 43d | 1 | 1.29mi |
| 3118 Chelsea Ave Kansas City, MO | 2.0 | 1.0 | 864 | $980 | $1.13 | 43d | 1 | 1.32mi |
| 1018 Prospect Ave Unit 1018-2N Kansas City, MO | 2.0 | 1.0 | 754 | $895 | $1.19 | 23d | 1 | 1.38mi |
| 2637 E 29th St Unit 3 Kansas City, MO | 2.0 | 1.0 | 954 | $1,050 | $1.10 | 43d | 1 | 1.39mi |
| 6011 E 11th St Kansas City, MO | 3.0 | 1.0 | 900 | $1,200 | $1.33 | 16d | 1 | 1.47mi |
Listing history 24 events
-
2026-06-18days on market $110,000 Active 34 DOM
-
2026-06-17days on market $110,000 Active 33 DOM
-
2026-06-16days on market $110,000 Active 32 DOM
-
2026-06-15days on market $110,000 Active 31 DOM
-
2026-06-13days on market $110,000 Active 29 DOM
-
2026-06-09days on market $110,000 Active 25 DOM
-
2026-06-08days on market $110,000 Active 24 DOM
-
2026-06-07days on market $110,000 Active 23 DOM
-
2026-06-05days on market $110,000 Active 20 DOM
-
2026-06-03days on market $110,000 Active 19 DOM
-
2026-06-02days on market $110,000 Active 18 DOM
-
2026-06-01days on market $110,000 Active 17 DOM
-
2026-05-31days on market $110,000 Active 16 DOM
-
2026-05-16$110,000 Active 337-char remark
-
2026-05-16historical $110,000 337-char remark
-
2026-05-09historical
-
2026-04-03status Active
-
2026-03-28status Pending
-
2026-02-10$120,000 Active
-
2026-02-09historical
-
2022-04-20soldstatus
-
2008-02-20soldstatus
-
2006-05-16soldstatus
-
1992-04-02soldstatus
ⓘ Source: listings_history table (triggers on properties + properties_extension) + one-shot
backfill from property_details.listing_events for pre-trigger history.
Tax reassessment forecast MO · Resets to sale price
- Current annual tax
- $337 · $28/mo
- Projected year-2 tax
- $1,067 · $89/mo
- Expected delta
- +$730/yr (+$61/mo · 216.4%)
ⓘ Screening estimate from a state-policy table — verify with the county assessor before closing.
Climate risk First Street
- Flood 1/10 Low FEMA zone X (unshaded) · 0% chance over 30 yrs
- Wildfire 1/10 Low
- Heat 4/10 Moderate 7 d/yr ≥106°F today · 16 d/yr by 30 yrs out
- Wind 2/10 Low
- Air quality 3/10 Moderate 2 unhealthy d/yr today · 3 by 30 yrs out
Nearby sold comps map
Loading sold comps map…
Walkable amenities ~0.75 mi
Loading nearby amenities…
Taxation est. · year 1
- Rental income
- $13,817
- − Mortgage interest
- −$6,162
- − Property taxes
- −$337
- − Insurance
- −$550
- − Repairs & maintenance
- −$1,105
- − Management
- −$1,105
- − Depreciation
- −$3,200
- Taxable income
- $1,358
- Est. tax owed @ 24.0%
- −$326
- After-tax cash flow
- $2,780/yr
For passive investors: Depreciation is non-cash, so a rental often shows a tax loss while cash-flowing — sheltering income. Rental losses are passive: they offset passive income freely, and up to $25,000/yr can offset ordinary (W-2) income if you actively participate and your MAGI is under $100k (phasing out to $0 by $150k); unused losses carry forward. On sale, claimed depreciation is recaptured at up to 25%, and gains may owe capital-gains tax (a 1031 exchange can defer both). Figures are a year-1 estimate at your 24.0% rate — not tax advice; consult a CPA.
Schools (NCES district)
- District
- Kansas City 33
- NCES district ID
- 2916400
- Math proficiency
- 12% ▼ -8.00%
- Reading proficiency
- 24% ▬ 0.00%
- Median HH income
- $35,227
- Composite
- 14.8/100
- National rank
- #9387
- State rank
- #308 of 324 in MO
Livability — Kansas City
- Score
- 78/100
- State rank
- #28
- US rank
- #2671
Category grades
Schools grade is shown separately in the Schools card above.
Census & demographics
- Census place
- Kansas City, MO
- County
- Jackson County · 687,798 people
- City population
- 439,467
- Metro
- Kansas City, MO-KS
- Population (ZIP)
- 17,668
- Household income
- $33,111
- Rent vs Own
- Severe rent burden
- 1943.0
Population outlook (Jackson County) Hauer SSP2
- Today (2025)
- 719,589 people
- By 2030
- 731,456 · +1.6%
- By 2040
- 746,689 · +3.8%
- By 2050
- 749,289 · +4.1%
- By 2075
- 736,227 · +2.3%
- By 2100
- 668,210 · -7.1%
Race, ethnicity, and origin ACS 2023
- Neighborhood character
- Diverse neighborhood (Simpson 0.65)
- Race & ethnicity
- Black 42% Hispanic / Latino 40% Two or more races 13% White 12% Native American 1%
- Hispanic origin (detail)
- Mexican 28%
- Foreign-born
- 20% · Canada, Vietnam
- Languages at home
- 67% English-only · Spanish 29%
Political lean MEDSL · Jackson
- 2024 margin
- D (+19.3) · D 58.9% · R 39.5% · Other 1.6%
- 2008→2024 swing
- -6.1pp toward R · 2008: 25.4pp · 2024: 19.3pp
- All cycles
- 2024: D+19.3 2020: D+22.0 2016: D+16.6 2012: D+19.0 2008: D+25.4
Not yet ingested
- Civics
- —
Market trends
- HPI YoY
- ▼ -7.88%
- Current HPI
- 289.2468
- Rent YoY
- ▲ 0.94%
- Metro
- Kansas City, MO-KS
- State GDP YoY
- ▲ 1.84%
- F500 in state
- 20
Industry mix (Fortune 500 HQ in MO)
| Industry | F500 HQs | Revenue |
|---|---|---|
| Healthcare | 1 | $163B |
|
||
| Insurance | 1 | $21B |
|
||
| Industrial Technology | 1 | $17B |
|
||
| Retail | 1 | $16B |
|
||
| Industrial Distribution | 1 | $10B |
|
||
| Utilities | 1 | $9B |
|
||
Price history
-8.3% since first listed11 events — show timeline
- 2026-05-16 Listed $110,000 Heartland MLS as Distributed by MLS Grid
- 2026-05-16 Coming Soon $110,000 Heartland MLS as Distributed by MLS Grid
- 2026-05-09 Listing Removed — Heartland MLS as Distributed by MLS Grid
- 2026-04-03 Relisted — Heartland MLS as Distributed by MLS Grid
- 2026-03-28 Pending — Heartland MLS as Distributed by MLS Grid
- 2026-02-10 Listed $120,000 Heartland MLS as Distributed by MLS Grid
- 2026-02-09 Coming Soon — Heartland MLS as Distributed by MLS Grid
- 2022-04-20 Sold (Public Records) — Public Records
- 2008-02-20 Sold (Public Records) — Public Records
- 2006-05-16 Sold (Public Records) — Public Records
- 1992-04-02 Sold (Public Records) — Public Records
Property tax history
+2.9%/yrLatest (2025): $337 · -37.0% YoY. Source: county tax records.
Cash-flow waterfall
monthlySold comps — $/sqft
last 12 mo · ≤1 miLoading sold comps…