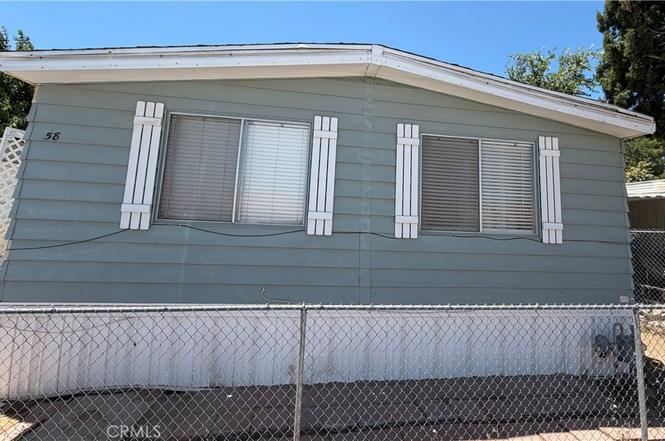
9120 Hesperia Rd #58 · Hesperia, CA
Flood risk 1/10 · Minimal
- FEMA flood zone
- X (unshaded)
- Chance of flooding over 30 yrs
- 0.0%
- Est. flood insurance / yr
- $507 – $1,088
Fire risk 6/10 · Moderate
- Est. fire insurance / yr
- $659 – $1,223
Heat risk 6/10 · Moderate
- Hot days now (above 98°F)
- 7 days/yr
- Hot days in 30 yrs
- 19 days/yr
Wind risk 1/10 · Minimal
- Chance of severe wind over 30 yrs
- —
Air-quality risk 10/10 · Severe
- Unhealthy air days now
- 24 days/yr
- Unhealthy air days in 30 yrs
- 29 days/yr
Risk factors via First Street. Map © Google.
Why this score? — see what drove the B+ grade
The composite is a weighted blend of 9 inputs, each scored 0–100. Each bar is that input's sub-score; the figure is the points it added to the 100-point composite (weight × sub-score).
- Cash flow +30.0/30.0
- ARV discount +15.0/15.0
- 1% rule +10.0/10.0
- DSCR +10.0/10.0
- Rent growth +3.2/5.0
- Schools +2.6/10.0
- Livability +2.6/5.0
- Condition / age +2.5/5.0
- Appreciation +0.0/10.0
$75,000
🖨 Deal sheet 📄 Offer letter ✓ Due diligence
Listing remarks MLS
Welcome to this well kept Manufacture home, it offer 2 bedrooms and 2 full bathrooms. This lovely home has a living room and dining area, indoor laundry and nice open kitchen. It's a family park.
Key facts
- Central heat
- Extra storage space
- Central a/c
Tags
Property features AI
Finance
- Other: Manager approval required for park tenancy
- HOA & community: Land lease of $700 per month (park)
Exterior
- Parking: Located in Highlanders Mobile Home Park
- Utilities: Septic (type unknown); Private water (see remarks)
- Home design: Single-story property; Mobile home remains on site
- Construction: Year built per public records
- Exterior features: No pool; Lot in a 0–1 unit per acre area; Located in a rural community
Interior
- Bathrooms: 2 full bathrooms
- Interior features: One-level home with side entry; Entry located on the side
- Laundry & utility: Inside laundry
Neighborhood map
What this means for you Summary
Snapshot
- This is a 2-bed/2.0-bath manufactured listed at $75k.
Deal economics
- At list price, monthly cash flow is $1k ($13k/yr) — positive.
- The deal already cash-flows at list — no discount required.
- Meets the 1% rule at list price ($2k rent vs $75k).
- Cap rate 23.6% vs local median 3.7% in Hesperia — top-decile yield for the area; either an underpriced asset or a hidden risk that comps aren't pricing in. Stress-test before assuming the spread holds.
Location & tenants
- Location reads 52/100 on livability (#1,009 in CA) — a working-class tenant base; expect higher turnover. Strengths: housing A+; Watch: employment D, schools F, crime D-.
- Hesperia Unified (suburban): math 20% / reading 39% proficiency, ranked #353 of 517 in CA (top 68%) — low school quality limits family demand, transient renter base, plan for 1-2y turnover; 61% free/reduced lunch — lower-income household profile, screen leases tightly.
- Market conditions: Rents rising (+2.9%/yr); 463 active listings in the ZIP; 26 comparable units currently listed for rent nearby; rentals lingering (median 44d on market — plan ~5-8 weeks vacancy on turnover, expect pricing pressure); 65% of comp listings sitting > 30 days — soft ceiling on asking rent; 5,458 units permitted in San Bernardino County in 2024 (1,500 in 5+ unit buildings).
- This rent runs 35% of the median local income ($69k/yr) — at the standard rent-burdened threshold; future hikes will face affordability resistance.
Forward outlook
- Local home prices are declining (-3.0%/yr); year-one equity from $519 of loan paydown is wiped out by about $2k of value loss. Plan a longer hold.
- San Bernardino County population projected at +15% by 2050 — modest demand growth; plan on rents tracking national, not racing it.
- At projected returns (-3.0% appreciation + 2.9% rent growth), your $21k cash investment doubles in ~2 years — after that, you're playing with house money.
Negotiation context
- Only 2 days on market — expect competitive offers; lowballing is unlikely to land.
- 2 sale attempts since 3y ago with the ask held roughly flat each time — persistent listings suggest the price (not the market) is what's stuck; bring a comps-based counter.
- Current owner paid $62k; 22% above their basis — modest negotiation headroom, anchor on the comps not their cost.
Risks & watch-outs
- Climate carrying-cost: major wildfire risk; extreme-heat days projected 7→19/yr by 2055 (HVAC capex compounding) — expect insurance premiums to compound above CPI over the hold.
Questions for the listing agent
- Built in 1972 — when were the roof, HVAC, electrical panel, plumbing, and water heater last replaced?
- Is there a deadline driving the sale (1031 exchange, divorce, estate, relocation)? That informs how much negotiation room exists.
- Schools are F-rated, which usually means shorter tenancies and higher turnover. Who's the typical renter profile here, and what's been the actual vacancy rate?
- Crime grade is D in this area — have there been break-ins, vandalism, or insurance claims at this property in the last 3 years? What carrier currently insures it and at what premium?
- What's the average days-on-market for RENTAL listings here right now (not sales)? A rising rental-DOM trend means longer vacancies and softer asking-rent achievability than the comps imply.
- What's the recent tenant-quality profile in this submarket — average credit score on applications, eviction rate, late-payment / NSF rate, and stable-employment percentage? A property-management company in the area should have these aggregated.
- How much new for-sale + rental construction is in the pipeline within 1–3 miles? Heavy new supply typically softens prices + rents 12–24 months out; constrained supply supports both.
Investment metrics
- 1% rule
- 2.70% ✓
- Cap rate
- 23.63%
- Cash-on-cash
- 61.94%
- DSCR
- 3.76
- GRM
- 3.1
CMA / ARV
- ARV (on-the-fly)
- $112,308
- Comps found
- 2
Show comp detail 2 sales within ~0.75 mi
| Address | Dist | Beds/Ba | Sqft | Sold | Price | $/sf | Match |
|---|---|---|---|---|---|---|---|
| 9161 Santa Fe Ave E #17 | 0.15mi | 3/2.0 (+1) | 1,296 (+13%) | 10mo | $127,000 | $98 | 58 |
| 8655 Santa Fe E | 0.65mi | 2/2.0 | 1,248 (+9%) | 5mo | $70,000 | $56 | 50 |
Match score weights: distance 35% · size 25% · config 20% · recency 20%. Top-matched comps best support the ARV.
Projected returns pro-forma
-3.0% appreciation · 2.85% rent growth · sell at horizon
- IRR
- 60.7%
- Equity multiple
- 3.70×
- Total profit
- $56,604
- Equity at exit
- $11,183
- IRR
- 65.3%
- Equity multiple
- 7.53×
- Total profit
- $137,054
- Equity at exit
- $6,485
Cash invested: $21,000 (down + closing). Projections, not guarantees.
Landlord ↔ Tenant lean methodology
- Overall (STATE)
- 18 Strongly Tenant-Friendly
- State California
- 18 Strongly Tenant-Friendly · D+13
- County
- — inherits STATE
- City
- — inherits STATE
ZIP-level market 92345
- Rents YoY
- 2.9%
- Active inventory
- 463
- Price-to-rent
- 3.1×
Monthly cashflow live
- Estimated rent
- $2,028 high interval (Pro) →
- Mortgage (P&I)
- −$393
- Tax est. 1.5%
- −$94 /mo · $1,125/yr
- Insurance
- −$31
- HOA
- −$0
- Vacancy / Maint / Mgmt
- −$426
- Net cashflow
- $1,084
Break-even live
UW: 25.0% down · 7.5% · 30yr · 1.5% tax · 5.0% vac · 8.0% maint · 8.0% mgmt
Financing live
Cash to close
- Down payment
- $18,750
- Closing costs
- $2,250
- Reserves months
- —
- Total cash needed
- —
Loan-product check · same deal, 3 products live
Conventional
25% down · 7.5% · 30yr
- Down + closing
- —
- Monthly P&I
- —
- Monthly cashflow
- —
- DSCR
- —
- Eligible?
- —
Personal DTI + credit; lowest rate.
DSCR
20% down · 8.5% · 30yr
- Down + closing
- —
- Monthly P&I
- —
- Monthly cashflow
- —
- DSCR
- —
- Eligible?
- —
No personal income docs; deal must DSCR.
Hard money
10% down · 12.0% · 12mo
- Down + closing
- —
- Monthly P&I
- —
- Monthly cashflow
- —
- DSCR
- —
- Eligible?
- —
Short-term bridge; refi at stabilization.
Rent comps 26 comps
| Address | Beds | Baths | Sqft | Rent | $/sqft | DOM | Units | Dist |
|---|---|---|---|---|---|---|---|---|
| 9175 3rd Ave Hesperia, CA | 2.0–3.0 | 2.0 | 1190 | $2,342 | $1.97 | 1d | 4 | 0.11mi |
| 16550 Olive St Unit 105 Hesperia, CA | 2.0 | 1.5 | 990 | $2,000 | $2.02 | 24d | 1 | 0.18mi |
| 16149 Orange St Hesperia, CA | 2.0 | 1.0 | 902 | $1,800 | $2.00 | 24d | 1 | 0.48mi |
| 16507 Juniper St Hesperia, CA | 3.0 | 2.0 | 1297 | $2,400 | $1.85 | 43d | 1 | 0.51mi |
| 16837 Sultana St Apt 4 Hesperia, CA | 2.0 | 1.0 | 750 | $1,624 | $2.17 | 43d | 1 | 0.52mi |
| 16461 Spruce St Unit A Hesperia, CA | 2.0 | 2.0 | 1031 | $1,750 | $1.70 | 24d | 1 | 0.58mi |
| 16850 Muscatel St Hesperia, CA | 2.0 | 1.5 | 1026 | $2,150 | $2.10 | 43d | 1 | 0.61mi |
| 15999 Orange St Unit D Hesperia, CA | 2.0 | 1.0 | 910 | $1,800 | $1.98 | 43d | 1 | 0.64mi |
| 16854 Muscatel St Hesperia, CA | 3.0 | 2.5 | 1281 | $2,395 | $1.87 | 43d | 1 | 0.64mi |
| 16852 Muscatel St Hesperia, CA | 1.0 | 1.0 | 842 | $1,995 | $2.37 | 43d | 1 | 0.64mi |
| 16319 Spruce St Unit 1 Hesperia, CA | 2.0 | 2.0 | 903 | $1,600 | $1.77 | 43d | 1 | 0.64mi |
| 16209 Juniper St Unit 2 Hesperia, CA | 2.0 | 1.0 | 730 | $2,200 | $3.01 | 24d | 1 | 0.65mi |
| 8601 C Ave Unit C Hesperia, CA | 2.0 | 1.0 | 840 | $1,550 | $1.85 | 43d | 1 | 0.67mi |
| 8550 C Ave Hesperia, CA | 3.0 | 2.0 | 1500 | $2,300 | $1.53 | 43d | 1 | 0.68mi |
| 8522 C Ave Hesperia, CA | 1.0 | 1.0 | 847 | $1,425 | $1.68 | 23d | 1 | 0.68mi |
| 16476 Smoke Tree St Unit a Hesperia, CA | 2.0 | 2.0 | 1114 | $2,045 | $1.84 | 43d | 1 | 0.69mi |
| 16119 Spruce St Unit A Hesperia, CA | 2.0 | 1.0 | 936 | $1,750 | $1.87 | 43d | 1 | 0.78mi |
| 16014 Yucca St Unit B Hesperia, CA | 2.0 | 1.0 | 800 | $1,395 | $1.74 | 43d | 1 | 0.80mi |
| 9090 G Ave Apt 2 Hesperia, CA | 1.0 | 1.0 | 720 | $1,100 | $1.53 | 24d | 1 | 0.87mi |
| 16580 Pine St Unit B Hesperia, CA | 2.0 | 1.0 | 858 | $1,395 | $1.63 | 24d | 1 | 0.89mi |
| 16245 Pine St Hesperia, CA | 2.0 | 1.0 | 1054 | $2,400 | $2.28 | 43d | 1 | 0.95mi |
| 16475 Vine St Unit A Hesperia, CA | 2.0 | 2.0 | 1000 | $2,250 | $2.25 | 24d | 1 | 0.99mi |
| 16552 Vine St Unit 2 Hesperia, CA | 2.0 | 2.0 | 950 | $1,600 | $1.68 | 43d | 1 | 1.03mi |
| 8922 I Ave Unit 3 Hesperia, CA | 2.0 | 2.0 | 1150 | $1,695 | $1.47 | 43d | 1 | 1.08mi |
| 15941 Vine St Hesperia, CA | 2.0 | 1.0 | 1024 | $1,750 | $1.71 | 43d | 1 | 1.29mi |
| 17593 Sultana St Hesperia, CA | 2.0 | 2.0 | 1268 | $2,000 | $1.58 | 43d | 1 | 1.44mi |
Listing history 3 events
-
2026-06-18days on market $75,000 Active 2 DOM
-
2026-06-17remarks 699-char remark
-
2026-06-17$75,000 Active 1 DOM
ⓘ Source: listings_history table (triggers on properties + properties_extension) + one-shot
backfill from property_details.listing_events for pre-trigger history.
Climate risk First Street
- Flood 1/10 Low FEMA zone X (unshaded) · 0% chance over 30 yrs
- Wildfire 6/10 Major
- Heat 6/10 Major 7 d/yr ≥98°F today · 19 d/yr by 30 yrs out
- Wind 1/10 Low
- Air quality 10/10 Extreme 24 unhealthy d/yr today · 29 by 30 yrs out
Nearby sold comps map
Loading sold comps map…
Walkable amenities ~0.75 mi
Loading nearby amenities…
Taxation est. · year 1
- Rental income
- $24,337
- − Mortgage interest
- −$4,201
- − Property taxes
- −$1,125
- − Insurance
- −$375
- − Repairs & maintenance
- −$1,947
- − Management
- −$1,947
- − Depreciation
- −$2,182
- Taxable income
- $12,560
- Est. tax owed @ 24.0%
- −$3,014
- After-tax cash flow
- $9,992/yr
For passive investors: Depreciation is non-cash, so a rental often shows a tax loss while cash-flowing — sheltering income. Rental losses are passive: they offset passive income freely, and up to $25,000/yr can offset ordinary (W-2) income if you actively participate and your MAGI is under $100k (phasing out to $0 by $150k); unused losses carry forward. On sale, claimed depreciation is recaptured at up to 25%, and gains may owe capital-gains tax (a 1031 exchange can defer both). Figures are a year-1 estimate at your 24.0% rate — not tax advice; consult a CPA.
Schools (NCES district)
- District
- Hesperia Unified
- NCES district ID
- 0600014
- Math proficiency
- 20% ▼ -4.00%
- Reading proficiency
- 39% ▲ 4.00%
- Median HH income
- $49,376
- Composite
- 25.66/100
- National rank
- #7397
- State rank
- #353 of 517 in CA
Livability — Hesperia
- Score
- 52/100
- State rank
- #1009
- US rank
- #24896
Category grades
Schools grade is shown separately in the Schools card above.
Census & demographics
- Census place
- Hesperia, CA
- County
- San Bernardino County · 2,030,291 people
- City population
- 110,055
- Metro
- Riverside-San Bernardino-Ontario, CA
- Population (ZIP)
- 88,706
- Household income
- $69,485
- Rent vs Own
- Severe rent burden
- 2768.0
Population outlook (San Bernardino County) Hauer SSP2
- Today (2025)
- 2,300,329 people
- By 2030
- 2,378,907 · +3.4%
- By 2040
- 2,523,137 · +9.7%
- By 2050
- 2,642,388 · +14.9%
- By 2075
- 2,880,769 · +25.2%
- By 2100
- 2,909,436 · +26.5%
Race, ethnicity, and origin ACS 2023
- Neighborhood character
- Majority Hispanic (61%)
- Race & ethnicity
- Hispanic / Latino 61% White 30% Two or more races 19% Black 4% Asian 1% Native American 1%
- Hispanic origin (detail)
- Mexican 54%
- Common ancestry
- Italian 1% Lithuanian 1% Iranian 1%
- Foreign-born
- 17% · Canada
- Languages at home
- 65% English-only · Spanish 34%
Political lean MEDSL · San Bernardino
- 2024 margin
- Toss-up / Even · D 47.5% · R 49.7% · Other 2.8%
- 2008→2024 swing
- -8.5pp toward R · 2008: 6.3pp · 2024: -2.1pp
- All cycles
- 2024: R+2.1 2020: D+10.7 2016: D+9.8 2012: D+5.4 2008: D+6.3
Not yet ingested
- Civics
- —
Market trends
- HPI YoY
- ▼ -375.87%
- Current HPI
- 433.2103
- Rent YoY
- ▲ 2.85%
- Metro
- Riverside-San Bernardino-Ontario, CA
- State GDP YoY
- ▲ 3.21%
- F500 in state
- 116
Industry mix (Fortune 500 HQ in CA)
| Industry | F500 HQs | Revenue |
|---|---|---|
| Technology | 27 | $1,492B |
|
||
| Financial Services | 3 | $174B |
|
||
| Retail | 3 | $44B |
|
||
| Insurance | 3 | $26B |
|
||
| Media / Entertainment | 2 | $115B |
|
||
| Pharmaceuticals / Biotech | 2 | $62B |
|
||
Price history
+15.4% since first listed4 events — show timeline
- 2026-06-16 Listed $75,000 CRMLS
- 2024-02-28 Sold (MLS) $61,500 CRMLS
- 2024-01-02 Pending — CRMLS
- 2023-11-06 Listed $65,000 CRMLS
Property tax history
-0.2%/yrLatest (2017): $91 · +0.8% YoY. Source: county tax records.
Cash-flow waterfall
monthlySold comps — $/sqft
last 12 mo · ≤1 miLoading sold comps…