 🌊 Lakefront
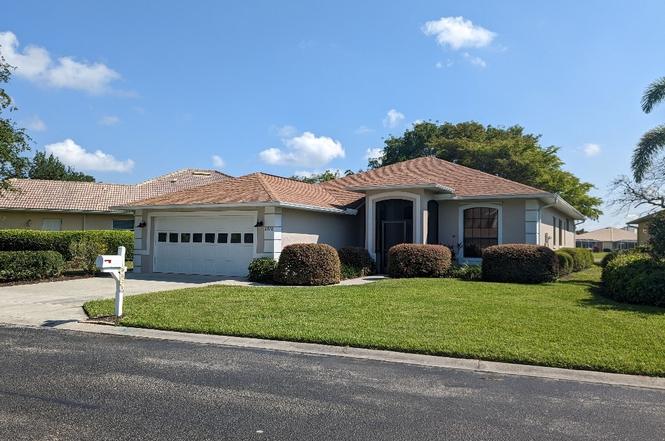
6876 Lone Oak Blvd · Pelican Marsh, FL
Flood risk 3/10 · Minor
- FEMA flood zone
- X (unshaded)
- Chance of flooding over 30 yrs
- 0.1%
- Est. flood insurance / yr
- $507 – $1,088
Fire risk 1/10 · Minimal
- Est. fire insurance / yr
- $947 – $1,759
Heat risk 10/10 · Severe
- Hot days now (above 107°F)
- 7 days/yr
- Hot days in 30 yrs
- 29 days/yr
Wind risk 10/10 · Severe
- Chance of severe wind over 30 yrs
- 99.0%
Air-quality risk 2/10 · Minimal
- Unhealthy air days now
- 2 days/yr
- Unhealthy air days in 30 yrs
- 2 days/yr
Risk factors via First Street. Map © Google.
Why this score? — see what drove the D grade
The composite is a weighted blend of 9 inputs, each scored 0–100. Each bar is that input's sub-score; the figure is the points it added to the 100-point composite (weight × sub-score).
- Cash flow +10.2/30.0
- ARV discount +7.5/15.0
- Appreciation +5.1/10.0
- Schools +5.0/10.0
- 1% rule +3.0/10.0
- DSCR +2.9/10.0
- Rent growth +2.7/5.0
- Livability +2.5/5.0
- Condition / age +2.5/5.0
$619,000
🖨 Deal sheet (PDF) 📄 Offer letter ✓ Due diligence
Listing remarks MLS
Lovingly maintained by the original owner, this lakefront residence features spacious rooms, high ceilings, extended lanai with brick pavers and beautiful landscaping, eat-in kitchen with Corian counters and tons of cupboard space, master bedroom offers 2 walk-in closets, beautiful window treatments, a real pleasure to show!
Key facts
- Open concept design
- Lakefront rental
- 10 foot ceilings
Tags
Property features AI
Finance
- Financial info: Pets allowed
- HOA & community: Homeowners association with quarterly fees; Association fees include cable TV and internet; Community amenities: clubhouse, sidewalks, tennis court(s); Non-gated community
Exterior
- Parking: Attached 2-car garage
- Utilities: Public water; Public sewer; Cable not available
- Home design: Single-story; Resale property; Faces west
- Construction: Block and concrete construction; Shingle roof
- Exterior features: Irregular lot; Paved road; Lakefront; East exposures; Has view
Interior
- Kitchen: Dishwasher; Range; Microwave; Refrigerator; Disposal; Pantry
- Bedrooms: Master bedroom (10 x 15)
- Flooring: Laminate
- Bathrooms: 2 full bathrooms
- Heating & cooling: Central heating (electric); Central air (electric); Ceiling fan(s)
- Interior features: Furnished; Eat-in kitchen; Living/Dining room; Pantry; Bedroom on main level; See remarks
- Laundry & utility: Washer; Dryer; Laundry inside; Tankless water heater
Neighborhood map
What this means for you Summary
Snapshot
- This is a 3-bed/2.0-bath single-family listed at $619k.
Deal economics
- At list price, monthly cash flow is $-355 ($-4k/yr) — negative.
- To cash-flow at today's rent, offer at most $556k (10.1% below list).
- To meet the 1% rule (rent ≥ 1% of price), the offer needs to be $494k (20.2% below list).
- Recommended offer: $494k (20.2% below list) — sets the bar for 1% rule.
Location & tenants
- Location reads: area grade D — affects rentability + tenant quality, not the cash-flow math above.
- Collier (suburban): math 60% / reading 56% proficiency, ranked #16 of 73 in FL (top 22%) — acceptable for families but not a draw, mixed tenant base, ~2y average lease.
- Zoned schools: Pelican Marsh Elementary School (math 87% / reading 83%, grade A+, #35 of 2,144 statewide, top 2%, 709 students, 29% FRL); Pine Ridge Middle School (math 74% / reading 70%, grade A, #52 of 571 statewide, top 10%, 832 students, 31% FRL); Barron Collier High School (math 62% / reading 68%, grade B, #76 of 667 statewide, top 11%, 1,650 students, 26% FRL) — zoned schools average 29% FRL vs 55% district-wide (26 pts lower); this property's tenant base skews higher-income than the district average.
- Zoned-school proficiency averages 74% at this address vs 58% district-wide (+16 pts) — the actual schools serving this property are materially stronger than the Collier average implies; a family-tenant draw the district grade alone would hide.
- Market conditions: Rents flat; 424 active listings in the ZIP; 40 comparable units currently listed for rent nearby; rentals at typical pace (median 25d on market — plan ~3-4 weeks tenant-placement turnaround); solid renter incomes; 3,520 units permitted in Collier County in 2024 (959 in 5+ unit buildings).
- At $4,942/mo this rent would consume 64% of the median local household income ($92k/yr) (locally 1712% of renters already pay >50% of income on rent) — very limited rent-growth headroom before tenants either downsize or default.
Forward outlook
- In year one you build about $6k of equity ($4k loan paydown + $2k appreciation (0.3% local appreciation)).
- Collier County population projected at +30% by 2050 — long-run rental-demand tailwind backs the buy-and-hold thesis.
- By year 6, paydown + projected appreciation supports a ~$39k cash-out refi (75% LTV) — recoverable capital for the next deal without selling this one.
Negotiation context
- It's been on market 142 days — a 12% lower offer ($545k) is reasonable based on typical stale-listing flexibility.
- 5 sale attempts since 17y ago with the ask held roughly flat each time — persistent listings suggest the price (not the market) is what's stuck; bring a comps-based counter.
- Current owner paid $250k; list at $619k implies a 148% gain — meaningful room to come down on a strong offer.
Risks & watch-outs
- Climate carrying-cost: severe wind risk, 99% chance of damaging wind over 30y; extreme-heat days projected 7→29/yr by 2055 (HVAC capex compounding) — expect insurance premiums to compound above CPI over the hold.
Questions for the listing agent
- What do current leases actually rent for vs. the listed asking? Can we see a recent rent roll and the last 12 months of T-12 income?
- It's been on market 142 days. Have you received any prior offers? Is the seller open to a 20% concession, seller financing, or rate buy-down credit?
- What does the HOA fee cover, when was the last increase, and are there any pending special assessments or reserve-fund shortfalls?
- Why hasn't it sold? Are there any deal-killer items the seller is aware of (foundation, flood, title, zoning, code violations)?
- Is there a deadline driving the sale (1031 exchange, divorce, estate, relocation)? That informs how much negotiation room exists.
- The area grade is low — what's the realistic commute time and amenity access for the typical tenant pool here? Any planned neighborhood developments (good or bad) we should know about?
- This sits on a lake — are riparian / water-frontage rights deeded with the parcel? Any dock permits, shoreline easements, or HOA water-use restrictions?
- What's the documented flood / surge / shoreline-erosion history here (FEMA AND non-FEMA — e.g., storm surge, creek backup, septic-field saturation)?
- Any water-quality or seasonal algae-bloom issues that affect tenant satisfaction or short-term-rental demand?
- What's the average days-on-market for RENTAL listings here right now (not sales)? A rising rental-DOM trend means longer vacancies and softer asking-rent achievability than the comps imply.
- What's the recent tenant-quality profile in this submarket — average credit score on applications, eviction rate, late-payment / NSF rate, and stable-employment percentage? A property-management company in the area should have these aggregated.
- How much new for-sale + rental construction is in the pipeline within 1–3 miles? Heavy new supply typically softens prices + rents 12–24 months out; constrained supply supports both.
Investment metrics
- 1% rule
- 0.80% ✗
- Cap rate
- 5.61%
- Cash-on-cash
- -2.46%
- DSCR
- 0.89
- GRM
- 10.4
CMA / ARV
No comps found within radius.
Projected returns pro-forma
0.29% appreciation · 0.92% rent growth · sell at horizon
- IRR
- -5.1%
- Equity multiple
- 0.76×
- Total profit
- $-42,132
- Equity at exit
- $188,920
- IRR
- -0.8%
- Equity multiple
- 0.92×
- Total profit
- $-14,312
- Equity at exit
- $234,553
Cash invested: $173,320 (down + closing). Projections, not guarantees.
Landlord ↔ Tenant lean methodology
- Overall (STATE)
- 87 Strongly Landlord-Friendly
- State Florida
- 87 Strongly Landlord-Friendly · R+3
- County
- — inherits STATE
- City
- — inherits STATE
ZIP-level market 34109
- Home prices YoY
- 0.1%
- Rents YoY
- 0.9%
- Active inventory
- 424
- Price-to-rent
- 10.4×
Monthly cashflow live
- Estimated rent
- $4,942 high interval (Pro) →
- Mortgage (P&I)
- −$3,246
- Tax from tax record
- −$414 /mo · $4,973/yr
- Insurance
- −$258
- HOA
- −$340
- Vacancy / Maint / Mgmt
- −$1,038
- Net cashflow
- $-355
Break-even live
Sensitivity live
| Price | -10% $-4 | -5% $-179 | +0% $-355 | +5% $-530 | +10% $-705 |
|---|---|---|---|---|---|
| Rent | -10% $-745 | -5% $-550 | +0% $-355 | +5% $-159 | +10% $36 |
| Rate | -1.0pp $-43 | -0.5pp $-197 | base $-355 | +0.5pp $-515 | +1.0pp $-678 |
UW: 25.0% down · 7.5% · 30yr · 1.5% tax · 5.0% vac · 8.0% maint · 8.0% mgmt
Financing live
Cash to close
- Down payment
- $154,750
- Closing costs
- $18,570
- Reserves months
- —
- Total cash needed
- —
Loan-product check · same deal, 3 products live
Conventional
25% down · 7.5% · 30yr
- Down + closing
- —
- Monthly P&I
- —
- Monthly cashflow
- —
- DSCR
- —
- Eligible?
- —
Personal DTI + credit; lowest rate.
DSCR
20% down · 8.5% · 30yr
- Down + closing
- —
- Monthly P&I
- —
- Monthly cashflow
- —
- DSCR
- —
- Eligible?
- —
No personal income docs; deal must DSCR.
Hard money
10% down · 12.0% · 12mo
- Down + closing
- —
- Monthly P&I
- —
- Monthly cashflow
- —
- DSCR
- —
- Eligible?
- —
Short-term bridge; refi at stabilization.
Rent comps 40 comps
| Address | Beds | Baths | Sqft | Rent | $/sqft | DOM | Units | Dist |
|---|---|---|---|---|---|---|---|---|
| 7030 Lone Oak Blvd Naples, FL | 3.0 | 2.0 | 1700 | $6,400 | $3.76 | 15d | 1 | 0.24mi |
| 2611 Citrus Lake Dr Unit C-203 Naples, FL | 3.0 | 2.0 | 1710 | $5,500 | $3.22 | 15d | 1 | 0.29mi |
| 2651 Citrus Lake Dr Unit D302 Naples, FL | 2.0 | 2.0 | 1250 | $5,000 | $4.00 | 15d | 1 | 0.30mi |
| 2671 Citrus Lake Dr Unit E-201 Naples, FL | 3.0 | 2.0 | 1380 | $5,250 | $3.80 | 15d | 1 | 0.32mi |
| 2671 Citrus Lake Dr Unit E-303 Naples, FL | 2.0 | 2.0 | 1380 | $3,500 | $2.54 | 15d | 1 | 0.32mi |
| 2711 Citrus Lake Dr Unit F302 Naples, FL | 2.0 | 2.0 | 1272 | $4,500 | $3.54 | 15d | 1 | 0.32mi |
| 2711 Citrus Lake Dr Unit F305 Naples, FL | 3.0 | 2.0 | 1480 | $5,500 | $3.72 | 15d | 1 | 0.32mi |
| 2731 Citrus Lake Dr #202 Naples, FL | 2.0 | 2.0 | 1260 | $2,500 | $1.98 | 15d | 1 | 0.33mi |
| 2541 Citrus Lake Dr Unit A-205 Naples, FL | 3.0 | 2.0 | 1590 | $5,250 | $3.30 | 15d | 1 | 0.33mi |
| 2277 Arbour Walk Cir Naples, FL | 1.0–2.0 | 1.0–2.0 | 937 | $2,540 | $2.71 | 15d | 25 | 0.37mi |
| 6654 Tannin Ln Unit B Naples, FL | 2.0 | 2.0 | 1441 | $3,100 | $2.15 | 25d | 1 | 0.38mi |
| 2860 Citrus Lake Dr Unit R202 Naples, FL | 3.0 | 2.0 | 1590 | $5,000 | $3.14 | 25d | 1 | 0.42mi |
| 2860 Citrus Lake Dr Unit R-202 Naples, FL | 3.0 | 2.0 | 1590 | $5,000 | $3.14 | 15d | 1 | 0.42mi |
| 7287 Mill Pond Cir Naples, FL | 3.0 | 2.0 | 1355 | $3,800 | $2.80 | 25d | 1 | 0.44mi |
| 13379 Silktail Dr Naples, FL | 3.0 | 2.0 | 1837 | $4,400 | $2.40 | 25d | 1 | 0.44mi |
| 2880 Citrus Lake Dr Unit Q201 Naples, FL | 3.0 | 2.0 | 1590 | $2,495 | $1.57 | 15d | 1 | 0.44mi |
| 3035 Horizon Ln #2206 Naples, FL | 2.0 | 2.0 | 1246 | $6,000 | $4.82 | 25d | 1 | 0.45mi |
| 13423 Silktail Dr Naples, FL | 2.0 | 2.0 | 1831 | $2,200 | $1.20 | 25d | 1 | 0.45mi |
| 7271 Mill Pond Cir Naples, FL | 3.0 | 2.0 | 1700 | $8,250 | $4.85 | 25d | 1 | 0.46mi |
| 13435 Silktail Dr Naples, FL | 2.0 | 2.0 | 1837 | $8,950 | $4.87 | 25d | 1 | 0.46mi |
| 13441 Coronado Dr Naples, FL | 3.0 | 2.0 | 1837 | $10,000 | $5.44 | 25d | 1 | 0.47mi |
| 3048 Horizon Ln #1104 Naples, FL | 3.0 | 2.5 | 1818 | $5,150 | $2.83 | 25d | 1 | 0.48mi |
| 3051 Horizon Ln #1803 Naples, FL | 2.0 | 2.0 | 1482 | $5,100 | $3.44 | 25d | 1 | 0.49mi |
| 13466 Sumter Ln Naples, FL | 3.0 | 2.0 | 1837 | $8,700 | $4.74 | 25d | 1 | 0.51mi |
| 2602 Fountain View Cir Naples, FL | 1.0–2.0 | 1.0–2.0 | 995 | $2,277 | $2.29 | 15d | 41 | 0.51mi |
| 2885 Citrus Lake Dr Unit N103 Naples, FL | 2.0 | 2.0 | 1249 | $5,250 | $4.20 | 15d | 1 | 0.52mi |
| 2608 Sailors Way #122 Naples, FL | 2.0 | 2.0 | 1387 | $5,500 | $3.97 | 25d | 1 | 0.52mi |
| 7710 Ahoy Ave Naples, FL | 3.0 | 2.0 | 1580 | $2,950 | $1.87 | 25d | 1 | 0.53mi |
| 2730 Sailors Way Naples, FL | 3.0 | 3.0 | 1700 | $9,000 | $5.29 | 25d | 1 | 0.53mi |
| 2864 Mizzen Way Unit Y106 Naples, FL | 2.0 | 2.0 | 1350 | $5,200 | $3.85 | 15d | 1 | 0.55mi |
| 3015 Horizon Ln #2702 Naples, FL | 3.0 | 2.0 | 1399 | $1,790 | $1.28 | 25d | 1 | 0.57mi |
| 2835 Mizzen Way Naples, FL | 3.0 | 2.0 | 1641 | $2,900 | $1.77 | 25d | 1 | 0.58mi |
| 7416 Plumbago Bridge Rd #103 Naples, FL | 2.0 | 2.0 | 1223 | $2,400 | $1.96 | 15d | 1 | 0.60mi |
| 2476 Orchid Bay Dr Unit W201 Naples, FL | 3.0 | 2.0 | 1928 | $2,600 | $1.35 | 15d | 1 | 0.63mi |
| 3009 Driftwood Way #2802 Naples, FL | 3.0 | 2.0 | 1399 | $2,000 | $1.43 | 25d | 1 | 0.65mi |
| 7546 Mill Pond Cir Naples, FL | 3.0 | 2.0 | 1373 | $6,500 | $4.73 | 25d | 1 | 0.66mi |
| 2460 Old Groves Rd Unit E102 Naples, FL | 2.0 | 2.0 | 1226 | $2,400 | $1.96 | 15d | 1 | 0.68mi |
| 3017 Driftwood Way #3001 Naples, FL | 3.0 | 2.0 | 1385 | $5,000 | $3.61 | 25d | 1 | 0.69mi |
| 3062 Driftwood Way #4301 Naples, FL | 3.0 | 2.0 | 1573 | $6,500 | $4.13 | 25d | 1 | 0.69mi |
| 3057 Driftwood Way #4004 Naples, FL | 3.0 | 2.5 | 1818 | $6,400 | $3.52 | 25d | 1 | 0.70mi |
HOA detail
- Monthly dues
- $340 · $4,080/yr
- Likely covers
- landscaping
Listing history 32 events
-
2026-06-21days on market $619,000 Active 142 DOM
-
2026-06-18days on market $619,000 Active 139 DOM
-
2026-06-17days on market $619,000 Active 138 DOM
-
2026-06-16days on market $619,000 Active 137 DOM
-
2026-06-15days on market $619,000 Active 136 DOM
-
2026-06-14days on market $619,000 Active 134 DOM
-
2026-06-10days on market $619,000 Active 131 DOM
-
2026-06-09days on market $619,000 Active 130 DOM
-
2026-06-08days on market $619,000 Active 129 DOM
-
2026-06-07days on market $619,000 Active 128 DOM
-
2026-06-03days on market $619,000 Active 124 DOM
-
2026-06-02days on market $619,000 Active 123 DOM
-
2026-06-01days on market $619,000 Active 122 DOM
-
2026-05-31days on market $619,000 Active 121 DOM
-
2026-05-30days on market $619,000 Active 120 DOM
-
2026-04-30status Active
-
2026-04-21status Pending
-
2026-03-09price $619,000
-
2026-02-03price $639,000
-
2026-01-21$649,000 Active
-
2025-09-11price $4,000
-
2025-05-25price $3,750
-
2025-04-26price $4,000
-
2025-04-12price $4,500
-
2025-03-06price $5,000
-
2025-02-14$4,500
-
2023-08-31historical $4,200
-
2023-07-31$4,200
-
2010-12-08soldstatus $250,000 326-char remark
Show marketing remark (326 chars)
Lovingly maintained by the original owner, this lakefront residence features spacious rooms, high ceilings, extended lanai with brick pavers and beautiful landscaping, eat-in kitchen with Corian counters and tons of cupboard space, master bedroom offers 2 walk-in closets, beautiful window treatments, a real pleasure to show!
-
2009-12-03$275,000 326-char remark
Show marketing remark (326 chars)
Lovingly maintained by the original owner, this lakefront residence features spacious rooms, high ceilings, extended lanai with brick pavers and beautiful landscaping, eat-in kitchen with Corian counters and tons of cupboard space, master bedroom offers 2 walk-in closets, beautiful window treatments, a real pleasure to show!
-
1996-01-30soldstatus $49,500
-
1995-10-04soldstatus $59,400
ⓘ Source: listings_history table (triggers on properties + properties_extension) + one-shot
backfill from property_details.listing_events for pre-trigger history.
Tax reassessment forecast FL · Resets to sale price
- Current annual tax
- $4,973 · $414/mo
- Projected year-2 tax
- $5,138 · $428/mo
- Expected delta
- +$165/yr (+$14/mo · 3.3%)
ⓘ Screening estimate from a state-policy table — verify with the county assessor before closing.
Climate risk First Street
- Flood 3/10 Moderate FEMA zone X (unshaded) · 10% chance over 30 yrs
- Wildfire 1/10 Low
- Heat 10/10 Extreme 7 d/yr ≥107°F today · 29 d/yr by 30 yrs out
- Wind 10/10 Extreme 99% chance of damaging wind over 30 yrs
- Air quality 2/10 Low 2 unhealthy d/yr today · 2 by 30 yrs out
Nearby sold comps map
Loading sold comps map…
Walkable amenities ~0.75 mi
Loading nearby amenities…
Taxation est. · year 1
- Rental income
- $59,299
- − Mortgage interest
- −$34,674
- − Property taxes
- −$4,973
- − Insurance
- −$3,095
- − Repairs & maintenance
- −$4,744
- − Management
- −$4,744
- − HOA
- −$4,080
- − Depreciation
- −$18,007
- Taxable loss
- −$15,018
- Est. tax savings @ 24.0%
- +$3,604
- After-tax cash flow
- $-651/yr
For passive investors: Depreciation is non-cash, so a rental often shows a tax loss while cash-flowing — sheltering income. Rental losses are passive: they offset passive income freely, and up to $25,000/yr can offset ordinary (W-2) income if you actively participate and your MAGI is under $100k (phasing out to $0 by $150k); unused losses carry forward. On sale, claimed depreciation is recaptured at up to 25%, and gains may owe capital-gains tax (a 1031 exchange can defer both). Figures are a year-1 estimate at your 24.0% rate — not tax advice; consult a CPA.
Schools (NCES district)
- District
- Collier
- NCES district ID
- 1200330
- Math proficiency
- 60% ▼ -4.00%
- Reading proficiency
- 56% ▼ -2.00%
- Median HH income
- $58,275
- Composite
- 50.23/100
- National rank
- #1892
- State rank
- #16 of 73 in FL
Livability — Pelican Marsh
No livability data for this city. (Only ~50 U.S. cities are tracked.)
Census & demographics
- County
- Collier County · 396,295 people
- Metro
- Naples-Marco Island, FL
- Population (ZIP)
- 27,273
- Household income
- $92,259
- Rent vs Own
- Severe rent burden
- 1712.0
Population outlook (Collier County) Hauer SSP2
- Today (2025)
- 420,858 people
- By 2030
- 450,054 · +6.9%
- By 2040
- 502,232 · +19.3%
- By 2050
- 544,932 · +29.5%
- By 2075
- 627,203 · +49.0%
- By 2100
- 659,015 · +56.6%
Race, ethnicity, and origin ACS 2023
- Neighborhood character
- Predominantly White (78%)
- Race & ethnicity
- White 78% Hispanic / Latino 11% Two or more races 9% Black 4% Asian 4%
- Hispanic origin (detail)
- Mexican 1% Puerto Rican 1% Cuban 3%
- Common ancestry
- Romanian 5% Scotch-Irish 3% Lithuanian 2%
- Foreign-born
- 20% · Canada, Jamaica, Vietnam
- Languages at home
- 77% English-only · Spanish 10% Other Indo-European 5% Russian/Polish/Slavic 3%
Political lean MEDSL · Collier
- 2024 margin
- Solid R (+33.1) · D 33.1% · R 66.2%
- 2008→2024 swing
- -10.6pp toward R · 2008: -22.5pp · 2024: -33.1pp
- All cycles
- 2024: R+33.1 2020: R+24.7 2016: R+26.0 2012: R+30.1 2008: R+22.5
Not yet ingested
- Civics
- —
Market trends
- HPI YoY
- ▲ 0.29%
- Current HPI
- 279.357
- Rent YoY
- ▲ 0.92%
- Metro
- Naples-Marco Island, FL
- State GDP YoY
- ▲ 3.28%
- F500 in state
- 36
Industry mix (Fortune 500 HQ in FL)
| Industry | F500 HQs | Revenue |
|---|---|---|
| Industrial Technology | 2 | $29B |
|
||
| Insurance | 2 | $17B |
|
||
| Retail | 1 | $60B |
|
||
| Technology Distribution | 1 | $58B |
|
||
| Homebuilding | 1 | $35B |
|
||
| Technology Manufacturing | 1 | $35B |
|
||
Price history
+942.1% since first listed17 events — show timeline
- 2026-04-30 Relisted — FORTMLS
- 2026-04-21 Pending — FORTMLS
- 2026-03-09 Price Changed $619,000 FORTMLS
- 2026-02-03 Price Changed $639,000 FORTMLS
- 2026-01-21 Listed $649,000 FORTMLS
- 2025-09-11 Price Changed $4,000 REDFIN
- 2025-05-25 Price Changed $3,750 REDFIN
- 2025-04-26 Price Changed $4,000 REDFIN
- 2025-04-12 Price Changed $4,500 REDFIN
- 2025-03-06 Price Changed $5,000 REDFIN
- 2025-02-14 Listed for Rent $4,500 REDFIN
- 2023-08-31 Rental Removed $4,200 RENT.
- 2023-07-31 Listed for Rent $4,200 RENT.
- 2010-12-08 Sold (MLS) $250,000 NAPLESMLS
- 2009-12-03 Listed $275,000 NAPLESMLS
- 1996-01-30 Sold (Public Records) $49,500 Public Records
- 1995-10-04 Sold (Public Records) $59,400 Public Records
Property tax history
+9.9%/yrLatest (2025): $4,973 · -6.7% YoY. Source: county tax records.
Cash-flow waterfall
monthlySold comps — $/sqft
last 12 mo · ≤1 miLoading sold comps…