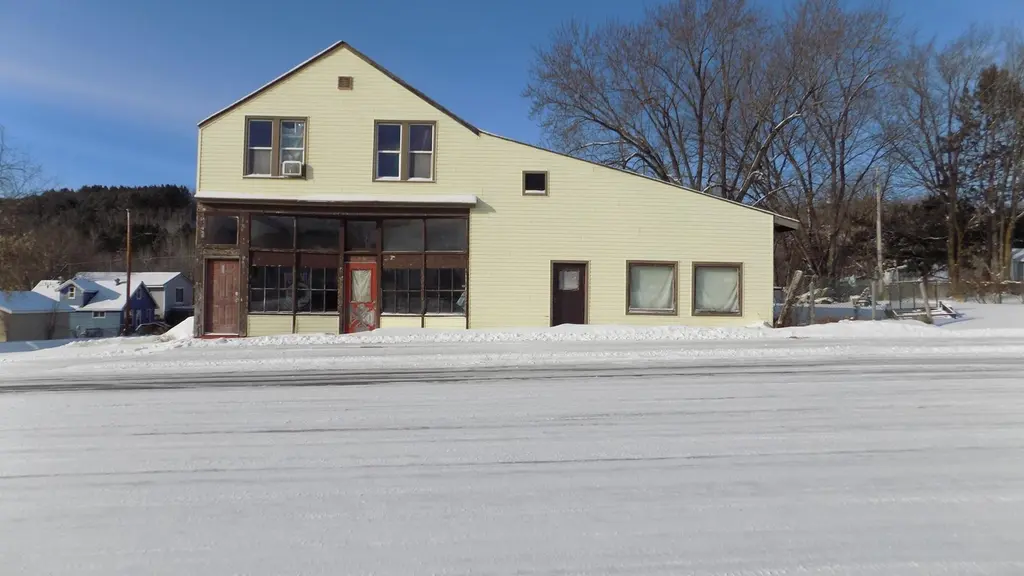
913 Gary St · Greenway, MN
Flood risk 1/10 · Minimal
- FEMA flood zone
- —
- Chance of flooding over 30 yrs
- 0.0%
- Est. flood insurance / yr
- —
Fire risk 5/10 · Moderate
- Est. fire insurance / yr
- $888 – $1,650
Heat risk 1/10 · Minimal
- Hot days now (above 93°F)
- 7 days/yr
- Hot days in 30 yrs
- 12 days/yr
Wind risk 1/10 · Minimal
- Chance of severe wind over 30 yrs
- —
Air-quality risk 2/10 · Minimal
- Unhealthy air days now
- 0 days/yr
- Unhealthy air days in 30 yrs
- 1 days/yr
Risk factors via First Street. Map © Google.
Why this score? — see what drove the B grade
The composite is a weighted blend of 9 inputs, each scored 0–100. Each bar is that input's sub-score; the figure is the points it added to the 100-point composite (weight × sub-score).
- Cash flow +30.0/30.0
- 1% rule +10.0/10.0
- DSCR +10.0/10.0
- ARV discount +7.5/15.0
- Appreciation +5.0/10.0
- Schools +3.7/10.0
- Rent growth +2.5/5.0
- Livability +2.5/5.0
- Condition / age +2.5/5.0
$80,000
🖨 Deal sheet 📄 Offer letter ✓ Due diligence
Listing remarks MLS
This is a unique property with lots of charm, located on a large corner lot that is mostly fenced. the commercial space has hardwood floors, high ceilings with tin and crown molding, plus a large attached cold storage of approximately 1,500 sq ft. The current use of the commercial space has been as living quarters. Upper level has been used as a 3 bedroom apartment. This is a Rehab/fixer upper project. Personal property and rubbish shall remain.
Key facts
- Large corner lot
- High ceilings
- Hardwood floors
Tags
Neighborhood map
What this means for you Summary
Snapshot
- This is a 3-bed/2.0-bath single-family listed at $80k.
Deal economics
- At list price, monthly cash flow is $534 ($6k/yr) — positive.
- The deal already cash-flows at list — no discount required.
- Meets the 1% rule at list price ($1k rent vs $80k).
- Recommended offer: $70k (12.0% below list) — sets the bar for market timing.
Location & tenants
- Location reads: area grade B — affects rentability + tenant quality, not the cash-flow math above.
- Greenway Public School District (rural): math 40% / reading 47% proficiency, ranked #196 of 301 in MN (top 65%) — families likely to look elsewhere, expect single-tenant / working-renter base with shorter leases.
- Market conditions: 4 active listings in the ZIP; 121 units permitted in Itasca County in 2024 (0 in 5+ unit buildings).
Forward outlook
- In year one you build about $3k of equity ($553 loan paydown + $2k appreciation (3.0% local appreciation)).
- Itasca County population projected to shrink 4% by 2050 — rents likely to lag national; underwrite the cash flow, not the appreciation.
- At projected returns (3.0% appreciation + 3.0% rent growth), your $22k cash investment doubles in ~3 years — after that, you're playing with house money.
Negotiation context
- It's been on market 142 days — a 12% lower offer ($70k) is reasonable based on typical stale-listing flexibility.
- 2 sale attempts; this cycle's ask has dropped $12k (14%) from the opening price — seller is motivated, your offer sets the floor, not the list.
Risks & watch-outs
- Watch-outs: built in 1910 — expect roof / HVAC / electrical / plumbing capex.
- Climate carrying-cost: moderate wildfire risk — expect insurance premiums to compound above CPI over the hold.
Questions for the listing agent
- It's been on market 142 days. Have you received any prior offers? Is the seller open to a 12% concession, seller financing, or rate buy-down credit?
- Built in 1910 — when were the roof, HVAC, electrical panel, plumbing, and water heater last replaced?
- Why hasn't it sold? Are there any deal-killer items the seller is aware of (foundation, flood, title, zoning, code violations)?
- Is there a deadline driving the sale (1031 exchange, divorce, estate, relocation)? That informs how much negotiation room exists.
- What's the average days-on-market for RENTAL listings here right now (not sales)? A rising rental-DOM trend means longer vacancies and softer asking-rent achievability than the comps imply.
- What's the recent tenant-quality profile in this submarket — average credit score on applications, eviction rate, late-payment / NSF rate, and stable-employment percentage? A property-management company in the area should have these aggregated.
- How much new for-sale + rental construction is in the pipeline within 1–3 miles? Heavy new supply typically softens prices + rents 12–24 months out; constrained supply supports both.
Investment metrics
- 1% rule
- 1.60% ✓
- Cap rate
- 14.30%
- Cash-on-cash
- 28.60%
- DSCR
- 2.27
- GRM
- 5.2
CMA / ARV
No comps found within radius.
Projected returns pro-forma
3.0% appreciation · 3.0% rent growth · sell at horizon
- IRR
- 34.5%
- Equity multiple
- 2.95×
- Total profit
- $43,618
- Equity at exit
- $35,971
- IRR
- 34.7%
- Equity multiple
- 5.80×
- Total profit
- $107,593
- Equity at exit
- $55,436
Cash invested: $22,400 (down + closing). Projections, not guarantees.
Landlord ↔ Tenant lean methodology
- Overall (STATE)
- 46 Balanced
- State Minnesota
- 46 Balanced · D+2
- County
- — inherits STATE
- City
- — inherits STATE
ZIP-level market 55716
- Active inventory
- 4
- Price-to-rent
- 5.2×
Monthly cashflow live
- Estimated rent
- $1,282 medium interval (Pro) →
- Mortgage (P&I)
- −$420
- Tax from tax record
- −$26 /mo · $312/yr
- Insurance
- −$33
- HOA
- −$0
- Vacancy / Maint / Mgmt
- −$269
- Net cashflow
- $534
Break-even live
UW: 25.0% down · 7.5% · 30yr · 1.5% tax · 5.0% vac · 8.0% maint · 8.0% mgmt
Financing live
Cash to close
- Down payment
- $20,000
- Closing costs
- $2,400
- Reserves months
- —
- Total cash needed
- —
Loan-product check · same deal, 3 products live
Conventional
25% down · 7.5% · 30yr
- Down + closing
- —
- Monthly P&I
- —
- Monthly cashflow
- —
- DSCR
- —
- Eligible?
- —
Personal DTI + credit; lowest rate.
DSCR
20% down · 8.5% · 30yr
- Down + closing
- —
- Monthly P&I
- —
- Monthly cashflow
- —
- DSCR
- —
- Eligible?
- —
No personal income docs; deal must DSCR.
Hard money
10% down · 12.0% · 12mo
- Down + closing
- —
- Monthly P&I
- —
- Monthly cashflow
- —
- DSCR
- —
- Eligible?
- —
Short-term bridge; refi at stabilization.
Listing history 19 events
-
2026-06-18days on market $80,000 Active 142 DOM
-
2026-06-17days on market $80,000 Active 141 DOM
-
2026-06-16days on market $80,000 Active 140 DOM
-
2026-06-15days on market $80,000 Active 139 DOM
-
2026-06-13days on market $80,000 Active 137 DOM
-
2026-06-12days on market $80,000 Active 136 DOM
-
2026-06-09days on market $80,000 Active 133 DOM
-
2026-06-08days on market $80,000 Active 132 DOM
-
2026-06-07days on market $80,000 Active 131 DOM
-
2026-06-07days on market $80,000 Active 130 DOM
-
2026-06-04days on market $80,000 Active 127 DOM
-
2026-06-02days on market $80,000 Active 126 DOM
-
2026-06-01days on market $80,000 Active 125 DOM
-
2026-05-31days on market $80,000 Active 124 DOM
-
2026-05-31days on market $80,000 Active 123 DOM
-
2026-05-11status Active 450-char remark
Show marketing remark (450 chars)
This is a unique property with lots of charm, located on a large corner lot that is mostly fenced. the commercial space has hardwood floors, high ceilings with tin and crown molding, plus a large attached cold storage of approximately 1,500 sq ft. The current use of the commercial space has been as living quarters. Upper level has been used as a 3 bedroom apartment. This is a Rehab/fixer upper project. Personal property and rubbish shall remain.
-
2026-05-11price $80,000 450-char remark
Show marketing remark (450 chars)
This is a unique property with lots of charm, located on a large corner lot that is mostly fenced. the commercial space has hardwood floors, high ceilings with tin and crown molding, plus a large attached cold storage of approximately 1,500 sq ft. The current use of the commercial space has been as living quarters. Upper level has been used as a 3 bedroom apartment. This is a Rehab/fixer upper project. Personal property and rubbish shall remain.
-
2026-05-05historical 450-char remark
Show marketing remark (450 chars)
This is a unique property with lots of charm, located on a large corner lot that is mostly fenced. the commercial space has hardwood floors, high ceilings with tin and crown molding, plus a large attached cold storage of approximately 1,500 sq ft. The current use of the commercial space has been as living quarters. Upper level has been used as a 3 bedroom apartment. This is a Rehab/fixer upper project. Personal property and rubbish shall remain.
-
2026-01-20$92,500 Active 450-char remark
Show marketing remark (450 chars)
This is a unique property with lots of charm, located on a large corner lot that is mostly fenced. the commercial space has hardwood floors, high ceilings with tin and crown molding, plus a large attached cold storage of approximately 1,500 sq ft. The current use of the commercial space has been as living quarters. Upper level has been used as a 3 bedroom apartment. This is a Rehab/fixer upper project. Personal property and rubbish shall remain.
ⓘ Source: listings_history table (triggers on properties + properties_extension) + one-shot
backfill from property_details.listing_events for pre-trigger history.
Tax reassessment forecast MN · Partial reset (capped growth)
- Current annual tax
- $312 · $26/mo
- Projected year-2 tax
- $604 · $50/mo
- Expected delta
- +$292/yr (+$24/mo · 93.6%)
ⓘ Screening estimate from a state-policy table — verify with the county assessor before closing.
Climate risk First Street
- Flood 1/10 Low 0% chance over 30 yrs
- Wildfire 5/10 Major
- Heat 1/10 Low 7 d/yr ≥93°F today · 12 d/yr by 30 yrs out
- Wind 1/10 Low
- Air quality 2/10 Low 0 unhealthy d/yr today · 1 by 30 yrs out
Nearby sold comps map
Loading sold comps map…
Walkable amenities ~0.75 mi
Loading nearby amenities…
Taxation est. · year 1
- Rental income
- $15,384
- − Mortgage interest
- −$4,481
- − Property taxes
- −$312
- − Insurance
- −$400
- − Repairs & maintenance
- −$1,231
- − Management
- −$1,231
- − Depreciation
- −$2,327
- Taxable income
- $5,402
- Est. tax owed @ 24.0%
- −$1,297
- After-tax cash flow
- $5,111/yr
For passive investors: Depreciation is non-cash, so a rental often shows a tax loss while cash-flowing — sheltering income. Rental losses are passive: they offset passive income freely, and up to $25,000/yr can offset ordinary (W-2) income if you actively participate and your MAGI is under $100k (phasing out to $0 by $150k); unused losses carry forward. On sale, claimed depreciation is recaptured at up to 25%, and gains may owe capital-gains tax (a 1031 exchange can defer both). Figures are a year-1 estimate at your 24.0% rate — not tax advice; consult a CPA.
Schools (NCES district)
- District
- Greenway Public School District
- NCES district ID
- 2709480
- Math proficiency
- 40% ▼ -10.00%
- Reading proficiency
- 47% ▼ -14.00%
- Median HH income
- $46,178
- Composite
- 37.01/100
- National rank
- #4520
- State rank
- #196 of 301 in MN
Livability — Greenway
No livability data for this city. (Only ~50 U.S. cities are tracked.)
Census & demographics
- Census place
- Calumet, MN
- Population (ZIP)
- 219
Population outlook (Itasca County) Hauer SSP2
- Today (2025)
- 45,885 people
- By 2030
- 45,890 · +0.0%
- By 2040
- 45,171 · -1.6%
- By 2050
- 43,946 · -4.2%
- By 2075
- 40,950 · -10.8%
- By 2100
- 34,909 · -23.9%
Race, ethnicity, and origin ACS 2023
- Neighborhood character
- Predominantly White (88%)
- Race & ethnicity
- White 88% Native American 10% Two or more races 3% Hispanic / Latino 2%
- Common ancestry
- Lithuanian 5% Portuguese 4% Romanian 1%
- Foreign-born
- 1%
- Languages at home
- 93% English-only · Spanish 5%
Political lean MEDSL · Itasca
- 2024 margin
- Strong R (+20.2) · D 39.1% · R 59.3% · Other 1.6%
- 2008→2024 swing
- -33.1pp toward R · 2008: 12.9pp · 2024: -20.2pp
- All cycles
- 2024: R+20.2 2020: R+16.8 2016: R+16.5 2012: D+9.9 2008: D+12.9
Not yet ingested
- Civics
- —
Market trends
- HPI YoY
- —
- Current HPI
- —
- Rent YoY
- —
- Metro
- —
- State GDP YoY
- ▲ 2.41%
- F500 in state
- 34
Industry mix (Fortune 500 HQ in MN)
| Industry | F500 HQs | Revenue |
|---|---|---|
| Healthcare | 2 | $407B |
|
||
| Retail | 2 | $150B |
|
||
| Consumer Goods | 2 | $32B |
|
||
| Industrial Machinery | 2 | $6B |
|
||
| Agriculture | 1 | $40B |
|
||
| Healthcare / Medical Devices | 1 | $32B |
|
||
Price history
-13.5% since first listed4 events — show timeline
- 2026-05-11 Relisted — NORTHSTARMLS as Distributed by MLS Grid
- 2026-05-11 Price Changed $80,000 NORTHSTARMLS as Distributed by MLS Grid
- 2026-05-05 Listing Removed — NORTHSTARMLS as Distributed by MLS Grid
- 2026-01-20 Listed $92,500 NORTHSTARMLS as Distributed by MLS Grid
Property tax history
+10.4%/yrLatest (2026): $312 · +6.1% YoY. Source: county tax records.
Cash-flow waterfall
monthlySold comps — $/sqft
last 12 mo · ≤1 miLoading sold comps…