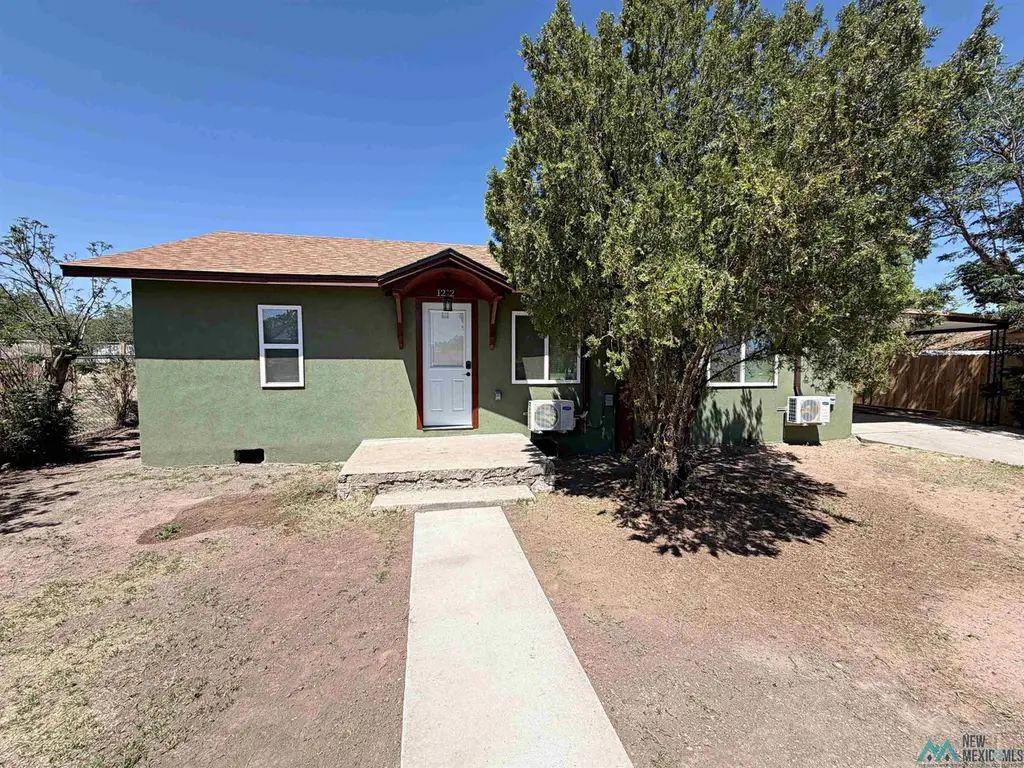
1212 N Kansas Ave · Roswell, NM
Flood risk 1/10 · Minimal
- FEMA flood zone
- X (unshaded)
- Chance of flooding over 30 yrs
- 0.0%
- Est. flood insurance / yr
- $507 – $1,088
Fire risk 7/10 · Major
- Est. fire insurance / yr
- $706 – $1,312
Heat risk 5/10 · Moderate
- Hot days now (above 100°F)
- 7 days/yr
- Hot days in 30 yrs
- 21 days/yr
Wind risk 2/10 · Minimal
- Chance of severe wind over 30 yrs
- —
Air-quality risk 1/10 · Minimal
- Unhealthy air days now
- 0 days/yr
- Unhealthy air days in 30 yrs
- 0 days/yr
Risk factors via First Street. Map © Google.
Why this score? — see what drove the D grade
The composite is a weighted blend of 9 inputs, each scored 0–100. Each bar is that input's sub-score; the figure is the points it added to the 100-point composite (weight × sub-score).
- Cash flow +14.1/30.0
- ARV discount +7.5/15.0
- DSCR +4.3/10.0
- Livability +3.8/5.0
- Rent growth +3.6/5.0
- 1% rule +2.6/10.0
- Schools +2.6/10.0
- Condition / age +2.5/5.0
- Appreciation +0.0/10.0
$177,900
🖨 Deal sheet 📄 Offer letter ✓ Due diligence
Listing remarks MLS
1169 sqft 3 bed 1 bath home waiting to be brought back to life. No utilities are on, to be sold 100% as-is.
Key facts
- Updated electrical
- Mini-split systems
- Fully fenced yard
Tags
Property features AI
Exterior
- Parking: 2 total parking spaces; 2 covered spaces; 2-car garage; Attached carport
- Utilities: Public water; Electricity connected; Sewer connected
- Home design: Single family residence; One story; One level
- Construction: Stucco construction; Shingle roof; Built with a foundation appropriate for single-story construction
- Exterior features: Fenced back yard (chain link and wood)
Interior
- Kitchen: Dishwasher; Range hood; Free-standing range; Refrigerator; Water heater
- Flooring: Vinyl
- Bathrooms: 1 full bathroom
- Heating & cooling: Heating; Cooling
- Interior features: Pantry; Blinds
Neighborhood map
What this means for you Summary
Snapshot
- This is a 3-bed/2.0-bath single-family listed at $178k.
Deal economics
- At list price, monthly cash flow is $25 ($301/yr) — positive.
- The deal already cash-flows at list — no discount required.
- To meet the 1% rule (rent ≥ 1% of price), the offer needs to be $135k (24.1% below list).
- Recommended offer: $135k (24.1% below list) — sets the bar for 1% rule.
Location & tenants
- Location reads 75/100 on livability (#8 in NM, #4,339 nationally) — a middle-class / working-renter tenant base. Strengths: commute A+, cost of living A+, housing A+; Watch: employment D, schools F, crime F.
- Roswell Independent Schools (town): math 11% / reading 52% proficiency, ranked #16 of 29 in NM (top 55%) — families likely to look elsewhere, expect single-tenant / working-renter base with shorter leases; 75% free/reduced lunch — lower-income household profile, screen leases tightly.
- Market conditions: Rents rising fast (+4.3%/yr); 248 active listings in the ZIP; 4 comparable units currently listed for rent nearby; rentals lingering (median 44d on market — plan ~5-8 weeks vacancy on turnover, expect pricing pressure); 100% of comp listings sitting > 30 days — soft ceiling on asking rent; 88 units permitted in Chaves County in 2024 (0 in 5+ unit buildings).
Forward outlook
- Local home prices are declining (-3.0%/yr); year-one equity from $1k of loan paydown is wiped out by about $5k of value loss. Plan a longer hold.
Negotiation context
- It's been on market 15 days — a 2% lower offer ($175k) is reasonable based on typical stale-listing flexibility.
- 2 sale attempts with the ask held roughly flat each time — persistent listings suggest the price (not the market) is what's stuck; bring a comps-based counter.
Risks & watch-outs
- Watch-outs: built in 1946 — expect roof / HVAC / electrical / plumbing capex.
- Climate carrying-cost: major wildfire risk; extreme-heat days projected 7→21/yr by 2055 (HVAC capex compounding) — expect insurance premiums to compound above CPI over the hold.
Questions for the listing agent
- Built in 1946 — when were the roof, HVAC, electrical panel, plumbing, and water heater last replaced?
- Is there a deadline driving the sale (1031 exchange, divorce, estate, relocation)? That informs how much negotiation room exists.
- Schools are F-rated, which usually means shorter tenancies and higher turnover. Who's the typical renter profile here, and what's been the actual vacancy rate?
- Crime grade is F in this area — have there been break-ins, vandalism, or insurance claims at this property in the last 3 years? What carrier currently insures it and at what premium?
- The area grade is low — what's the realistic commute time and amenity access for the typical tenant pool here? Any planned neighborhood developments (good or bad) we should know about?
- What's the average days-on-market for RENTAL listings here right now (not sales)? A rising rental-DOM trend means longer vacancies and softer asking-rent achievability than the comps imply.
- What's the recent tenant-quality profile in this submarket — average credit score on applications, eviction rate, late-payment / NSF rate, and stable-employment percentage? A property-management company in the area should have these aggregated.
- How much new for-sale + rental construction is in the pipeline within 1–3 miles? Heavy new supply typically softens prices + rents 12–24 months out; constrained supply supports both.
Investment metrics
- 1% rule
- 0.76% ✗
- Cap rate
- 6.46%
- Cash-on-cash
- 0.60%
- DSCR
- 1.03
- GRM
- 11.0
CMA / ARV
No comps found within radius.
Projected returns pro-forma
-3.0% appreciation · 4.32% rent growth · sell at horizon
- IRR
- -14.1%
- Equity multiple
- 0.49×
- Total profit
- $-25,511
- Equity at exit
- $26,525
- IRR
- -3.7%
- Equity multiple
- 0.74×
- Total profit
- $-12,892
- Equity at exit
- $15,382
Cash invested: $49,812 (down + closing). Projections, not guarantees.
Landlord ↔ Tenant lean methodology
- Overall (STATE)
- 55 Moderately Landlord-Leaning
- State New Mexico
- 55 Moderately Landlord-Leaning · D+3
- County
- — inherits STATE
- City
- — inherits STATE
ZIP-level market 88201
- Rents YoY
- 4.3%
- Active inventory
- 248
- Price-to-rent
- 11.0×
Monthly cashflow live
- Estimated rent
- $1,350 medium interval (Pro) →
- Mortgage (P&I)
- −$933
- Tax from tax record
- −$34 /mo · $410/yr
- Insurance
- −$74
- HOA
- −$0
- Vacancy / Maint / Mgmt
- −$283
- Net cashflow
- $25
Break-even live
UW: 25.0% down · 7.5% · 30yr · 1.5% tax · 5.0% vac · 8.0% maint · 8.0% mgmt
Financing live
Cash to close
- Down payment
- $44,475
- Closing costs
- $5,337
- Reserves months
- —
- Total cash needed
- —
Loan-product check · same deal, 3 products live
Conventional
25% down · 7.5% · 30yr
- Down + closing
- —
- Monthly P&I
- —
- Monthly cashflow
- —
- DSCR
- —
- Eligible?
- —
Personal DTI + credit; lowest rate.
DSCR
20% down · 8.5% · 30yr
- Down + closing
- —
- Monthly P&I
- —
- Monthly cashflow
- —
- DSCR
- —
- Eligible?
- —
No personal income docs; deal must DSCR.
Hard money
10% down · 12.0% · 12mo
- Down + closing
- —
- Monthly P&I
- —
- Monthly cashflow
- —
- DSCR
- —
- Eligible?
- —
Short-term bridge; refi at stabilization.
Rent comps 4 comps
| Address | Beds | Baths | Sqft | Rent | $/sqft | DOM | Units | Dist |
|---|---|---|---|---|---|---|---|---|
| 1025 Crescent Dr Roswell, NM | 3.0 | 1.0 | 1196 | $1,400 | $1.17 | 43d | 1 | 0.63mi |
| 208 W 8th St Unit 003 Roswell, NM | 2.0 | 1.0 | 850 | $900 | $1.06 | 43d | 1 | 0.70mi |
| 1600 N Sycamore Ave Roswell, NM | 1.0–2.0 | 1.0–2.0 | 813 | $1,575 | $1.94 | 43d | 9 | 1.48mi |
| 1002 W Deming St Roswell, NM | 2.0 | 1.0 | 792 | $1,050 | $1.33 | 43d | 1 | 1.49mi |
Listing history 11 events
-
2026-06-05days on market $177,900 Active 15 DOM
-
2026-06-03days on market $177,900 Active 14 DOM
-
2026-06-02days on market $177,900 Active 13 DOM
-
2026-06-01days on market $177,900 Active 12 DOM
-
2026-05-31days on market $177,900 Active 11 DOM
-
2026-05-30days on market $177,900 Active 10 DOM
-
2026-05-20$180,000 Active
-
2025-09-22soldstatus Closed 107-char remark
Show marketing remark (107 chars)
1169 sqft 3 bed 1 bath home waiting to be brought back to life. No utilities are on, to be sold 100% as-is.
-
2025-09-22soldstatus
Show marketing remark (107 chars)
1169 sqft 3 bed 1 bath home waiting to be brought back to life. No utilities are on, to be sold 100% as-is.
-
2025-08-24status Pending 107-char remark
Show marketing remark (107 chars)
1169 sqft 3 bed 1 bath home waiting to be brought back to life. No utilities are on, to be sold 100% as-is.
-
2025-07-09$39,900 Active 107-char remark
Show marketing remark (107 chars)
1169 sqft 3 bed 1 bath home waiting to be brought back to life. No utilities are on, to be sold 100% as-is.
ⓘ Source: listings_history table (triggers on properties + properties_extension) + one-shot
backfill from property_details.listing_events for pre-trigger history.
Tax reassessment forecast NM · Resets to sale price
- Current annual tax
- $410 · $34/mo
- Projected year-2 tax
- $1,423 · $119/mo
- Expected delta
- +$1,013/yr (+$84/mo · 247.1%)
ⓘ Screening estimate from a state-policy table — verify with the county assessor before closing.
Climate risk First Street
- Flood 1/10 Low FEMA zone X (unshaded) · 0% chance over 30 yrs
- Wildfire 7/10 Severe
- Heat 5/10 Major 7 d/yr ≥100°F today · 21 d/yr by 30 yrs out
- Wind 2/10 Low
- Air quality 1/10 Low 0 unhealthy d/yr today · 0 by 30 yrs out
Nearby sold comps map
Loading sold comps map…
Walkable amenities ~0.75 mi
Loading nearby amenities…
Taxation est. · year 1
- Rental income
- $16,197
- − Mortgage interest
- −$9,965
- − Property taxes
- −$410
- − Insurance
- −$890
- − Repairs & maintenance
- −$1,296
- − Management
- −$1,296
- − Depreciation
- −$5,175
- Taxable loss
- −$2,835
- Est. tax savings @ 24.0%
- +$680
- After-tax cash flow
- $981/yr
For passive investors: Depreciation is non-cash, so a rental often shows a tax loss while cash-flowing — sheltering income. Rental losses are passive: they offset passive income freely, and up to $25,000/yr can offset ordinary (W-2) income if you actively participate and your MAGI is under $100k (phasing out to $0 by $150k); unused losses carry forward. On sale, claimed depreciation is recaptured at up to 25%, and gains may owe capital-gains tax (a 1031 exchange can defer both). Figures are a year-1 estimate at your 24.0% rate — not tax advice; consult a CPA.
Schools (NCES district)
- District
- Roswell Independent Schools
- NCES district ID
- 3502250
- Math proficiency
- 11% ▼ -9.00%
- Reading proficiency
- 52% ▲ 23.00%
- Median HH income
- $38,848
- Composite
- 26.21/100
- National rank
- #7262
- State rank
- #16 of 29 in NM
Livability — Roswell
- Score
- 75/100
- State rank
- #8
- US rank
- #4339
Category grades
Schools grade is shown separately in the Schools card above.
Census & demographics
- Census place
- Roswell, NM
- County
- Chaves County · 56,277 people
- City population
- 56,277
- Metro
- Roswell, NM
- Population (ZIP)
- 27,524
- Household income
- $61,780
- Rent vs Own
- Severe rent burden
- 603.0
Population outlook (Chaves County) Hauer SSP2
- Today (2025)
- 66,122 people
- By 2030
- 66,351 · +0.3%
- By 2040
- 66,818 · +1.1%
- By 2050
- 66,928 · +1.2%
- By 2075
- 65,474 · -1.0%
- By 2100
- 58,943 · -10.9%
Race, ethnicity, and origin ACS 2023
- Neighborhood character
- Diverse neighborhood (Simpson 0.56)
- Race & ethnicity
- Hispanic / Latino 50% White 44% Two or more races 16% Asian 2% Black 1%
- Hispanic origin (detail)
- Mexican 38%
- Common ancestry
- Slovak 2% Italian 1% Serbian 1%
- Foreign-born
- 9% · Canada
- Languages at home
- 73% English-only · Spanish 23% Tagalog/Filipino 1% Other Asian/Pacific 1%
Political lean MEDSL · Chaves
- 2024 margin
- Solid R (+44.8) · D 26.8% · R 71.6% · Other 1.6%
- 2008→2024 swing
- -20.2pp toward R · 2008: -24.7pp · 2024: -44.8pp
- All cycles
- 2024: R+44.8 2020: R+41.3 2016: R+36.4 2012: R+32.4 2008: R+24.7
Not yet ingested
- Civics
- —
Market trends
- HPI YoY
- ▼ -130.52%
- Current HPI
- 149.3526
- Rent YoY
- ▲ 4.32%
- Metro
- Roswell, NM
- State GDP YoY
- —
- F500 in state
- 0
Price history
+351.1% since first listed5 events — show timeline
- 2026-05-20 Listed $180,000 NMMLS
- 2025-09-22 Sold (Public Records) — Public Records
- 2025-09-22 Sold (MLS) — NMMLS
- 2025-08-24 Pending — NMMLS
- 2025-07-09 Listed $39,900 NMMLS
Property tax history
+1.6%/yrLatest (2025): $410 · -0.9% YoY. Source: county tax records.
Cash-flow waterfall
monthlySold comps — $/sqft
last 12 mo · ≤1 miLoading sold comps…