1034 Us Highway 11 · Gouverneur, NY
Flood risk No data
- FEMA flood zone
- —
- Chance of flooding over 30 yrs
- —
- Est. flood insurance / yr
- —
Fire risk No data
- Est. fire insurance / yr
- —
Heat risk No data
- Hot days now (above threshold)
- —
- Hot days in 30 yrs
- —
Wind risk No data
- Chance of severe wind over 30 yrs
- —
Air-quality risk No data
- Unhealthy air days now
- —
- Unhealthy air days in 30 yrs
- —
Risk factors via First Street. Map © Google.
Why this score? — see what drove the C- grade
The composite is a weighted blend of 9 inputs, each scored 0–100. Each bar is that input's sub-score; the figure is the points it added to the 100-point composite (weight × sub-score).
- Cash flow +15.6/30.0
- ARV discount +10.8/15.0
- Appreciation +8.1/10.0
- DSCR +4.8/10.0
- 1% rule +4.5/10.0
- Livability +3.4/5.0
- Rent growth +2.5/5.0
- Condition / age +2.5/5.0
- Schools +2.4/10.0
$114,900
🖨 Deal sheet (PDF) 📄 Offer letter ✓ Due diligence
Listing remarks MLS
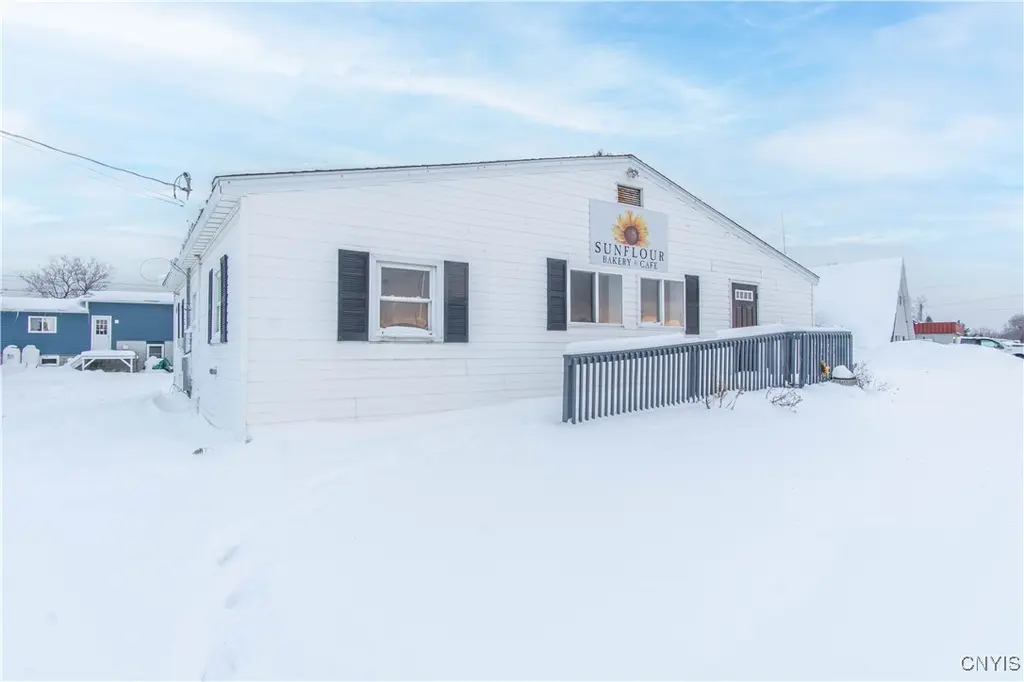
Come check out this fabulous find in the heart of Gouverneur ready for a new owner! This almost 1400SF building has tons of potential to fit a variety of needs! It can be both commercial or residential and packs a punch with a great location and an affordable price tag! Once used as a bakery, this property is well maintained and ready for whatever vision you have or the need for space for retail, office, small medical, florist, bakery or any other small business need! This would also make a great little 1-bedroom Ranch style home with plenty of parking, yard and great location surrounded by many amenities! The possibilities are endless! Owner has taken great care of this property and is ready to pass it on to new owners! Don't miss out on this one, affordable commercial locations with a building in this condition don't come along very often!! Call today!
Key facts
- Plenty of parking
- Well maintained
- 0.36 acre lot
Tags
Neighborhood map
What this means for you Summary
Snapshot
- This is a 1-bed/0.5-bath single-family listed at $115k.
Deal economics
- At list price, monthly cash flow is $49 ($586/yr) — positive.
- The deal already cash-flows at list — no discount required.
- To meet the 1% rule (rent ≥ 1% of price), the offer needs to be $109k (5.1% below list).
- Recommended offer: $101k (12.0% below list) — sets the bar for market timing.
Location & tenants
- Location reads 67/100 on livability (#605 in NY) — a middle-class / working-renter tenant base. Strengths: cost of living A+, health & safety A+, housing B+; Watch: schools D+, amenities F, commute F.
- Gouverneur Central School District (town): math 23% / reading 34% proficiency, ranked #582 of 590 in NY (top 99%) — low school quality limits family demand, transient renter base, plan for 1-2y turnover.
- Market conditions: 63 active listings in the ZIP; 215 units permitted in St. Lawrence County in 2024 (0 in 5+ unit buildings).
Forward outlook
- In year one you build about $8k of equity ($794 loan paydown + $7k appreciation (6.2% local appreciation)).
- St. Lawrence County population projected at -14% by 2050 — secular population decline; favor cash flow + early exit over multi-decade hold.
- At projected returns (6.2% appreciation + 3.0% rent growth), your $32k cash investment doubles in ~4 years — after that, you're playing with house money.
- By year 5, paydown + projected appreciation supports a ~$35k cash-out refi (75% LTV) — recoverable capital for the next deal without selling this one.
Negotiation context
- It's been on market 141 days — a 12% lower offer ($101k) is reasonable based on typical stale-listing flexibility.
- Current owner paid $25k; list at $115k implies a 360% gain — meaningful room to come down on a strong offer.
Risks & watch-outs
- Watch-outs: built in 1950 — expect roof / HVAC / electrical / plumbing capex.
Questions for the listing agent
- It's been on market 141 days. Have you received any prior offers? Is the seller open to a 12% concession, seller financing, or rate buy-down credit?
- Built in 1950 — when were the roof, HVAC, electrical panel, plumbing, and water heater last replaced?
- Why hasn't it sold? Are there any deal-killer items the seller is aware of (foundation, flood, title, zoning, code violations)?
- Is there a deadline driving the sale (1031 exchange, divorce, estate, relocation)? That informs how much negotiation room exists.
- Schools are D-rated, which usually means shorter tenancies and higher turnover. Who's the typical renter profile here, and what's been the actual vacancy rate?
- What's the average days-on-market for RENTAL listings here right now (not sales)? A rising rental-DOM trend means longer vacancies and softer asking-rent achievability than the comps imply.
- What's the recent tenant-quality profile in this submarket — average credit score on applications, eviction rate, late-payment / NSF rate, and stable-employment percentage? A property-management company in the area should have these aggregated.
- How much new for-sale + rental construction is in the pipeline within 1–3 miles? Heavy new supply typically softens prices + rents 12–24 months out; constrained supply supports both.
Investment metrics
- 1% rule
- 0.95% ✗
- Cap rate
- 6.80%
- Cash-on-cash
- 1.82%
- DSCR
- 1.08
- GRM
- 8.8
CMA / ARV
- ARV (median comp)
- $124,083
- List price
- $114,900
- Delta
- -7.40%
- Verdict
- FAIR
- Comps
- 7 within 2.0 mi
Projected returns pro-forma
6.25% appreciation · 3.0% rent growth · sell at horizon
- IRR
- 17.4%
- Equity multiple
- 2.18×
- Total profit
- $38,033
- Equity at exit
- $74,061
- IRR
- 17.1%
- Equity multiple
- 4.39×
- Total profit
- $109,061
- Equity at exit
- $135,915
Cash invested: $32,172 (down + closing). Projections, not guarantees.
Landlord ↔ Tenant lean methodology
- Overall (STATE)
- 15 Strongly Tenant-Friendly
- State New York
- 15 Strongly Tenant-Friendly · D+10
- County
- — inherits STATE
- City
- — inherits STATE
ZIP-level market 13642
- Home prices YoY
- 1.8%
- Active inventory
- 63
- Price-to-rent
- 8.8×
Monthly cashflow live
- Estimated rent
- $1,091 medium interval (Pro) →
- Mortgage (P&I)
- −$603
- Tax from tax record
- −$162 /mo · $1,949/yr
- Insurance
- −$48
- HOA
- −$0
- Vacancy / Maint / Mgmt
- −$229
- Net cashflow
- $49
Break-even live
Sensitivity live
| Price | -10% $114 | -5% $81 | +0% $49 | +5% $16 | +10% $-16 |
|---|---|---|---|---|---|
| Rent | -10% $-37 | -5% $6 | +0% $49 | +5% $92 | +10% $135 |
| Rate | -1.0pp $107 | -0.5pp $78 | base $49 | +0.5pp $19 | +1.0pp $-11 |
UW: 25.0% down · 7.5% · 30yr · 1.5% tax · 5.0% vac · 8.0% maint · 8.0% mgmt
Financing live
Cash to close
- Down payment
- $28,725
- Closing costs
- $3,447
- Reserves months
- —
- Total cash needed
- —
Loan-product check · same deal, 3 products live
Conventional
25% down · 7.5% · 30yr
- Down + closing
- —
- Monthly P&I
- —
- Monthly cashflow
- —
- DSCR
- —
- Eligible?
- —
Personal DTI + credit; lowest rate.
DSCR
20% down · 8.5% · 30yr
- Down + closing
- —
- Monthly P&I
- —
- Monthly cashflow
- —
- DSCR
- —
- Eligible?
- —
No personal income docs; deal must DSCR.
Hard money
10% down · 12.0% · 12mo
- Down + closing
- —
- Monthly P&I
- —
- Monthly cashflow
- —
- DSCR
- —
- Eligible?
- —
Short-term bridge; refi at stabilization.
Listing history 17 events
-
2026-06-21days on market $114,900 Active 141 DOM
-
2026-06-18days on market $114,900 Active 139 DOM
-
2026-06-17days on market $114,900 Active 138 DOM
-
2026-06-16days on market $114,900 Active 137 DOM
-
2026-06-15days on market $114,900 Active 136 DOM
-
2026-06-13days on market $114,900 Active 134 DOM
-
2026-06-12days on market $114,900 Active 133 DOM
-
2026-06-09days on market $114,900 Active 130 DOM
-
2026-06-08days on market $114,900 Active 129 DOM
-
2026-06-07days on market $114,900 Active 128 DOM
-
2026-06-07days on market $114,900 Active 127 DOM
-
2026-06-04days on market $114,900 Active 124 DOM
-
2026-06-02days on market $114,900 Active 123 DOM
-
2026-06-01days on market $114,900 Active 122 DOM
-
2026-05-31days on market $114,900 Active 121 DOM
-
2026-01-27$114,900 Active 866-char remark
Show marketing remark (866 chars)
Come check out this fabulous find in the heart of Gouverneur ready for a new owner! This almost 1400SF building has tons of potential to fit a variety of needs! It can be both commercial or residential and packs a punch with a great location and an affordable price tag! Once used as a bakery, this property is well maintained and ready for whatever vision you have or the need for space for retail, office, small medical, florist, bakery or any other small business need! This would also make a great little 1-bedroom Ranch style home with plenty of parking, yard and great location surrounded by many amenities! The possibilities are endless! Owner has taken great care of this property and is ready to pass it on to new owners! Don't miss out on this one, affordable commercial locations with a building in this condition don't come along very often!! Call today!
-
2011-03-01soldstatus $25,000
ⓘ Source: listings_history table (triggers on properties + properties_extension) + one-shot
backfill from property_details.listing_events for pre-trigger history.
Tax reassessment forecast NY · Partial reset (capped growth)
- Current annual tax
- $1,949 · $162/mo
- Projected year-2 tax
- $1,949 · $162/mo
- Expected delta
- $0/yr ($0/mo · 0.0%)
ⓘ Screening estimate from a state-policy table — verify with the county assessor before closing.
Nearby sold comps map
Loading sold comps map…
Walkable amenities ~0.75 mi
Loading nearby amenities…
Taxation est. · year 1
- Rental income
- $13,089
- − Mortgage interest
- −$6,436
- − Property taxes
- −$1,949
- − Insurance
- −$574
- − Repairs & maintenance
- −$1,047
- − Management
- −$1,047
- − Depreciation
- −$3,343
- Taxable loss
- −$1,308
- Est. tax savings @ 24.0%
- +$314
- After-tax cash flow
- $900/yr
For passive investors: Depreciation is non-cash, so a rental often shows a tax loss while cash-flowing — sheltering income. Rental losses are passive: they offset passive income freely, and up to $25,000/yr can offset ordinary (W-2) income if you actively participate and your MAGI is under $100k (phasing out to $0 by $150k); unused losses carry forward. On sale, claimed depreciation is recaptured at up to 25%, and gains may owe capital-gains tax (a 1031 exchange can defer both). Figures are a year-1 estimate at your 24.0% rate — not tax advice; consult a CPA.
Schools (NCES district)
- District
- Gouverneur Central School District
- NCES district ID
- 3612360
- Math proficiency
- 23% ▼ -8.00%
- Reading proficiency
- 34% ▲ 8.00%
- Median HH income
- $41,217
- Composite
- 24.08/100
- National rank
- #7757
- State rank
- #582 of 590 in NY
Livability — Gouverneur
- Score
- 67/100
- State rank
- #605
- US rank
- #10956
Category grades
Schools grade is shown separately in the Schools card above.
Census & demographics
- Population (ZIP)
- 9,018
Population outlook (St. Lawrence County) Hauer SSP2
- Today (2025)
- 110,027 people
- By 2030
- 107,455 · -2.3%
- By 2040
- 100,492 · -8.7%
- By 2050
- 94,254 · -14.3%
- By 2075
- 80,175 · -27.1%
- By 2100
- 63,140 · -42.6%
Race, ethnicity, and origin ACS 2023
- Neighborhood character
- Predominantly White (86%)
- Race & ethnicity
- White 86% Hispanic / Latino 6% Two or more races 6% Black 4%
- Hispanic origin (detail)
- Puerto Rican 2% Dominican 1%
- Common ancestry
- Lithuanian 8% Slovak 4% Serbian 2%
- Foreign-born
- 3% · Canada
- Languages at home
- 94% English-only · Spanish 3% Other Indo-European 2%
Political lean MEDSL · St. Lawrence
- 2024 margin
- R (+18.0) · D 41.0% · R 59.0%
- 2008→2024 swing
- -34.3pp toward R · 2008: 16.3pp · 2024: -18.0pp
- All cycles
- 2024: R+18.0 2020: R+11.7 2016: R+10.8 2012: D+16.6 2008: D+16.3
Not yet ingested
- Civics
- —
Market trends
- HPI YoY
- ▲ 6.25%
- Current HPI
- 349.6603
- Rent YoY
- —
- Metro
- —
- State GDP YoY
- ▲ 2.60%
- F500 in state
- 92
Industry mix (Fortune 500 HQ in NY)
| Industry | F500 HQs | Revenue |
|---|---|---|
| Financial Services | 10 | $950B |
|
||
| Consumer Goods | 9 | $162B |
|
||
| Insurance | 4 | $225B |
|
||
| Telecommunications | 2 | $144B |
|
||
| Pharmaceuticals | 2 | $112B |
|
||
| Media / Entertainment | 2 | $69B |
|
||
Price history
+359.6% since first listed2 events — show timeline
- 2026-01-27 Listed $114,900 CNYIS
- 2011-03-01 Sold (Public Records) $25,000 Public Records
Property tax history
+3.3%/yrLatest (2025): $1,949 · +1.5% YoY. Source: county tax records.
Cash-flow waterfall
monthlySold comps — $/sqft
last 12 mo · ≤1 miLoading sold comps…