 🏷️ Likely Rental
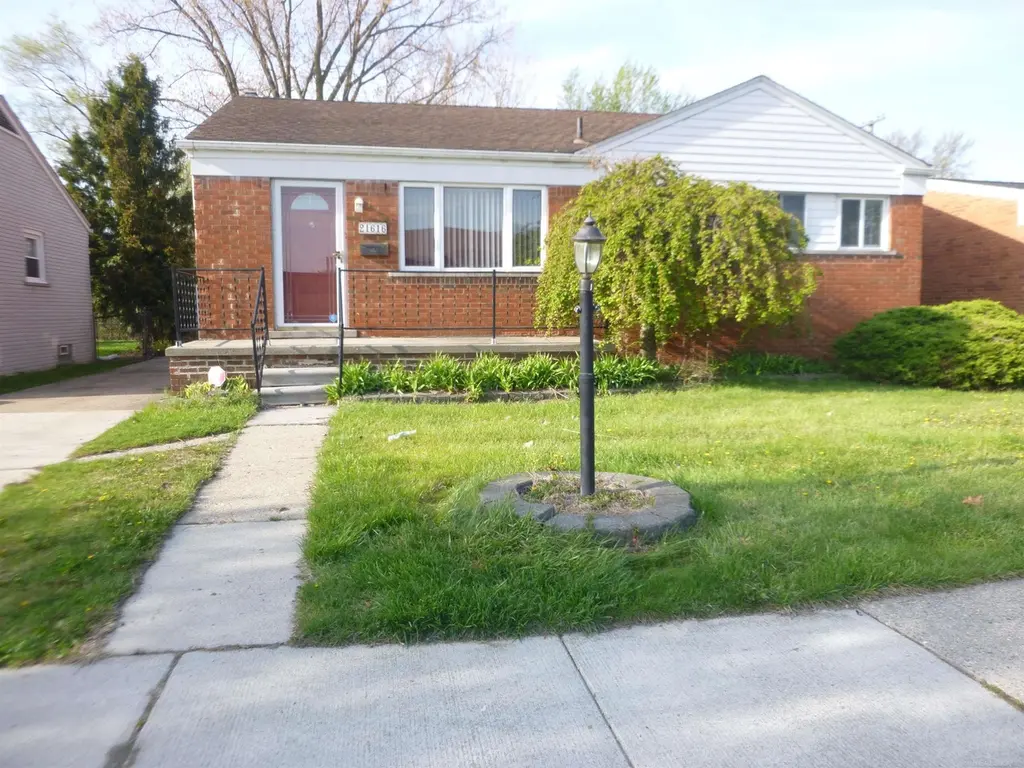
21616 Lanse St · St. Clair Shores, MI
Flood risk 1/10 · Minimal
- FEMA flood zone
- X (unshaded)
- Chance of flooding over 30 yrs
- 0.0%
- Est. flood insurance / yr
- $507 – $1,088
Fire risk 1/10 · Minimal
- Est. fire insurance / yr
- $784 – $1,456
Heat risk 3/10 · Minor
- Hot days now (above 96°F)
- 7 days/yr
- Hot days in 30 yrs
- 15 days/yr
Wind risk 1/10 · Minimal
- Chance of severe wind over 30 yrs
- —
Air-quality risk 4/10 · Minor
- Unhealthy air days now
- 4 days/yr
- Unhealthy air days in 30 yrs
- 5 days/yr
Risk factors via First Street. Map © Google.
Why this score? — see what drove the D grade
The composite is a weighted blend of 9 inputs, each scored 0–100. Each bar is that input's sub-score; the figure is the points it added to the 100-point composite (weight × sub-score).
- Cash flow +15.0/30.0
- ARV discount +7.5/15.0
- 1% rule +5.0/10.0
- DSCR +5.0/10.0
- Schools +2.7/10.0
- Rent growth +2.5/5.0
- Livability +2.5/5.0
- Condition / age +2.5/5.0
- Appreciation +0.0/10.0
$1,650
🖨 Deal sheet 📄 Offer letter ✓ Due diligence
Listing remarks MLS
Beautiful Ranch for rent. New Paint and Carpet throughout. Great Home with larger Kitchen and all new appliances.
Key facts
- 5,663 sq ft lot
- 2 garage spots
- Built 1956
Property features AI
Finance
- Other: Listed by MiRealSource
- HOA & community: Homeowners association present
Exterior
- Parking: Detached 2-car garage
- Utilities: Public water; Public sewer
- Home design: Single-family residence; One level
- Construction: Brick construction; 1,092 above-grade finished area; 800 below-grade finished area
- Exterior features: Lot approximately 50 x 110 (0.13 acres); Subdivision: Lanse Creuse Gardens; Located north of Martin Rd and east of Harper
Interior
- Bathrooms: 2 full bathrooms
- Heating & cooling: Forced air heating (natural gas); No central cooling
- Interior features: Full basement; 3 total rooms
Neighborhood map
What this means for you Summary
Snapshot
- This is a 3-bed/2.0-bath single-family listed at $2k.
Deal economics
- At list price, monthly cash flow is $1k ($12k/yr) — positive.
- The deal already cash-flows at list — no discount required.
- Meets the 1% rule at list price ($1k rent vs $2k).
- Cap rate 761.6% vs local median 4.2% in St. Clair Shores — top-decile yield for the area; either an underpriced asset or a hidden risk that comps aren't pricing in. Stress-test before assuming the spread holds.
Location & tenants
- Location reads: area grade D — affects rentability + tenant quality, not the cash-flow math above.
- Lake Shore Public Schools (Macomb) (suburban): math 22% / reading 40% proficiency, ranked #334 of 540 in MI (top 62%) — families likely to look elsewhere, expect single-tenant / working-renter base with shorter leases.
- Market conditions: 114 active listings in the ZIP; 9 comparable units currently listed for rent nearby; rentals at typical pace (median 25d on market — plan ~3-4 weeks tenant-placement turnaround); 1,321 units permitted in Macomb County in 2024 (86 in 5+ unit buildings).
Forward outlook
- Local home prices are declining (-3.0%/yr); year-one equity from $12 of loan paydown is wiped out by about $50 of value loss. Plan a longer hold.
- Macomb County population projected at +9% by 2050 — modest demand growth; plan on rents tracking national, not racing it.
- At projected returns (-3.0% appreciation + 3.0% rent growth), your $462 cash investment doubles in ~1 year — after that, you're playing with house money.
Negotiation context
- Only 1 days on market — expect competitive offers; lowballing is unlikely to land.
- 14 sale attempts since 30y ago with the ask held roughly flat each time — persistent listings suggest the price (not the market) is what's stuck; bring a comps-based counter.
Risks & watch-outs
- Watch-outs: built in 1956 — expect roof / HVAC / electrical / plumbing capex.
Questions for the listing agent
- Built in 1956 — when were the roof, HVAC, electrical panel, plumbing, and water heater last replaced?
- Is there a deadline driving the sale (1031 exchange, divorce, estate, relocation)? That informs how much negotiation room exists.
- The area grade is low — what's the realistic commute time and amenity access for the typical tenant pool here? Any planned neighborhood developments (good or bad) we should know about?
- What's the average days-on-market for RENTAL listings here right now (not sales)? A rising rental-DOM trend means longer vacancies and softer asking-rent achievability than the comps imply.
- What's the recent tenant-quality profile in this submarket — average credit score on applications, eviction rate, late-payment / NSF rate, and stable-employment percentage? A property-management company in the area should have these aggregated.
- How much new for-sale + rental construction is in the pipeline within 1–3 miles? Heavy new supply typically softens prices + rents 12–24 months out; constrained supply supports both.
Investment metrics
- 1% rule
- 80.55% ✓
- Cap rate
- 761.64%
- Cash-on-cash
- 2697.67%
- DSCR
- 121.03
- GRM
- 0.1
CMA / ARV
- ARV (on-the-fly)
- $236,379
- Comps found
- 12
Show comp detail 12 sales within ~0.75 mi
| Address | Dist | Beds/Ba | Sqft | Sold | Price | $/sf | Match |
|---|---|---|---|---|---|---|---|
| 29010 Taylor St | 0.20mi | 3/1.5 | 1,143 (+1%) | 1mo | $197,000 | $172 | 86 |
| 22411 Lanse St | 0.44mi | 3/1.5 | 1,111 (-2%) | 3mo | $226,300 | $204 | 72 |
| 22016 Visnaw St | 0.25mi | 3/1.5 | 1,032 (-9%) | 7mo | $263,000 | $255 | 66 |
| 21221 Gordon Rd | 0.39mi | 3/1.0 | 1,064 (-6%) | 3mo | $254,900 | $240 | 65 |
| 22623 Barton St | 0.56mi | 2/1.0 (-1) | 1,160 (+3%) | 2mo | $200,000 | $172 | 59 |
| 27941 Florence St | 0.52mi | 3/1.5 | 1,062 (-6%) | 9mo | $223,700 | $211 | 56 |
| 22319 Gordon Rd | 0.41mi | 3/2.0 | 1,286 (+14%) | 8mo | $305,000 | $237 | 51 |
| 28008 Elba St | 0.60mi | 3/2.0 | 1,285 (+14%) | 1mo | $269,000 | $209 | 49 |
| 28004 Roy St | 0.48mi | 3/2.0 | 1,290 (+14%) | 7mo | $269,900 | $209 | 48 |
| 22416 Furton St | 0.63mi | 3/1.5 | 986 (-13%) | 1mo | $167,000 | $169 | 46 |
| 28113 Shock St | 0.70mi | 2/1.0 (-1) | 1,089 (-4%) | 7mo | $145,000 | $133 | 46 |
| 28806 Jane St | 0.73mi | 3/1.5 | 1,041 (-8%) | 6mo | $224,500 | $216 | 46 |
Match score weights: distance 35% · size 25% · config 20% · recency 20%. Top-matched comps best support the ARV.
Projected returns pro-forma
-3.0% appreciation · 3.0% rent growth · sell at horizon
- IRR
- —
- Equity multiple
- 143.64×
- Total profit
- $65,902
- Equity at exit
- $246
- IRR
- —
- Equity multiple
- 309.76×
- Total profit
- $142,645
- Equity at exit
- $143
Cash invested: $462 (down + closing). Projections, not guarantees.
Landlord ↔ Tenant lean methodology
- Overall (STATE)
- 62 Landlord-Friendly
- State Michigan
- 62 Landlord-Friendly · EVEN
- County
- — inherits STATE
- City
- — inherits STATE
ZIP-level market 48081
- Active inventory
- 114
- Price-to-rent
- 0.1×
Monthly cashflow live
- Estimated rent
- $1,329 high interval (Pro) →
- Mortgage (P&I)
- −$9
- Tax est. 1.5%
- −$2 /mo · $25/yr
- Insurance
- −$1
- HOA
- −$0
- Vacancy / Maint / Mgmt
- −$279
- Net cashflow
- $1,039
Break-even live
UW: 25.0% down · 7.5% · 30yr · 1.5% tax · 5.0% vac · 8.0% maint · 8.0% mgmt
Financing live
Cash to close
- Down payment
- $412
- Closing costs
- $50
- Reserves months
- —
- Total cash needed
- —
Loan-product check · same deal, 3 products live
Conventional
25% down · 7.5% · 30yr
- Down + closing
- —
- Monthly P&I
- —
- Monthly cashflow
- —
- DSCR
- —
- Eligible?
- —
Personal DTI + credit; lowest rate.
DSCR
20% down · 8.5% · 30yr
- Down + closing
- —
- Monthly P&I
- —
- Monthly cashflow
- —
- DSCR
- —
- Eligible?
- —
No personal income docs; deal must DSCR.
Hard money
10% down · 12.0% · 12mo
- Down + closing
- —
- Monthly P&I
- —
- Monthly cashflow
- —
- DSCR
- —
- Eligible?
- —
Short-term bridge; refi at stabilization.
Rent comps 9 comps
| Address | Beds | Baths | Sqft | Rent | $/sqft | DOM | Units | Dist |
|---|---|---|---|---|---|---|---|---|
| 21540 Saint Gertrude St #12 Saint Clair Shores, MI | 2.0 | 1.5 | 871 | $1,200 | $1.38 | 24d | 1 | 0.07mi |
| 22412 Milner St Saint Clair Shores, MI | 3.0 | 1.0 | 1060 | $2,000 | $1.89 | 1d | 1 | 0.88mi |
| 30600 Little Mack Ave Roseville, MI | 1.0–2.0 | 1.0 | 900 | $1,210 | $1.34 | 1d | 6 | 1.20mi |
| 26324 Harper Ave Unit 6 St Clair Shores, MI | 3.0 | 1.0 | 1100 | $1,345 | $1.22 | 24d | 1 | 1.30mi |
| 26324 Harper Unit 4 St Clair Shores, MI | 2.0 | 1.0 | 700 | $1,195 | $1.71 | 24d | 1 | 1.30mi |
| 27881 O Neil Roseville, MI | 3.0 | 1.0 | 1300 | $1,300 | $1.00 | 24d | 1 | 1.33mi |
| 27547 O Neil Roseville, MI | 3.0 | 1.0 | 1014 | $1,350 | $1.33 | 4d | 1 | 1.37mi |
| 31635 Couchez St St Clair Shores, MI | 2.0 | 1.5 | 1015 | $1,600 | $1.58 | 43d | 1 | 1.42mi |
| 19236 Florida St Roseville, MI | 2.0 | 1.0 | 1160 | $1,700 | $1.47 | 1d | 1 | 1.47mi |
Listing history 36 events
-
2026-05-26$1,650 Active
Show marketing remark (113 chars)
Beautiful Ranch for rent. New Paint and Carpet throughout. Great Home with larger Kitchen and all new appliances.
-
2026-05-26$1,650 Active 113-char remark
Show marketing remark (113 chars)
Beautiful Ranch for rent. New Paint and Carpet throughout. Great Home with larger Kitchen and all new appliances.
-
2015-08-06soldstatus $95,175 Sold 297-char remark
Show marketing remark (297 chars)
Make it yours! Terrific St Clair Shores brick ranch with 3 bedrooms. Open layout with dining area in kitchen and door wall leading to backyard. Finished basement with full bathroom. Freshly painted with new carpet. Conveniently located across from elementary school. This is a Fannie Mae property.
-
2015-08-06soldstatus $95,175 Closed
Show marketing remark (297 chars)
Make it yours! Terrific St Clair Shores brick ranch with 3 bedrooms. Open layout with dining area in kitchen and door wall leading to backyard. Finished basement with full bathroom. Freshly painted with new carpet. Conveniently located across from elementary school. This is a Fannie Mae property.
-
2015-08-06soldstatus $95,175
Show marketing remark (297 chars)
Make it yours! Terrific St Clair Shores brick ranch with 3 bedrooms. Open layout with dining area in kitchen and door wall leading to backyard. Finished basement with full bathroom. Freshly painted with new carpet. Conveniently located across from elementary school. This is a Fannie Mae property.
-
2015-07-17historical 297-char remark
Show marketing remark (297 chars)
Make it yours! Terrific St Clair Shores brick ranch with 3 bedrooms. Open layout with dining area in kitchen and door wall leading to backyard. Finished basement with full bathroom. Freshly painted with new carpet. Conveniently located across from elementary school. This is a Fannie Mae property.
-
2015-07-14status Pending
-
2015-06-14$94,900 Active 297-char remark
Show marketing remark (297 chars)
Make it yours! Terrific St Clair Shores brick ranch with 3 bedrooms. Open layout with dining area in kitchen and door wall leading to backyard. Finished basement with full bathroom. Freshly painted with new carpet. Conveniently located across from elementary school. This is a Fannie Mae property.
-
2015-06-14$94,900 Active
Show marketing remark (297 chars)
Make it yours! Terrific St Clair Shores brick ranch with 3 bedrooms. Open layout with dining area in kitchen and door wall leading to backyard. Finished basement with full bathroom. Freshly painted with new carpet. Conveniently located across from elementary school. This is a Fannie Mae property.
-
2015-06-14$94,900
Show marketing remark (297 chars)
Make it yours! Terrific St Clair Shores brick ranch with 3 bedrooms. Open layout with dining area in kitchen and door wall leading to backyard. Finished basement with full bathroom. Freshly painted with new carpet. Conveniently located across from elementary school. This is a Fannie Mae property.
-
2015-06-12historical
-
2015-06-12historical
-
2015-05-08price $99,900
-
2015-05-08price $99,900
-
2015-04-30status Active
-
2015-04-30status Active
-
2015-04-02status Pending
-
2015-04-02historical
-
2015-03-26price $104,900
-
2015-03-25price $104,900
-
2015-03-09status Active
-
2015-03-09status Active
-
2015-02-20historical
-
2015-02-20status Pending
-
2015-02-12$107,100 Active
-
2015-02-12$107,100 Active
-
2012-11-05historical
-
2012-06-26$80,000
-
2000-08-30soldstatus $143,000
-
2000-06-26soldstatus $143,000
-
2000-05-30historical
-
2000-05-03$145,000
-
1996-04-16soldstatus $100,000
-
1996-02-23soldstatus $100,000
-
1996-01-13historical
-
1996-01-10$98,500
ⓘ Source: listings_history table (triggers on properties + properties_extension) + one-shot
backfill from property_details.listing_events for pre-trigger history.
Climate risk First Street
- Flood 1/10 Low FEMA zone X (unshaded) · 0% chance over 30 yrs
- Wildfire 1/10 Low
- Heat 3/10 Moderate 7 d/yr ≥96°F today · 15 d/yr by 30 yrs out
- Wind 1/10 Low
- Air quality 4/10 Moderate 4 unhealthy d/yr today · 5 by 30 yrs out
Nearby sold comps map
Loading sold comps map…
Walkable amenities ~0.75 mi
Loading nearby amenities…
Taxation est. · year 1
- Rental income
- $15,949
- − Mortgage interest
- −$92
- − Property taxes
- −$25
- − Insurance
- −$8
- − Repairs & maintenance
- −$1,276
- − Management
- −$1,276
- − Depreciation
- −$48
- Taxable income
- $13,224
- Est. tax owed @ 24.0%
- −$3,174
- After-tax cash flow
- $9,289/yr
For passive investors: Depreciation is non-cash, so a rental often shows a tax loss while cash-flowing — sheltering income. Rental losses are passive: they offset passive income freely, and up to $25,000/yr can offset ordinary (W-2) income if you actively participate and your MAGI is under $100k (phasing out to $0 by $150k); unused losses carry forward. On sale, claimed depreciation is recaptured at up to 25%, and gains may owe capital-gains tax (a 1031 exchange can defer both). Figures are a year-1 estimate at your 24.0% rate — not tax advice; consult a CPA.
Schools (NCES district)
- District
- Lake Shore Public Schools (Macomb)
- NCES district ID
- 2632670
- Math proficiency
- 22% ▼ -16.00%
- Reading proficiency
- 40% ▼ -9.00%
- Median HH income
- $53,782
- Composite
- 27.32/100
- National rank
- #6993
- State rank
- #334 of 540 in MI
Livability — St. Clair Shores
No livability data for this city. (Only ~50 U.S. cities are tracked.)
Census & demographics
- Census place
- St. Clair Shores, MI
- City population
- 58,217
- Population (ZIP)
- 20,254
Population outlook (Macomb County) Hauer SSP2
- Today (2025)
- 925,296 people
- By 2030
- 948,226 · +2.5%
- By 2040
- 983,961 · +6.3%
- By 2050
- 1,010,200 · +9.2%
- By 2075
- 1,076,222 · +16.3%
- By 2100
- 1,077,065 · +16.4%
Race, ethnicity, and origin ACS 2023
- Neighborhood character
- Predominantly White (92%)
- Race & ethnicity
- White 92% Two or more races 4% Black 3% Hispanic / Latino 2%
- Common ancestry
- Romanian 17% Lithuanian 6% Iranian 2%
- Foreign-born
- 3% · Canada
- Languages at home
- 96% English-only · Russian/Polish/Slavic 1% Other Indo-European 1% Other Asian/Pacific 1%
Political lean MEDSL · Macomb
- 2024 margin
- R (+13.7) · D 42.2% · R 55.9% · Other 1.9%
- 2008→2024 swing
- -22.3pp toward R · 2008: 8.6pp · 2024: -13.7pp
- All cycles
- 2024: R+13.7 2020: R+8.1 2016: R+11.6 2012: D+4.0 2008: D+8.6
Not yet ingested
- Civics
- —
Market trends
- HPI YoY
- ▼ -271.01%
- Current HPI
- 206.6455
- Rent YoY
- —
- Metro
- —
- State GDP YoY
- ▲ 1.37%
- F500 in state
- 28
Industry mix (Fortune 500 HQ in MI)
| Industry | F500 HQs | Revenue |
|---|---|---|
| Automotive Parts | 3 | $48B |
|
||
| Automotive | 2 | $372B |
|
||
| Chemicals | 1 | $45B |
|
||
| Automotive Retail | 1 | $29B |
|
||
| Healthcare / Medical Devices | 1 | $23B |
|
||
| Automotive Technology | 1 | $20B |
|
||
Price history
-98.3% since first listed36 events — show timeline
- 2026-05-26 Listed $1,650 REALCOMP
- 2026-05-26 Listed $1,650 MiRealSource-MiMLS
- 2015-08-06 Sold (MLS) $95,175 MiRealSource-MiMLS
- 2015-08-06 Sold (MLS) $95,175 MiRealSource-MiMLS
- 2015-08-06 Sold (MLS) $95,175 REALCOMP
- 2015-07-17 Listing Removed — REALCOMP
- 2015-07-14 Pending — MiRealSource-MiMLS
- 2015-06-14 Listed $94,900 REALCOMP
- 2015-06-14 Listed $94,900 MiRealSource-MiMLS
- 2015-06-14 Listed $94,900 MiRealSource-MiMLS
- 2015-06-12 Listing Removed — MiRealSource-MiMLS
- 2015-06-12 Listing Removed — REALCOMP
- 2015-05-08 Price Changed $99,900 MiRealSource-MiMLS
- 2015-05-08 Price Changed $99,900 REALCOMP
- 2015-04-30 Relisted — MiRealSource-MiMLS
- 2015-04-30 Relisted — REALCOMP
- 2015-04-02 Pending — MiRealSource-MiMLS
- 2015-04-02 Listing Removed — REALCOMP
- 2015-03-26 Price Changed $104,900 MiRealSource-MiMLS
- 2015-03-25 Price Changed $104,900 REALCOMP
- 2015-03-09 Relisted — REALCOMP
- 2015-03-09 Relisted — MiRealSource-MiMLS
- 2015-02-20 Listing Removed — REALCOMP
- 2015-02-20 Pending — MiRealSource-MiMLS
- 2015-02-12 Listed $107,100 MiRealSource-MiMLS
- 2015-02-12 Listed $107,100 REALCOMP
- 2012-11-05 Listing Removed — REALCOMP
- 2012-06-26 Listed $80,000 REALCOMP
- 2000-08-30 Sold (Public Records) $143,000 Public Records
- 2000-06-26 Sold (MLS) $143,000 MiRealSource-MiMLS
- 2000-05-30 Listing Removed — MiRealSource-MiMLS
- 2000-05-03 Listed $145,000 MiRealSource-MiMLS
- 1996-04-16 Sold (MLS) $100,000 MiRealSource-MiMLS
- 1996-02-23 Sold (Public Records) $100,000 Public Records
- 1996-01-13 Listing Removed — MiRealSource-MiMLS
- 1996-01-10 Listed $98,500 MiRealSource-MiMLS
Property tax history
+4.8%/yrLatest (2025): $4,512 · +2.9% YoY. Source: county tax records.
Cash-flow waterfall
monthlySold comps — $/sqft
last 12 mo · ≤1 miLoading sold comps…