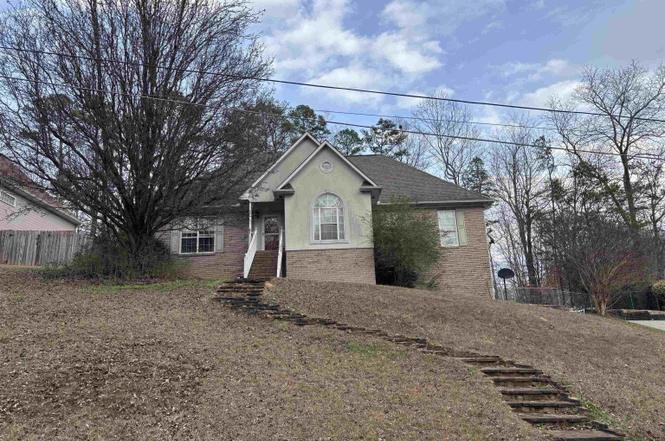
6805 Ashberry Dr · Pinson, AL
Flood risk 1/10 · Minimal
- FEMA flood zone
- X (unshaded)
- Chance of flooding over 30 yrs
- 0.0%
- Est. flood insurance / yr
- $507 – $1,088
Fire risk 4/10 · Minor
- Est. fire insurance / yr
- $916 – $1,700
Heat risk 6/10 · Moderate
- Hot days now (above 105°F)
- 7 days/yr
- Hot days in 30 yrs
- 19 days/yr
Wind risk 6/10 · Moderate
- Chance of severe wind over 30 yrs
- 27.0%
Air-quality risk 5/10 · Moderate
- Unhealthy air days now
- 6 days/yr
- Unhealthy air days in 30 yrs
- 11 days/yr
Risk factors via First Street. Map © Google.
Why this score? — see what drove the D+ grade
The composite is a weighted blend of 9 inputs, each scored 0–100. Each bar is that input's sub-score; the figure is the points it added to the 100-point composite (weight × sub-score).
- ARV discount +15.0/15.0
- Cash flow +14.2/30.0
- DSCR +4.3/10.0
- Livability +3.0/5.0
- 1% rule +2.9/10.0
- Rent growth +2.9/5.0
- Condition / age +2.5/5.0
- Schools +1.8/10.0
- Appreciation +0.0/10.0
$215,000
🖨 Deal sheet 📄 Offer letter ✓ Due diligence
Listing remarks
Investor special with strong upside potential! This 3-bedroom, 2-bath fixer-upper is located in a highly desirable neighborhood near the high school, making it an ideal candidate for a flip, rental, or long-term hold. The home offers a functional layout with a formal dining room, spacious living room, eat-in kitchen, and a large primary bedroom with en suite bath. One of the standout features is the HUGE basement, providing extensive space for vehicle parking, storage, workshop use, or future bonus living space—adding significant value potential. The fenced backyard enhances rental appeal and resale value. With solid bones, generous square footage, and a prime location, this property
Key facts
- Huge basement
- Formal dining room
- Eat-in kitchen
Tags
Neighborhood map
What this means for you Summary
Snapshot
- This is a 3-bed/2.0-bath single-family listed at $215k.
Deal economics
- At list price, monthly cash flow is $36 ($429/yr) — positive.
- The deal already cash-flows at list — no discount required.
- To meet the 1% rule (rent ≥ 1% of price), the offer needs to be $171k (20.6% below list).
- Recommended offer: $171k (20.6% below list) — sets the bar for 1% rule.
- Cap rate 6.5% vs local median 5.3% in Pinson — meaningfully above typical; check what's discounted (condition, days-on-market, listing class) to confirm the premium yield is real.
Location & tenants
- Location reads 60/100 on livability (#289 in AL) — a middle-class / working-renter tenant base. Strengths: cost of living A+, housing A+, crime B+; Watch: amenities F, commute F, health & safety F.
- Jefferson County (suburban): math 9% / reading 32% proficiency, ranked #104 of 129 in AL (top 81%) — low school quality limits family demand, transient renter base, plan for 1-2y turnover.
- Zoned schools: Pinson Elementary School (801 students, 54% FRL); Pinson Valley High School (math 6% / reading 17%, grade F, #246 of 305 statewide, top 81%, 1,029 students, 81% FRL) — zoned schools average 68% FRL vs 49% district-wide (19 pts higher); higher-poverty schools than district average — tighter screening recommended.
- Market conditions: Rents rising (+1.6%/yr); 186 active listings in the ZIP; 17 comparable units currently listed for rent nearby; rentals at typical pace (median 22d on market — plan ~3-4 weeks tenant-placement turnaround); solid renter incomes; 2,114 units permitted in Jefferson County in 2024 (556 in 5+ unit buildings).
Forward outlook
- Local home prices are declining (-3.0%/yr); year-one equity from $1k of loan paydown is wiped out by about $6k of value loss. Plan a longer hold.
- Jefferson County population projected to shrink 4% by 2050 — rents likely to lag national; underwrite the cash flow, not the appreciation.
Negotiation context
- It's been on market 42 days — a 3% lower offer ($209k) is reasonable based on typical stale-listing flexibility.
- Current owner paid $164k; 31% above their basis — modest negotiation headroom, anchor on the comps not their cost.
Risks & watch-outs
- Climate carrying-cost: major wind risk, 27% chance of damaging wind over 30y; extreme-heat days projected 7→19/yr by 2055 (HVAC capex compounding) — expect insurance premiums to compound above CPI over the hold.
Questions for the listing agent
- It's been on market 42 days. Have you received any prior offers? Is the seller open to a 21% concession, seller financing, or rate buy-down credit?
- What does the HOA fee cover, when was the last increase, and are there any pending special assessments or reserve-fund shortfalls?
- Is there a deadline driving the sale (1031 exchange, divorce, estate, relocation)? That informs how much negotiation room exists.
- Schools are D-rated, which usually means shorter tenancies and higher turnover. Who's the typical renter profile here, and what's been the actual vacancy rate?
- The area grade is low — what's the realistic commute time and amenity access for the typical tenant pool here? Any planned neighborhood developments (good or bad) we should know about?
- What's the average days-on-market for RENTAL listings here right now (not sales)? A rising rental-DOM trend means longer vacancies and softer asking-rent achievability than the comps imply.
- What's the recent tenant-quality profile in this submarket — average credit score on applications, eviction rate, late-payment / NSF rate, and stable-employment percentage? A property-management company in the area should have these aggregated.
- How much new for-sale + rental construction is in the pipeline within 1–3 miles? Heavy new supply typically softens prices + rents 12–24 months out; constrained supply supports both.
Investment metrics
- 1% rule
- 0.79% ✗
- Cap rate
- 6.49%
- Cash-on-cash
- 0.71%
- DSCR
- 1.03
- GRM
- 10.5
CMA / ARV
- ARV (on-the-fly)
- $304,558
- Comps found
- 12
Show comp detail 12 sales within ~0.75 mi
| Address | Dist | Beds/Ba | Sqft | Sold | Price | $/sf | Match |
|---|---|---|---|---|---|---|---|
| 4556 Morgan Dr | 0.23mi | 3/2.0 | 1,648 (-4%) | 1mo | $319,900 | $194 | 83 |
| 6750 Ridgewood Dr | 0.53mi | 3/2.0 | 1,702 (-0%) | 0mo | $229,000 | $135 | 74 |
| 6749 Crossbrook Ln | 0.34mi | 3/2.0 | 1,806 (+6%) | 2mo | $239,900 | $133 | 73 |
| 6912 Brandi Cir | 0.18mi | 3/2.0 | 1,863 (+9%) | 9mo | $331,900 | $178 | 69 |
| 6908 Brandi Cir | 0.18mi | 3/2.0 | 1,610 (-6%) | 16mo | $313,900 | $195 | 68 |
| 4557 Morgan Dr | 0.23mi | 3/2.0 | 1,610 (-6%) | 14mo | $316,000 | $196 | 68 |
| 4529 Morgan Dr | 0.23mi | 3/2.0 | 1,610 (-6%) | 16mo | $297,900 | $185 | 66 |
| 4549 Morgan Dr | 0.34mi | 3/2.0 | 1,863 (+9%) | 6mo | $333,900 | $179 | 64 |
| 6909 Brandi Cir | 0.22mi | 3/2.0 | 1,863 (+9%) | 13mo | $327,900 | $176 | 64 |
| 6881 Briarwood Dr | 0.54mi | 3/2.0 | 1,775 (+4%) | 8mo | $210,000 | $118 | 62 |
| 6701 Brittany Pl | 0.37mi | 4/3.0 (+1) | 1,619 (-5%) | 11mo | $218,000 | $135 | 56 |
| 6839 Briarwood Dr | 0.58mi | 4/2.0 (+1) | 1,597 (-7%) | 8mo | $150,970 | $95 | 50 |
Match score weights: distance 35% · size 25% · config 20% · recency 20%. Top-matched comps best support the ARV.
Projected returns pro-forma
-3.0% appreciation · 1.61% rent growth · sell at horizon
- IRR
- -16.6%
- Equity multiple
- 0.42×
- Total profit
- $-34,996
- Equity at exit
- $32,057
- IRR
- -10.9%
- Equity multiple
- 0.38×
- Total profit
- $-37,262
- Equity at exit
- $18,589
Cash invested: $60,200 (down + closing). Projections, not guarantees.
Landlord ↔ Tenant lean methodology
- Overall (STATE)
- 90 Strongly Landlord-Friendly
- State Alabama
- 90 Strongly Landlord-Friendly · R+15
- County
- — inherits STATE
- City
- — inherits STATE
ZIP-level market 35126
- Home prices YoY
- -22.4%
- Rents YoY
- 1.6%
- Active inventory
- 186
- Price-to-rent
- 10.5×
Monthly cashflow live
- Estimated rent
- $1,707 high interval (Pro) →
- Mortgage (P&I)
- −$1,127
- Tax from tax record
- −$78 /mo · $940/yr
- Insurance
- −$90
- HOA
- −$17
- Vacancy / Maint / Mgmt
- −$358
- Net cashflow
- $36
Break-even live
UW: 25.0% down · 7.5% · 30yr · 1.5% tax · 5.0% vac · 8.0% maint · 8.0% mgmt
Financing live
Cash to close
- Down payment
- $53,750
- Closing costs
- $6,450
- Reserves months
- —
- Total cash needed
- —
Loan-product check · same deal, 3 products live
Conventional
25% down · 7.5% · 30yr
- Down + closing
- —
- Monthly P&I
- —
- Monthly cashflow
- —
- DSCR
- —
- Eligible?
- —
Personal DTI + credit; lowest rate.
DSCR
20% down · 8.5% · 30yr
- Down + closing
- —
- Monthly P&I
- —
- Monthly cashflow
- —
- DSCR
- —
- Eligible?
- —
No personal income docs; deal must DSCR.
Hard money
10% down · 12.0% · 12mo
- Down + closing
- —
- Monthly P&I
- —
- Monthly cashflow
- —
- DSCR
- —
- Eligible?
- —
Short-term bridge; refi at stabilization.
Rent comps 17 comps
| Address | Beds | Baths | Sqft | Rent | $/sqft | DOM | Units | Dist |
|---|---|---|---|---|---|---|---|---|
| 6937 Brandi Cir Pinson, AL | 3.0 | 2.0 | 1648 | $1,735 | $1.05 | 3d | 1 | 0.24mi |
| 4627 Lakes Edge Cv Pinson, AL | 3.0 | 2.0 | 1262 | $1,496 | $1.19 | 23d | 1 | 0.25mi |
| 4541 Morgan Dr Pinson, AL | 3.0 | 2.0 | 1610 | $1,795 | $1.11 | 11d | 1 | 0.31mi |
| 6916 Brittany Ln Pinson, AL | 3.0 | 2.0 | 1305 | $1,665 | $1.28 | 3d | 1 | 0.38mi |
| 6825 Brittany Pl Pinson, AL | 3.0 | 2.0 | 1232 | $1,573 | $1.28 | 23d | 1 | 0.42mi |
| 6877 Briarwood Dr Pinson, AL | 3.0 | 2.0 | 1390 | $1,595 | $1.15 | 43d | 1 | 0.53mi |
| 6820 Briarwood Dr Pinson, AL | 4.0 | 3.0 | 1605 | $1,845 | $1.15 | 3d | 1 | 0.56mi |
| 5421 Faucett Rd Pinson, AL | 3.0 | 2.0 | 1248 | $1,195 | $0.96 | 3d | 1 | 0.91mi |
| 5433 Faucett Rd Pinson, AL | 3.0 | 2.0 | 1148 | $1,395 | $1.22 | 10d | 1 | 0.91mi |
| 4832 Deer Foot Cv Pinson, AL | 3.0 | 2.0 | 1714 | $1,556 | $0.91 | 21d | 1 | 1.03mi |
| 7304 Plantation Rd Pinson, AL | 4.0 | 2.0 | 1904 | $1,875 | $0.98 | 21d | 1 | 1.08mi |
| 4800 Deer Foot Cv Pinson, AL | 3.0 | 2.0 | 1550 | $1,730 | $1.12 | 43d | 1 | 1.11mi |
| 7436 Hitching Post Dr Pinson, AL | 3.0 | 1.0 | 1980 | $1,350 | $0.68 | 16d | 1 | 1.19mi |
| 6594 Davison Rd Pinson, AL | 3.0 | 2.0 | 1304 | $1,650 | $1.27 | 23d | 1 | 1.28mi |
| 6568 Davison Rd Pinson, AL | 3.0 | 2.0 | 1054 | $1,435 | $1.36 | 43d | 1 | 1.30mi |
| 6541 Womack Rd Pinson, AL | 3.0 | 2.0 | 1146 | $1,470 | $1.28 | 23d | 1 | 1.39mi |
| 6599 Womack Rd Pinson, AL | 4.0 | 2.0 | 1650 | $1,870 | $1.13 | 2d | 1 | 1.43mi |
HOA detail
- Monthly dues
- $17 · $204/yr
Listing history 5 events
-
2026-03-22status Pending
-
2026-03-04price $215,000
-
2026-02-07$225,000 Active
-
2004-06-15soldstatus $163,500
-
2002-02-27soldstatus $145,100
ⓘ Source: listings_history table (triggers on properties + properties_extension) + one-shot
backfill from property_details.listing_events for pre-trigger history.
Tax reassessment forecast AL · Resets to sale price
- Current annual tax
- $940 · $78/mo
- Projected year-2 tax
- $940 · $78/mo
- Expected delta
- $0/yr ($0/mo · -0.0%)
ⓘ Screening estimate from a state-policy table — verify with the county assessor before closing.
Climate risk First Street
- Flood 1/10 Low FEMA zone X (unshaded) · 0% chance over 30 yrs
- Wildfire 4/10 Moderate
- Heat 6/10 Major 7 d/yr ≥105°F today · 19 d/yr by 30 yrs out
- Wind 6/10 Major 27% chance of damaging wind over 30 yrs
- Air quality 5/10 Major 6 unhealthy d/yr today · 11 by 30 yrs out
Nearby sold comps map
Loading sold comps map…
Walkable amenities ~0.75 mi
Loading nearby amenities…
Taxation est. · year 1
- Rental income
- $20,479
- − Mortgage interest
- −$12,043
- − Property taxes
- −$940
- − Insurance
- −$1,075
- − Repairs & maintenance
- −$1,638
- − Management
- −$1,638
- − HOA
- −$204
- − Depreciation
- −$6,255
- Taxable loss
- −$3,315
- Est. tax savings @ 24.0%
- +$796
- After-tax cash flow
- $1,225/yr
For passive investors: Depreciation is non-cash, so a rental often shows a tax loss while cash-flowing — sheltering income. Rental losses are passive: they offset passive income freely, and up to $25,000/yr can offset ordinary (W-2) income if you actively participate and your MAGI is under $100k (phasing out to $0 by $150k); unused losses carry forward. On sale, claimed depreciation is recaptured at up to 25%, and gains may owe capital-gains tax (a 1031 exchange can defer both). Figures are a year-1 estimate at your 24.0% rate — not tax advice; consult a CPA.
Schools (NCES district)
- District
- Jefferson County
- NCES district ID
- 0101920
- Math proficiency
- 9% ▼ -24.00%
- Reading proficiency
- 32% ▼ -5.00%
- Median HH income
- $51,712
- Composite
- 18.4/100
- National rank
- #8937
- State rank
- #104 of 129 in AL
Livability — Pinson
- Score
- 60/100
- State rank
- #289
- US rank
- #18763
Category grades
Schools grade is shown separately in the Schools card above.
Census & demographics
- Census place
- Pinson, AL
- County
- Jefferson County · 527,445 people
- City population
- 22,599
- Metro
- Birmingham-Hoover, AL
- Population (ZIP)
- 22,599
- Household income
- $83,732
- Rent vs Own
- Severe rent burden
- 267.0
Population outlook (Jefferson County) Hauer SSP2
- Today (2025)
- 669,185 people
- By 2030
- 669,694 · +0.1%
- By 2040
- 661,388 · -1.2%
- By 2050
- 643,086 · -3.9%
- By 2075
- 577,267 · -13.7%
- By 2100
- 474,758 · -29.1%
Race, ethnicity, and origin ACS 2023
- Neighborhood character
- Diverse neighborhood (Simpson 0.58)
- Race & ethnicity
- White 58% Black 28% Hispanic / Latino 8% Two or more races 7% Asian 2%
- Hispanic origin (detail)
- Mexican 5% Puerto Rican 1%
- Common ancestry
- Slovak 2% Lithuanian 1% Italian 1%
- Foreign-born
- 5% · Canada, China, Jamaica
- Languages at home
- 92% English-only · Spanish 5% Vietnamese 1% Chinese 0%
Political lean MEDSL · Jefferson
- 2024 margin
- D (+10.4) · D 54.6% · R 44.2% · Other 1.2%
- 2008→2024 swing
- +5.4pp toward D · 2008: 5.1pp · 2024: 10.4pp
- All cycles
- 2024: D+10.4 2020: D+13.2 2016: D+7.2 2012: D+6.0 2008: D+5.1
Not yet ingested
- Civics
- —
Market trends
- HPI YoY
- ▼ -54.52%
- Current HPI
- 188.6439
- Rent YoY
- ▲ 1.61%
- Metro
- Birmingham-Hoover, AL
- State GDP YoY
- ▲ 2.94%
- F500 in state
- 4
Industry mix (Fortune 500 HQ in AL)
| Industry | F500 HQs | Revenue |
|---|---|---|
| Financial Services | 1 | $8B |
|
||
| Healthcare | 1 | $5B |
|
||
Price history
+48.2% since first listed5 events — show timeline
- 2026-03-22 Pending — Greater Alabama MLS
- 2026-03-04 Price Changed $215,000 Greater Alabama MLS
- 2026-02-07 Listed $225,000 Greater Alabama MLS
- 2004-06-15 Sold (Public Records) $163,500 Public Records
- 2002-02-27 Sold (Public Records) $145,100 Public Records
Property tax history
+8.2%/yrLatest (2024): $940 · +0.0% YoY. Source: county tax records.
Cash-flow waterfall
monthlySold comps — $/sqft
last 12 mo · ≤1 miLoading sold comps…